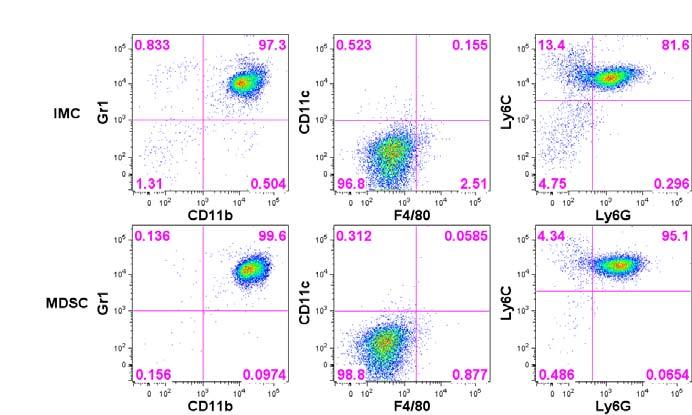
Supplemental figure 1: Phenotype of IMC and MDSC after purification. A. Gating
|
|
|
- Olivia Cole
- 5 years ago
- Views:
Transcription
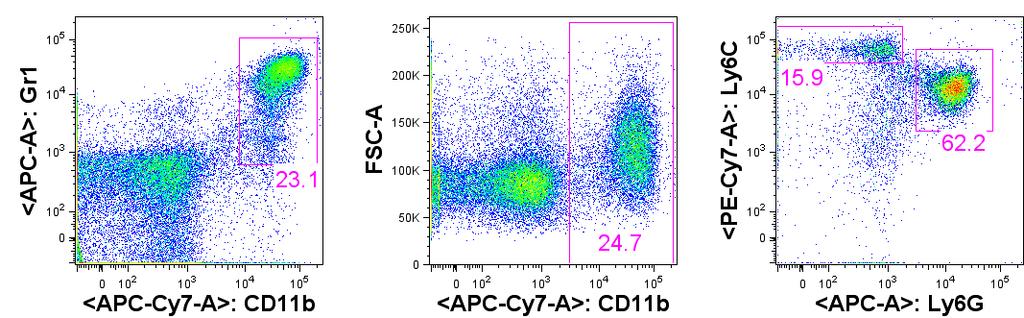
1 Supplemental Figure Legend: Supplemental figure 1: Phenotype of IMC and MDSC after purification. A. Gating strategy for mouse MDSC. CD11b + Ly6C high Ly6G - cells are defined as M-MDSC. CD11b + Ly6C low Ly6G + cells are defined as PMN-MDSC B,C. Gr1 + cells (B) were purified from BM of either naïve (IMC) or EL4 TB (MDSC) mice and Ly6G + cells (C) were purified from spleen of naïve (PMN) or EL4 TB (PMN-MDSC) mice. The expression of CD11b, Gr1, CD11c, F4/8, Ly6G and Ly6C was then assessed by flow cytometry. Typical result is shown. Supplemental figure 2. Apoptosis of Gr-1 + cells in vivo. Frozen section of spleens from naïve and EL4 TB mice were stained with Gr-1 specific antibody (green staining), apoptotic cells using Tunel technology (red staining) and Dapi (blue staining). The slides were analyzed using a Nikon E6 Upright Microscope (bar: 1μm). Left panel - representative pictures. Arrows point on Gr-1 + Tunel + cells. Right panel - the percentage of Tunel + cells among Gr1 + cells. In each experiment at least 2 Gr-1 + were counted. Three experiments were performed (* p<.5). Supplemental figure 3: TRAIL receptors expression. A. BM cells were extracted from naïve or EL4 TB mice. Expression of CD95 (FAS) was assessed by flow cytometry within population of Gr-1 + CD11b + IMC (solid line) or MDSC (dotted line) (isotype control: shaded area). Typical example of three performed experiments is shown. B. Spleen, liver and lung cells were extracted from either naïve or EL-4 TB mice. The expression of CD262 (DR5) was assessed in PMN (solid line) or PMN-MDSC (Dotted line) by flow cytometry. Typical example of three performed experiments is shown. C. The expression of Dc-R1 and Dc-R2 was measured by Western blot in freshly isolated
2 cells (as indicated) (results are representative of 3 different experiments). D. Expression of indicated DcR was determined in BM IMC or MDSC using qrt-pcr. Results represent the average of 3 different samples (*-p<.5). E. DR5 expression in casein mobilized PMN and PMN-MDSC. Naïve and EL4 TB mice (3 weeks after inoculation) were injected i.p. with 12% casein 2 h and 4 h prior harvesting. The peritoneal fluid was collected, and expression of DR5 (CD262) was evaluated on PMN and PMN-MDSC by flow cytometry. Left panel one typical example. Shaded area - isotype; straight line - PMN; dotted line - PMN-MDSC. Right panel statistics on DR5 expression (n=3). * p<.5. Supplemental figure 4. Effect of agonistic DR5 antibody on tumor cells. 4T1, EL4 and EG7 tumor cells were cultured in a plate coated with either MD5.1 mab or an isotype IgG (2µg/mL). After 3 hours, cells were recovered and the percentage of cleaved caspase-3 positive cells was determined by flow cytometry. Typical experiment of three performed is shown. Supplemental figure 5. Effect of agonistic DR5 antibody on splenocytes in TB mice. EL4 TB mice were treated with MD5.1 mab (on day 17, 2 and 23). Phenotype of splenocytes was analyzed by flow cytometry 1 day after the last injection. Results represent the average percentages in 3 mice per group (* p<.5). Supplemental figure 6. Effect of Gr-1 antibody on repopulation of spleen myeloid cells. Mice were injected i.p. with 25 µg of Gr-1 antibody or control IgG. Spleens were analyzed 9 days after injection. A. Typical example of spleens; B. The total number of splenocytes; C. The proportion of monocytes and PMN. In B,C - 3 mice per group were
3 evaluated. The differences between Gr-1 ab treated and IgG treated mice were significant in all graphs (p<.5). Supplemental figure 7. The effect of pro-inflammatory factors on PMN. NF-kB, STAT3 and STAT1 pathway activation in PMN in response to IL-1β, TNFα, IL-6 and IFN-γ were evaluated in PMN stimulated for 1 min with different cytokines as indicated. Supplemental figure 8: ER-stress response in PMN. A,B. PMN were purified from the BM of naïve mice and placed in culture in complete media supplemented with GM-CSF and stimulated or not with thapsigargin. DcR1 and DcR2 expression (A) was measured by Western-blot. B. Expression of chop, xbp1, atf4 and bip was determined in IMC after 2 hour treatment with or without TES using qrt-pcr. Results represent the average of 3 different samples. C. Casein mobilization of neutrophils was performed as described in supplemental figure 3. ER-Stress markers (CHOP and sxbp1) expression were assessed in freshly isolated PMN and PMN-MDSC by Western blot. Three experiments with the same results were performed. Supplemental figure 9: TRAIL-Rs in human MDSC. PMN-MDSC were gated in PBMCs isolated from NSCLC patient by ficoll centrifugation. PMN were subsequently purified from the red blood cells pellet by percoll centrifugation. The expression of CD11b, CD14, CD15 and CD33 was then analyzed by flow cytometry. Typical result is shown.

4 A M-MDSC PMN-MDSC B C Supplemental Fig 1


5 Naïve spleen EL4 TB spleen Supplemental Fig 2 EL4 TB Spleen Naive Spleen % of tunel + cells out of Gr1 + cells

6 A B C IMC PMN MDSC PMN MDSC DcR1 (65 KDa) DcR2 (35 KDa) Beta-Actin (42 KDa) D relative expression to Actin IMC DcR1 MDSC relative expression to Actin IMC DcR2 MDSC E 35 3 * Naive mice TB mice Supplemental Fig 3
7 Supplemental Fig 4
8 B cells CD4+ T cells 5 Untreated MD5.1 mab treated DC Macrophages MDSC NK cells T cells CD8+ T cells Supplemental Fig 5 % of spleen cells


9 Ly6G+ Ly6Clo Ly6Chi Ly6G- CD11b+ Gr1+ A Isotype Gr1 mab B C Isotype mab anti-gr1 mab Supplemental Fig 6 % of live cells Isotype mab anti-gr1 mab
10 Ctrl IL1β TNFα Ctrl IL6 Ctrl IFNγ P-p65 P-Stat3 P-Stat1 p65 Stat3 Stat1 β-actin β-actin β-actin Supplemental Fig 7
11 A NS THG DcR1 (65 KDa) DcR2 (35 KDa) B CHOP sxbp1 ATF4 BIP Beta-Actin (42 KDa) 1 C PMN PMN- MDSC No TES TES Spliced XBP1 (55 KDa) CHOP (27 KDa) Beta-Actin (42 KDa) Supplemental Fig 8

12 Supplemental Fig 9