Population Genetic Differentiation and Diversity of the Blue Crab in the Gulf of Mexico Inferred with Microsatellites and SNPs
|
|
|
- Jasper Chambers
- 5 years ago
- Views:
Transcription

1 Population Genetic Differentiation and Diversity of the Blue Crab in the Gulf of Mexico Inferred with Microsatellites and SNPs Luis Hurtado, Isabel Caballero, Danielle Macedo, Mariana Mateos
2 It is important to study population genetics of the blue crab because it can provide valuable information for its conservation and management Is there any genetic structure? Delineate units for conservation/management Inform about the genetic health of the species, which is important as this crab has been subjected to extensive exploitation Genetic diversity (heterozygosity and allelic diversity) Low diversity can decrease the evolutionary potential (adaptation to change) Degree of inbreeding: Is it high? High inbreeding can lead to inbreeding depression
3 It is important to study population genetics of the blue crab because it can provide valuable information for its conservation and management Inform about signatures of bottlenecks. Sustained high levels of exploitation can have left a genetic signature Provide an idea about the effective population size We know from fisheries data that census size is very large but Ne could be very low (sweepstakes)
4 Early prediction on genetic structure of marine invertebrates with long-lived planktonic larvae: panmixia over broad geographic ranges Because of a lack of obvious physical barriers to dispersal in the world s oceans, species with broadly dispersing larvae should exhibit little genetic structure across their ranges
5 Early prediction on genetic structure of marine invertebrates with long-lived planktonic larvae: panmixia over broad geographic ranges But many recent genetic studies in marine organisms with longlived planktonic larvae show genetic structure even at relatively small scales Many potential barriers for dispersal exist for the blue crab in the US, such as land barriers (Florida peninsula, which may separate the Gulf of Mexico and US Atlantic populations), as well as differences in salinity, and temperatures
6 Population genetic studies of the blue crab have been largely inconclusive and have used the methods available at the time, with their respective limitations they have produced conflicting results used molecular markers with inherent limitations used an insufficient number of molecular markers limited sampling
7 Allozymes Kordos and Burton (1993): three polymorphic allozymes; Texas coast; significant spatial and temporal population genetic differences. Genetic differences detected among megalopa populations in the Texas study could be due to misidentifications between C. sapidus and Callinectes similis (Sullivan and Neigel 2017). McMillen-Jackson et al. (1994): 31 allozyme loci (only nine polymorphic); substantial gene flow among 16 coastal locations between New York and southern Texas (panmixia). Berthelemy-Okasaki and Okasaki (1997): nine allozymes; no significant population structure in samples collected in Louisiana, Alabama, and Texas. Inferences of genetic homogeneity may correspond to overestimates of gene flow from broad scale stabilizing selection acting at the allozyme loci surveyed (Karl & Avise, 1992).
8 Mitochondrial markers McMillen-Jackson and Bert (2004): mitochondrial RFLPs; no geographic structuring among 14 coastal locations from New York to southern Texas, and Yucatán, Mexico (sample sizes per locality were very small). Darden (2004): mtcoi; west/east differentiation in the Gulf of Mexico. Feng et al. (2017): mt NAD2; from Massachusetts to Texas: lack of geographic genetic structure. Mitochondrial markers, however, appear problematic to infer population connectivity and genetic diversity in the blue crab, as extremely high levels of mtdna heteroplasmy have been recently reported in this species: Williams et al. (2017) found as many as 24 different NAD2 haplotypes in a single individual (for which 17 COI haplotypes were also observed) and the dominant haplotype accounted for as little as 43.9% of the total sequences observed within an individual.
9 Nuclear genes Yednock & Niegel (2014): DNA sequences of four nuclear genes; north GOM; consistent with high gene flow. Significant between-year differences were found for adults at one location and near significant spatial differentiation was found across northern Gulf of Mexico locations in High differentiation between GOM and Venezuela.
10 Microsatellites Steven et al. (2005): developed eight highly polymorphic microsatellites (although one pair was reported in linkage disequilibrium) from a blue crab individual in Chesapeake Bay, where they show to be highly variable; report slight genetic variation between two coastal populations at Chesapeake Bay, suggesting fine scale differentiation. Lacerda et al (2016): 7 microsatellites from Steven et al. 2005; no genetic differentiation in southern Brazil. Cushman & Darden (2017): 6 microsatellites from Steven et al. 2005; high genetic diversity of blue crabs in Charleston Harbor, South Carolina.
11 Large-scale studies using microsatellites are lacking for the blue crab within the US Why microsatellites? One of the most widely used markers to examine genetic connectivity in animals, including marine invertebrates. Usually show high levels of genetic diversity Presumed to be neutral markers There is a good understanding of their use in population genetics, as well as the availability of extensive tools for their analyses. Have detected subtle levels of genetic differentiation in highly vagile marine invertebrates.


12 2014, 2015 (9 localities) 2015 SERC 2013, 2014 Lacerda et al. 2016
13 DNA extracted from muscle tissue 9 newly developed polymorphic microsatellite loci + 7 loci used in Lacerda et al., 2016 PCR amplification by the Schuelke (2000) method Genotyping at TAMU. GeneMarker used for allele calling Population genetic analyses
14 Results: general Linkage disequilibrium was not detected. One loci was under putative selection and was discarded. No significant deviations of HWE in 7 of the 15 microsatellites at any US location (at six when pooled). MICRO-CHECKER did not suggest the presence of potential null alleles in four of these loci (the other three have few). Null alleles: non-amplifying alleles (at high frequency in some marine invertebrates). They occur when mutations in the binding site of the targeted DNA sequence prevent the efficient annealing of at least one primer resulting in failure of amplification during the PCR reaction.
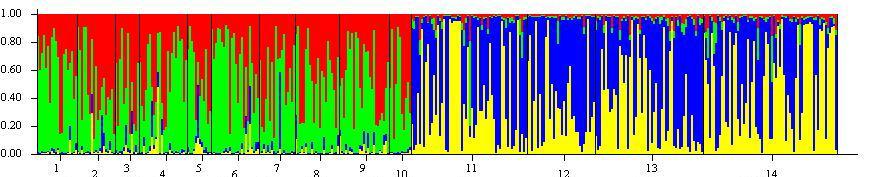
15 Results: No population genetic differentiation within the US No significant Fst without or with correction for null alleles (FreeNA) POWSIM results indicate our dataset has a 100% probability of detecting population structure within the US at Fst values between 0.01 and No indication of geographic genetic structure in STRUTURE, TESS, Principal Coordinate Analyses (PCA), and Factorial Correspondence Analyses (FA)
16 Results: No population genetic differentiation within the US The number of alleles found for each of the five loci in common between the South Carolina (Cushman & Darden 2017) and our study is very similar (27.8 vs. 28.8, respectively), as well as expected heterozygosity (0.78 vs.0.774). Null alleles have been shown to have weak effects on expected heterozygosity in species characterized by high prevalence of null alleles. This is consistent with the finding of substantial gene flow across the US; suggesting that a subsample from a very small area (i.e., Charleston Harbor estuary) adequately captured the genetic diversity found in the whole region. A low frequency of private alleles was found in all populations, which is also consistent with substantial gene flow.

17 A Model: Admixture, Correlated Frequencies B Model: Admixture, Independent Frequencies C Model: No Admixture, Correlated Frequencies D Model: No Admixture, Independent Frequencies


18 Model: Admixture, Correlated Frequencies Model: Admixture, Independent Frequencies Model: No Admixture, Correlated Frequencies Model: No Admixture, Independent Frequencies
19 Genetic diversity within the US High heterozygosity High allelic diversity
20 Inbreeding within the US Low inbreeding coefficients were estimated for the seven loci that did not deviate from HWE: Average F IS among populations for these loci is Pooling data from all localities (i.e., treating the dataset as a single panmictic population), average F IS for these loci is 0.01 (-0.02 for the four loci for which null alleles are not suggested). Inbreeding estimations in these loci are not expected to be largely biased by null alleles, which can inflate homozygosity and thus inbreeding estimations, because they were not detected in four of these loci and were in low frequency in the other three.
21 Bottlenecks, demographic history and effective population size within the US No signatures of bottlenecks using the program Bottleneck. Analyses of past demographic history using MIGRAINE suggest an expansion of the US blue crab population. Estimations of the current population size were much larger than estimations of the ancestral effective population size, as indicated by the Nratio (θ cur / θ anc ). Nratio for the seven loci that were in HWE when pooling all data, using the GSM model was (95% CI: 2.983, 19765). Nratio for the 15 loci dataset with the GSM model was 5.31 (95% CI: 2.48, 15.44) and with the combined SMM/GSM model was 3.05 (95% CI: 1.70, 5.46). Very large effective population size
22 Conclusions and recommendations Genetically, the blue crab appears to be in very good shape in the US: high genetic diversity, low inbreeding, no bottleneck signatures, and a large effective population size. No genetic structure is detected in the US with microsatellites. However, detection of population structure in marine organisms characterized by extremely large populations and high dispersal potential, and/or with recently diverged populations may be difficult using neutral markers, such as microsatellites, because genetic drift is weak, and even low levels of gene flow can homogenize populations. It is important, then, to examine non-neutral markers, which are more sensitive for detecting population structure in this case.
23 ddrad-seq Double Digest Restriction-Site Associated DNA Reduced representation genomic sequencing technique ~1% of the genome

24

25 RAD-seq methodology Library & Sequencing Illumina HiSeq bp reads (run 1 & 2), 160 bp reads (run 3) Assembly De novo Stacks v.1.48 (denovo map, rxstacks) SNPs Discovery & Filtering Stacks v.1.48 (populations) VCFtools for filtering and thinning Outlier analyses Genetic Structure Arlequin PCAdapt Bayescan F ST Bayesian Clustering (Structure) DAPC (Discriminant Analyses of Principal Components)
26 Inferring genetic structure within runs Putative neutral markers Putative selective markers Used to infer genetic differentiation (Fst) Can be more informative in cases where populations are (1) extremely large, (2) there is high dispersal and (3) recent divergence

27 Outlier detection

28 Inferences on genetic structure with putative neutral markers (run 1) 12 localities; 78 samples 2014 and 2015 Very low and no significant pairwise Fst No genetic structure detected with STRUCTURE and DAPC Same patterns were observed using 29 putative selective markers No evidence of genetic structure in sampled populations of the Gulf of Mexico
29 Inferences on genetic structure with putative neutral markers (run 2) 8 localities; 89 samples 2014 and 2015 No significant pairwise Fst No genetic structure detected with STRUCTURE and DAPC Similarly to run 1 no genetic structure in sampled populations of the Gulf of Mexico & the Atlantic
30 Inferences on genetic structure with putative selective markers (run 2) However, DAPC with 54 putative selective markers shows evidence of genetic structure in sampled populations of the Gulf of Mexico & the Atlantic

31 Inferences on genetic structure with putative neutral markers (run 3) 97 samples; 6 localities 2015 and 2016 West GOM vs FL have low but significant Fst But no genetic structure detected with Bayesian clustering and/or DAPC

32 Inferences on genetic structure with putative selective markers (run 3) Two genetic clusters were detected with STRUCTURE and DAPC using 16, 70 and 86 outliers Both methods indicate genetic structure between sampled populations of the West Gulf of Mexico & Florida
33 Conclusions and recommendations There is genetic structure in the US. This structure is only detected with putative non-neutral markers. Next: whole-genome analyses.


34 Acknowledgements

35 QUESTIONS?
36 RUN 1 RUN 2 RUN 1 RUN RUN 2 RUN