Bioreactor Design & Operation; Demonstration Projects, Results & Future Directions. Debra Reinhart, PhD, PE, DEE University of Central Florida
|
|
|
- Kristopher Byrd
- 5 years ago
- Views:
Transcription
1 Bioreactor Design & Operation; Demonstration Projects, Results & Future Directions Debra Reinhart, PhD, PE, DEE University of Central Florida
2 Presentation Overview Florida bioreactor landfill demonstration project Overview Results Economics Methane generation by wet cell landfills Future directions of bioreactor landfills

3 Florida Bioreactor Landfill Demonstration Project
4 Project Objective To design, construct, operate and monitor a full-scale landfill bioreactor in Florida in a manner that permits a complete and fair evaluation of this technology as a method of solid waste management in Florida, with appropriate consideration of science, engineering, environmental and economic issues.
5 Florida Bioreactor Demonstration Project Goals and Objectives The objectives of the landfill bioreactor demonstration are to: Design and operate the bioreactor technology using innovative techniques and concepts. Control and measure all major inputs and outputs. Develop standardized design and operation procedures for this technology. Further define and quantify the true costs and benefits of landfill bioreactors.
6 Florida Bioreactor Demonstration Project Goals and Objectives Evaluate the use of aerobic bioreactor landfill technology Compare the aerobic approach to the use of anaerobic bioreactor technology. Instrument the landfills to permit in-situ monitoring of bioreactor activity Monitor the landfills in a manner to measure the impact of bioreactor activities
7 New River Regional Landfill
8 New River Regional Landfill Located in Union County Florida Manages waste from several North Florida Counties (approximately 800 tons per day) Retrofit Bioreactor
9 Project History Project Development & Design Well Field Installation Leachate Recirculation Initiated Permit Application Submitted Permit Awarded Construction Air Injection Initiated
10 Bioreactor Features Leachate recirculation system Air injection system Exposed geomembrane cap (EGC) Gas collection system In-situ instrumentation Segregated leachate collection system
11 New River Regional Landfill

12 NRRL Bioreactor Construction Aerials View to North June 24, 2002


13 Installation of Vertical Wells Top of Landfill Top of Sand Drainage Blanket 10 ft

14
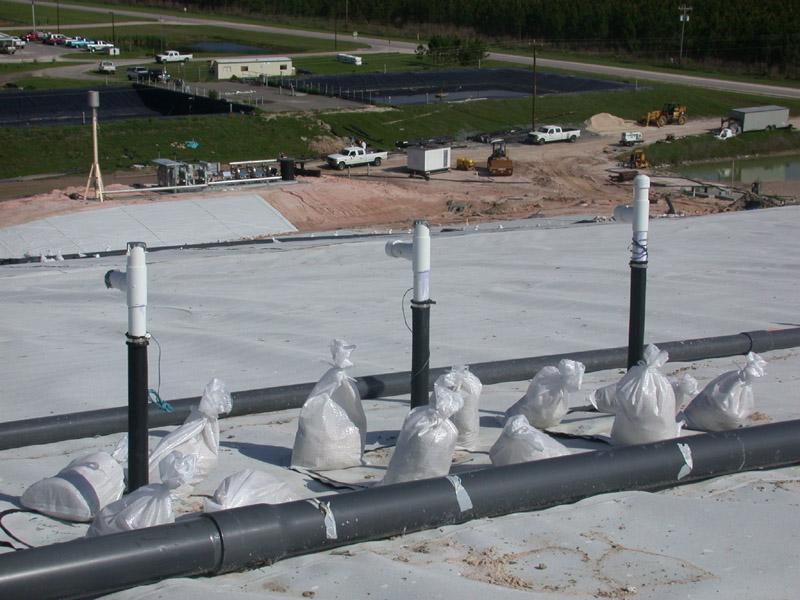
15 Vertical Injection Well Clusters Leachate Distribution Manifold


16 MTG Sensors In addition to leachate/air injection wells, the researchers will also be installing instrumentation within the landfill to measure Moisture, Temperature and Gas composition. Future updates will discuss the operation of these MTG sensors in more detail. In short, these gravel- packed slotted PVC cylinders contain a device for sensing the degree of moisture present, as well as a temperature thermocouple and a tube for collecting gas samples.

17 Vertical Injection Well Clusters Instrumentation Cluster

18 Toe Drain Toe Drain Under Construction
19

20 NRRL Gas Extraction System Gas is collected from the horizontal trenches underneath the exposed geomembrane cap Geomembrane Cap Subsurface Collector
21 Gas Extraction Manifold

22 Candle-Stick Flare Two Positive Displacement Air Blowers Three Centrifugal Gas Extractors
23
24
25 Moisture Distribution Higher moisture content Before recirculation (Day 150) After recirculation (3,200 m 3 ) (Day 318) 30 Lower moisture content After recirculation (10,000 m 3 ) (Day 491) After recirculation (14,700 m 3 ) (Day 578)
26 Estimated Moisture Content 70 Moisture Content (% w/w) Based on mass balance Based on conductivity =8 ms/cm Based on conductivity =16 ms/cm Days (Day 1 = 01/01/03)
27 Settlement Around a Vertical Well Settlement (ft) Radial distance from the well Cluster (ft)
28 Settlement and Moisture Addition Settlement (feet) Moisture Added (in Gallons)
29 The Presence of Moisture can Greatly Impact Air Permeability Air Permeability (X10-13 m 2 ) Period of Leachate Recirculation Days (0= day of start of recirculation)
30 Hydraulic Conductivity The hydraulic conductivity of waste (K s ) was determined by conducting borehole permeameter tests. These tests involve measuring the steady-state pressure at the bottom of the well for a constant flow rate. Pressure (ft w.c.) Pressure Flow rate Flow rate (gpm) Time (Days) 0.0
31 Hydraulic Conductivity Number of Locations Field saturated hydraulic conductivity, K s ( 10-6 cm/sec) AM±SD Upper Layer (3-6 m deep) Middle Layer (6-12 m deep) Deep Layer (12-18 m deep) ± ± ±0.50
32 Summary Florida bioreactor project has met its objectives to develop design and operating criteria, if not to achieve bioreactor status Multiple publications, theses, and dissertations have been published Bioreactor continues to be operated with leachate and air injection Data compilation and release will occur over the next year.
33 Florida Bioreactor Landfill Demonstration project was funded by the Hinkley Center for Solid and Hazardous Waste Management.
34 Bioreactor Landfill Economics Objectives: Evaluate the economic feasibility of aerobic and anaerobic bioreactor landfills, comparing their costs to conventional landfills
35 Total Present Worth Cost Comparison 60 Present Worth (Million $) Traditional Retrofit Bioreactor (anaerobic) As built bioreactor (anaerobic) Gas recovery (%) Type Settlement (%)* During filling After filling Traditional Retrofit bioreactor (anaerobic) As built bioreactor (anaerobic) *Air space recovery is assumed to be utilized at the end of the retrofit bioreactor life and as it occurs in the as-built bioreactor
36 Post Closure Savings 5 Post-Closure Cost (Million $) yrs Traditional 30 yrs Bioreactor 25 yrs Bioreactor 20 yrs Bioreactor 15 yrs Bioreactor 10 yrs Bioreactor
37 PW Cost of a Hybrid Landfill as a Function of Duration of Air Addition Present Worth (Million $) Retrofit As-Built With Gas Recovery Air addition (years)
38 PW Cost of a Hybrid Landfill as a Function of Duration of Air Addition No Gas Recovery 55 retrofit As-built Present Worth (Million $) Air addition (years)
39 Conclusions Without advantages associated with reduced PCC, retrofit bioreactor and traditional landfill PW costs are extremely close As-built bioreactor landfills have lower costs than traditional and retrofit bioreactor landfills, mainly because of air space recovery and leachate treatment Utilization time of recovered air space is important. If utilized at the end of a bioreactor it is not nearly as profitable as if utilized as it is occurring. Cost of aerobic landfills is greater than anaerobic when gas recovery and use is possible. The difference reduces when no gas recovery is planned or where leachate treatment costs are high. Inefficient gas collection during active phase reduces the benefit of enhanced gas production
40 Design Implications Location of injection Sufficient distance from side slopes ( ft) Sufficient waste above (~ 20 ft) Spacing of 50 ft common ft ft ft MSW Horizontal Injection Spacing MSW Vertical Injection Spacing
41 Design Implications - Continued Liquid introduction rates Horizontal injection ( gpm/ft trench) Vertical injection Injection rates of gpm Well specific capacity 10-6 to 10-7 m 3 /sec/m of screen length Maximize flexibility with multiple sources and systems Avoid impermeable daily cover Allow for settlement using flexible hose connections Provide cleanout
42 Design Implications Cont d Materials of construction usually HDPE Pipe diameter 3-4 in Trench width 3-5 ft Perforation size 3/8 to ¾ in Bedding materials Chipped tires Stone/gravel Crushed glass
43 Wet Cell Gas Generation LFG Flow Rate (m 3 /Yr) 25,000,000 20,000,000 15,000,000 10,000,000 5,000,000 k = 0.5 k = 0.2 k = Year
44 Data Collection Sites with continuous flow data, waste placed at one time: Yolo Co. Test Cells and Full Scale Cells (NE and WS), DSWA Test Cells, Brogborough Test Cells, and GIT Sites with continuous flow data, waste placed over multiple years: Southern Solid Waste Management Center (Delaware), Central Solid Waste Management Center (Delaware), and Landfill A Sites with single data points (16) - multiple full-scale wet landfills where data were not collected over a long period of time
45 Selected Single Points 25.0 Specific Methane Flow Rate (m 3 /Mg-yr) Weighted Age (yrs) Selected Single Points Best Fit Curve Wijster BR, Netherlands Sorab Test Cells Middle Penincula,VA Middle Penincula,VA Alachua Co,FL Alachua Co,FL Crow Wing,MN Salem Co., NJ Spruce Ridge,MN
46 Wet Cell Model Parameters Summary Method k (yrs -1 ) L o (m 3 /Mg) Single Placement Sites Brogborough Wet Yolo Full-scale NE Yolo Pilot Wet Multiple Placement Sites SSWMC Landfill A CSWMC Mixed-effects Model Mean Upper 95% Lower 95%
47 Study Recommendations k = 0.3 year -1 Lo of 100 m 3 /Mg
48 Future Directions Role of aerobic bioreactor landfilling In situ nitrification/denitrification Pump and treat aerobic flushing bioreactor landfill

49 Aerobic Landfills
 Reduce environmental risk")
50 Advantages Enhance waste degradation Mitigate odor and methane emissions Increase settlement/airspace recovery Reduce leachate management liability and costs Removal of anaerobically recalcitrant compounds (i.e. ammonia-nitrogen) Reduce environmental risk

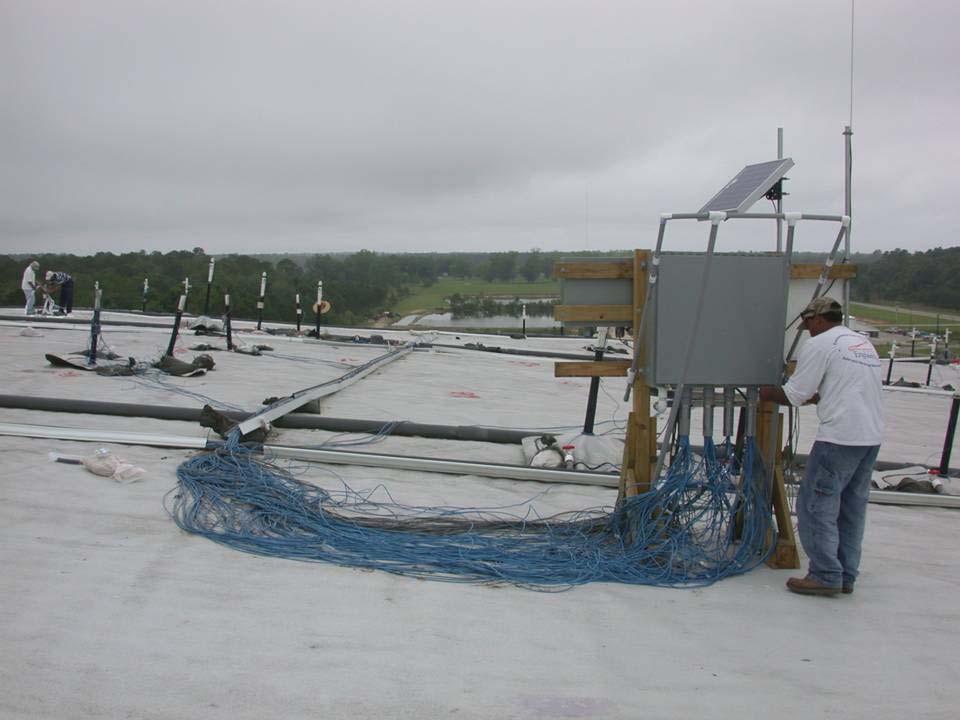
51 Challenges Associated with Aerobic Operation Distribution and control of air and liquids Horizontal liquid application may In aerobic systems, waste settlement is more rapid and pronounced, thus horizontal leachate application may not be appropriate Control of temperature Changes in waste characteristics may be beneficial to air distribution, as changes in air flow patterns may result potentially maximizing the air and liquids coverage area Injection Lines at NRRL

52 Challenges Associated with Aerobic Operation In-situ monitoring of conditions to ensure that air and liquids follow similar flow patterns Determining the amount of air required (the rate of mass transfer of oxygen from the gas phase to the liquid is unknown)
 Metal migration Collection system clogging (CO 2 ) Blower System at Williamson")
53 Challenges Associated with Aerobic Operation Economics Aerobic operation costs more than anaerobic Additional capital cost, electricity Reduced leachate management Unknown emissions Gaseous (nitrous oxide, volatile organics) Metal migration Collection system clogging (CO 2 ) Blower System at Williamson County
54 Future of US Aerobic Landfills Air injection will more likely be used periodically Initiate biological reactions early in the landfill life Remediate old landfills Polish leachate quality (remove ammonia-nitrogen) and anaerobically recalcitrant waste (air addition at end of landfill life) Hybrid bioreactor landfills with either short term cycling of air injection into the landfill or sequencing of aerobic and anaerobic conditions
 1400 1200 1000 800 600 400 200 0 0 2 4 6 8 10 12 Landfill Age")
55 In Situ Nitrification/Denitrification 1600 Ammonium-Nitrogen Concentrations (mg/l) Landfill Age (Years)

56 Why Remove Ammonia? Toxicity Oxygen demand Impact on post-closure
57 In Situ Nitrification/Denitrification Ammonia readily and rapidly disappears at all oxygen levels and can occur at temperatures as high as 45 o C Ammonia Concentration (mg N/L) Raw Data Predicted Trend Predicted Trend w / Inhib Time (Days) Temperature = 45C Oxygen = 17%
58 Field-Scale Implementation Plan Landfill Nitrogen Removal Zone Air Injection Leachate Injection Leachate Injection Nitrification Region Apply in old waste environments Apply to smaller areas of the landfill (dedicated treatment zones) Oxygen must be present, the higher the faster the rate ph should be near neutral No Air Addition Anoxic Region for Denitrification
59 Economics of Process Equipment needed: Air blower Air injection piping Costs taken into account: Air blowers (capital and operating costs) Leachate injection operation cost Air piping cost Maintenance and landfill personnel time
60 Economics of Process Leachate Injection Rate (L/m 2 -day) Total Process Cost in Present Value ($) Volume Leachate Treated (gal) $/gal of Leachate Treated 20 75, x , x , x On-site leachate treatment ranges from $ /gal Off-site leachate treatment ranges from $ /gal
61 Objectives of a Sustainable Landfill Landfill emissions must be controlled to ensure minimal environmental impacts The residues left in landfills should not pose unacceptable risk to the environment and the need for postclosure care should not be passed to the next generation
62 Beyond the Bioreactor Landfill Leachate Recirculation/ Flushing Ex Situ Oxidation Chemi cal Reactor Leachate Treatment Bioreactor Landfill Aeration Leachate flushes C & N Leachate is chemically treated outside the cell, Pumped back into the cell to transport more of the releasable C & N Additional C & N removed by aerobic biodegradation The Pump and Treat Aerobic Flushing Bioreactor Landfill Complete Stabilization of Solid Waste Cells
63 Questions?