2014 Pearson Education, Inc. Mapping Gene Linkage
|
|
|
- Simon Watson
- 5 years ago
- Views:
Transcription

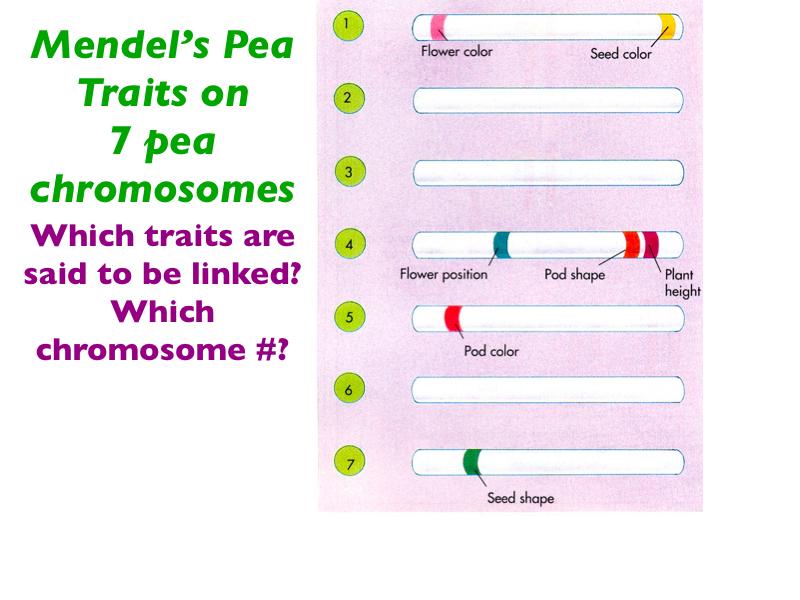
1 Mapping Gene Linkage

2
3

4 Dihybrid Cross - a cross showing two traits e.g pea shape and pea color
5
6
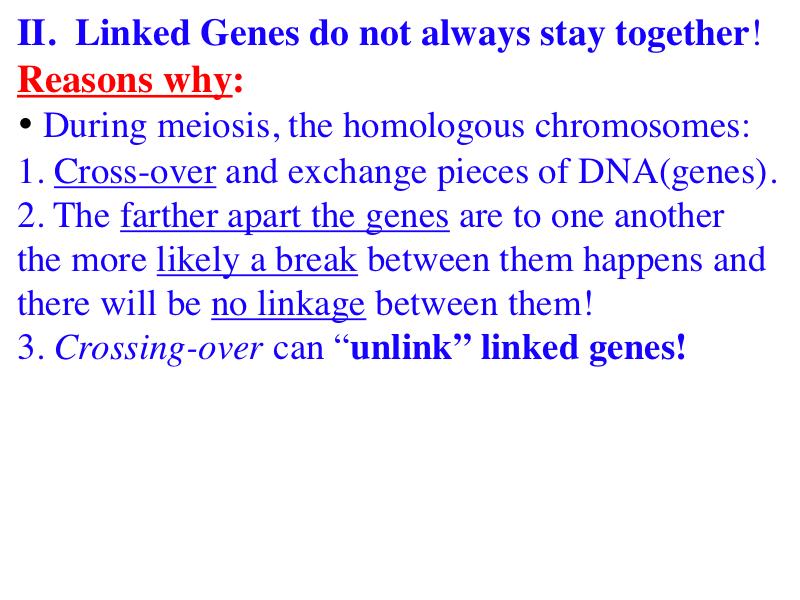
7 The farther apart the genes are to one another the more likely a break between them happens and there will be no linkage between them!
!")
8 Linked genes tend to be inherited together because they are located near each other on the same chromosome:! Each chromosome has hundreds or thousands of genes (except the Y chromosome)! Genes located on the same chromosome that tend to be inherited together are called linked genes
9
 did other experiments with fruit flies to see how linkage affects inheritance of two")
10 How Linkage Affects Inheritance! Morgan (1910) did other experiments with fruit flies to see how linkage affects inheritance of two characters! Morgan crossed flies that differed in traits of body color and wing size
 b b vg vg F 1 dihybrid testcross Wild-type F 1 dihybrid (gray body, normal wings) b + b vg + vg Homozygous recessive (black body, vestigial wings) b b")
11 ! Morgan tracked flies that differed in traits of body color and wing size Experiment P Generation (homozygous) Wild type (gray body, normal wings) b + b + vg + vg + Double mutant (black body, vestigial wings) b b vg vg F 1 dihybrid testcross Wild-type F 1 dihybrid (gray body, normal wings) b + b vg + vg Homozygous recessive (black body, vestigial wings) b b vg vg
 1 : 1 : 0 : 0 (Due to genetic recombination of linked genes) 965 : 944 : 206")
12 Experiment Testcross offspring Eggs b + vg + b vg b + vg b vg + Wild type (gray-normal) Blackvestigial Grayvestigial Blacknormal b vg Sperm b + b vg + vg b b vg vg b + b vg vg b b vg + vg PREDICTED RATIOS Genes on different chromosomes: Genes on the same chromosome: Results 1 : 1 : 1 : 1 (Due to independent assortment) 1 : 1 : 0 : 0 (Due to genetic recombination of linked genes) 965 : 944 : 206 : 185
13 ! Morgan found that body color and wing size are usually inherited together in specific combinations (parental phenotypes)! He noted that these genes do not assort independently, and reasoned that they were on the same chromosome

14 ! However, nonparental phenotypes were also produced! Understanding this result involves exploring genetic recombination, the production of offspring with combinations of traits differing from either parent


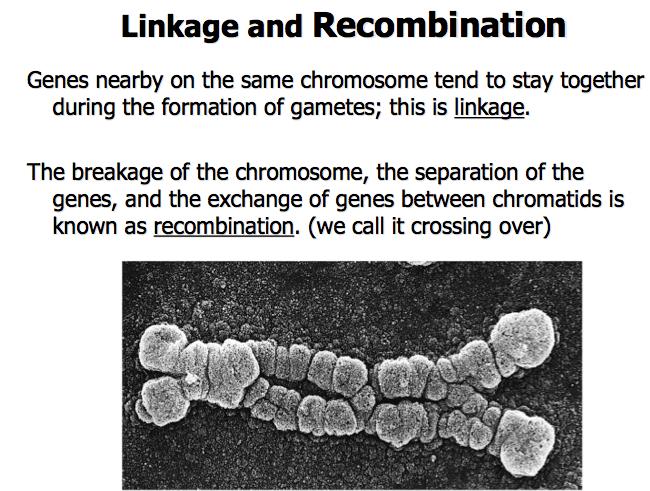
15 Genetic Recombination and Linkage! The genetic findings of Mendel and Morgan relate to the chromosomal basis of recombination
16 Recombination of Unlinked Genes: Independent Assortment of Chromosomes! Offspring with nonparental phenotypes (new combinations of traits) are called recombinant types, or recombinants! A 50% frequency of recombination is observed for any two genes on different chromosomes 50% recombination frequency
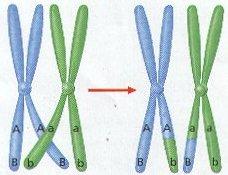
17 Recombination of Linked Genes: Crossing Over! Morgan discovered that genes can be linked, but the linkage was incomplete, because some recombinant phenotypes were observed! He proposed that some process must occasionally break the physical connection between genes on the same chromosome! That mechanism was the crossing over of homologous chromosomes during Prophase I
18 Chromosomal basis for recombination of linked genes: Meiosis II Recombinant chromosomes Eggs b + vg + b vg b + vg b vg + Testcross offspring Wild type Black- Gray- Black- (gray-normal) vestigial vestigial normal b + vg + b vg b + vg b vg + b vg b vg Parental-type offspring b vg b vg Recombinant offspring b vg Sperm Recombination frequency = 391 recombinants 2,300 total offspring 100 = 17%
19 New Combinations of Alleles: Variation for Natural Selection! Recombinant chromosomes bring alleles together in new combinations in gametes! Random fertilization increases even further the number of variant combinations that can be produced! This abundance of genetic variation is the raw material upon which natural selection works


20 Mapping the Distance Between Genes Using Recombination Data:! Alfred Sturtevant, one of Morgan s students, constructed a genetic map, an ordered list of the genetic loci along a particular chromosome (not precise gene location, but relative)! Sturtevant predicted that the farther apart two genes are, the higher the probability that a crossover will occur between them and therefore the higher the recombination frequency
, represents a 1% recombination frequency!")
21 ! A linkage map is a genetic map of a chromosome based on recombination frequencies! Distances between genes can be expressed as map units; one map unit, or (centimorgan), represents a 1% recombination frequency! Map units indicate relative distance and order, not precise locations of genes
22 Results Chromosome Recombination frequencies 9% 9.5% 17% b cn vg The frequency of crossing over between any two linked genes is proportional to the distance between them. Experimentally, the percentage of recombinant offspring is correlated with the distance between the two genes If the genes are far apart = more recombinant offspring If the genes are close = fewer recombinant offspring
23
24
25 ! Genes that are far apart on the same chromosome can have a recombination frequency near 50%! Such genes are physically linked, but genetically unlinked, and behave as if found on different chromosomes

26 ! Sturtevant used recombination frequencies to make linkage maps of fruit fly genes! He and his colleagues found that the genes clustered into four groups of linked genes (linkage groups)
27
28 Genetic maps are useful in many ways: they Allow us to understand the overall complexity and genetic organization of a particular species. Improve our understanding of the evolutionary relationships among different species. Can be used to diagnose, and perhaps, someday to treat inherited human diseases. Can help in predicting the likelihood that a couple will produce children with certain inherited diseases. Provide helpful information for improving agriculturally important strains through selective breeding programs.
29 Mapping Genes and Linkage respond in your notebook (We will reconsider crossing-over as a source of genetic mixing and genetic linkage). Scenario: There are two homologous pairs of chromosomes in a cell and you are tracking one gene on each chromosome pair. Pretend that the cell is in a person who is heterozygous for both genes and so has the genotype AaBb = 2n.
30 Mapping Genes and Linkage respond in your notebook 1. What is the chance A combining with B over b, or b over B? (ie.producing a haploid gamete of the genotype AB, or Ab)? 2. What is the chance of this person producing a haploid gamete of the genotype: a combining B over b, or b over B? (ie.producing a haploid gamete of the genotype ab, or ab)? (refer to drawing 1) (AaBb)
31 (refer to drawing 2 now): 3. What is the chance A combining with B over b, or b over B? (i.e. producing a haploid gamete of the genotype AB, or Ab)? 4. What is the chance of this person producing a haploid gamete of the genotype: a combining B over b, or b over B? (ie. producing a haploid gamete of the genotype ab, or ab)? (AaBb)
32 (refer to drawing 3 now): 5. What is the chance A combining with B over b, or b over B? (i.e. producing a haploid gamete of the genotype AB, or Ab)? 6. What is the chance of this person producing a haploid gamete of the genotype: a combining B over b, or b over B? (i.e. producing a haploid gamete of the genotype ab, or ab)? (AaBb)
33 As the genes get closer together, the probability of recombination will get lower (and therefore the recombination % numbers will decrease) because the genes are less likely to cross over, segregate and independently assort they will be linked, so that when one goes to a gamete the other is more likely to go to the same gamete. 7. If genes are located closer to one another, what happens to their recombination frequency?
34 8. If gene A recombines 12% of the time with gene B but 16% of the time with gene C, which gene is closer to gene A? 9. If gene B and C recombine with one another 28% of the time, what is the order of genes A, B and C along the chromosome? 10. What are the map units or centimorgans for genes A and C? For genes B and C? 11. Draw a line to represent the chromosome showing the relative gene locations? (MAP YOUR GENES)
35 Practice Problems: Imagine a species with three loci thought to be on the same chromosome. The recombination rate between locus A and locus B is 35%, and the recombination rate between locus B and locus C is 33%. 12. By mapping, predict the recombination rate between A and C. 13. Draw a line to represent the chromosome showing the relative gene locations? (MAP YOUR GENES)
36 14. In a series of mapping experiments, the recombination frequencies for four different linked genes of Periplaneta americana were determined as shown in the figure. What is the order of these genes on a chromosome map? A) sh-la-vg-b B) vg-b-sh-la C) la-sh-b-vg D) b-la-sh-vg
37 15. Which of the following two genes are closest on a genetic map of Periplaneta americana? A) b and sh B) vg and la C) sh and la D) la and b


38 6 vg sh la b 2 12