Pharmaceutical Innovation at a Crossroads
|
|
|
- Lewis Barker
- 5 years ago
- Views:
Transcription


1 Pharmaceutical Innovation at a Crossroads The New Face of Pharma R&D Kenneth I Kaitin, Ph.D. Director and Research Professor Tufts Center for the Study of Drug Development Global Clinical Supply Group Annual Meeting Jacksonville, FL, April 4, 2011

2 The Tufts Center for the Study of Drug Development
3 Tufts CSDD is an... Academic Independent Multidisciplinary Strategy and Policy Research Group
4 The Tufts Center for the Study of Drug Development
5 Agenda Environment for pharmaceutical innovation TCSDD s current drug development metrics The evolving landscape for innovation
6 The Current Landscape for Pharma Innovation

7 Current Realities for Pharmaceutical Developers Patents on many high revenue products are expiring Marketplace is highly competitive and reimbursement environment is increasingly restrictive Public support is low Regulatory hurdles are increasing Pharmaceutical R&D remains a long, risky, and expensive process
8 Patent Expirations of 10 Top Selling Drugs Each Year Product 2009 Sales ($MM) Product 2009 Sales ($MM) Product 2009 Sales ($MM) Product 2009 Sales ($MM) Aricept 3,991 Lipitor 12,535 Plavix 9,801 Cymbalta 4,660 Cozaar 3,561 Advair 7,794 Enbrel 6,575 AcipHex 2,728 Effexor XR 3,182 Zyprexa 4,916 Diovan 6,013 Humalog 1,959 Taxotere 3,034 Levaquin 2,648 Seroquel 5,126 Zometa 1,469 Protonix 2,052 Xalatan 1,737 Singulair 4,660 Niaspan* 853 Flomax 1,970 Concerta* 1,326 Lexapro 3,263 Lovaza 705 Arimidex 1,921 Femara 1,292 Avapro 3,088 Xopenex^ 357 Gemzar 1,363 Xeloda 1,160 Actos 2,532 Zomig^ 166 NovoSeven 1,320 Avelox 1,020 Viagra 1,892 Advicor^ 80 Coreg^ 253 Caduet 548 Avandia 724 Fuzeon^ 26 Total $22,647 Total $34,976 Total $43,674 Total $13,003 *Year of first available generic ^US Sales only Sources: Kaitin, Clin Pharmcol Ther, 2010;87: ; Medco; FDA Orange Book; (sales data): MedAdNews; Medco
9 Patent Expirations of 10 Top Selling Drugs Each Year By Company Product 2009 Sales ($MM) Product 2009 Sales ($MM) Product 2009 Sales ($MM) Product 2009 Sales ($MM) Pfizer 3,991 Pfizer 12,535 BMS 9,801 Lilly 4,660 Merck 3,561 GSK 7,794 Amgen/Pfizer 6,575 Eisai 2,728 Pfizer 3,182 Lilly 4,916 Novartis 6,013 Lilly 1,959 Sanofi Aventis 3,034 J&J 2,648 AstraZeneca 5,126 Novartis 1,469 Pfizer 2,052 Pfizer 1,737 Merck 4,660 Abbott 853 Boehringer Ingl 1,970 J&J 1,326 Forest 3,263 GSK 705 AstraZeneca 1,921 Novartis 1,292 BMS/SAN 3,088 Sunovian 357 Lilly 1,363 Roche/Genentech 1,160 Takeda 2,532 AstraZeneca 166 Novo Nordisk 1,320 Bayer 1,020 Pfizer 1,892 Abbott 80 GSK 253 Pfizer 548 GSK 724 Roche/Genentech 26 Total $22,647 Total $34,976 Total $43,674 Total $13,003 Sources: Kaitin, Clin Pharmcol Ther, 2010;87: ; Medco; FDA Orange Book; (sales data): MedAdNews; Medco

10 Industry Leaders in Lost Revenues Due to Patent Expirations Pfizer $29.2 Lilly BMS GSK Novartis AstraZeneca $12.9 $11.3 $9.5 $8.8 $7.2 Merck Sanofi Aventis J&J Forest $4.7 $4.6 $4.0 $ Billions of US$ Sources: Kaitin, Clin Pharmcol Ther, 2010;87: ; Medco; FDA Orange Book; (sales data): MedAdNews; Medco

11 Top Ten R&D Spenders for 2010 Pfizer Roche $9.4 $9.2 Merck Novartis $8.1 $8.1 J&J $6.8 GSK Sanofi Aventis AstraZeneca Lilly $6.1 $5.9 $5.3 $4.9 BMS $3.6 Billions of US$ Sources: FierceBiotech, 3/8/11
12 New Drug Approvals New Drug Approvals Are Not Keeping Pace with Rising R&D Spending R&D Expenditures New Drug Approvals 26 R&D Expenditures (Billions of 2008$) * Trend line is 3-year moving average; R&D expenditure adjusted for inflation Source: Kaitin, Clin Pharmacol Ther, 2010;87:

13 Billions of US Dollars Market Caps for Top-Tier Firms have Dropped $578b in 10 Years $320 $287 Market Cap on Market Cap on $213 $173 $134 $143 $108 $101 $104 $90 $85 $83 $68 $64 $76 $73 $44 $38 $46 $0 PFE MRK GSK BMY LLY AZN WYE SGP ABT * Market caps for WYE and SGP on Source: Kaitin, Clin Pharmacol Ther, 2010;87:

14 . Apple Unveils New ipods, Roger Cheng and Ben Charny WSJ OnLine, September 5, 2007
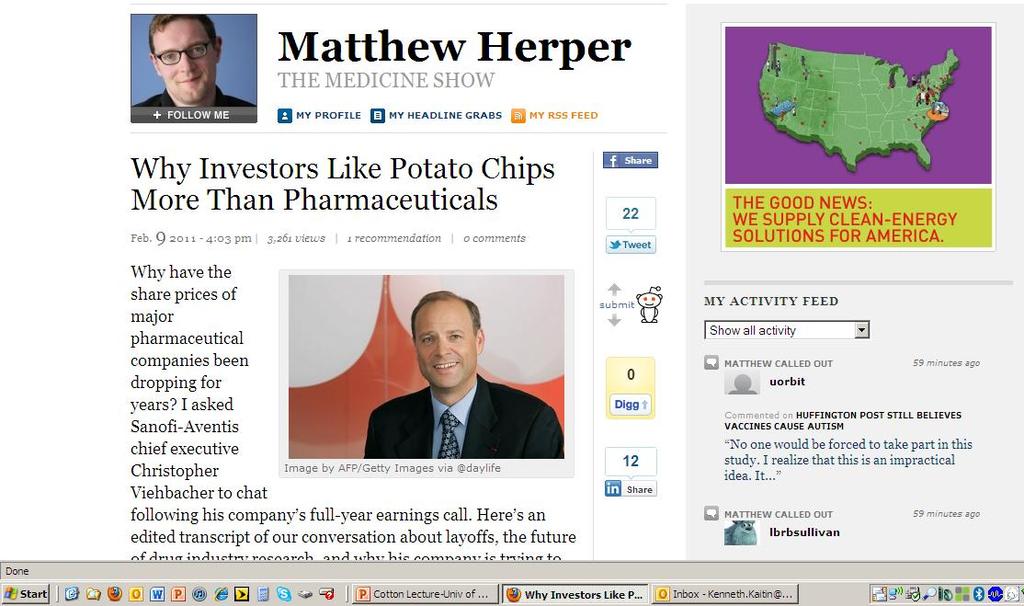
15 High Profits and Falling Stock Prices Reflect Investor Concern About Pipeline Viability and R&D Performance
16
17
18 Bringing a New Drug to Market: Current Development Metrics

19 Clinical and Approval Times Vary Across Therapeutic Classes, CNS Antineoplastic Endocrine Cardiovascular Immunologic Gastrointestinal Antiinfective* Anesthetic/Analgesic AIDS Antivirals Years 0 11 * excludes AIDS antivirals Clinical Phase Approval Phase Source: Kaitin & DiMasi, Clin Pharmacol Ther, 2011;89:
20

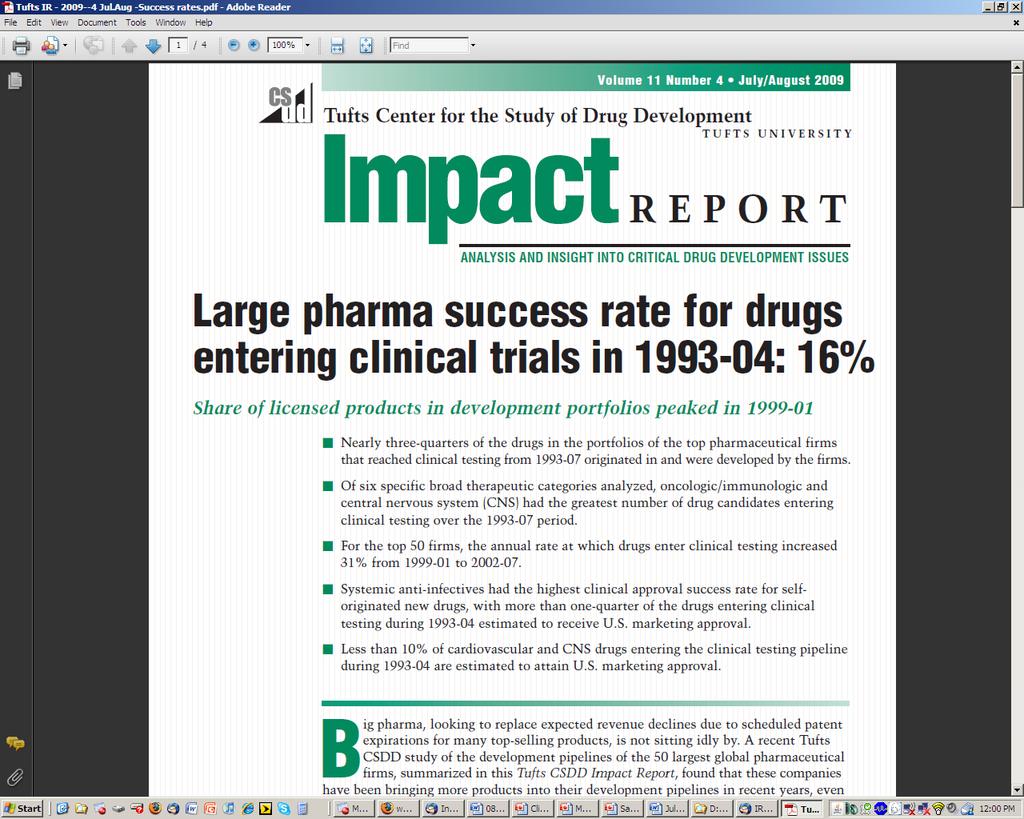
21 Overall Clinical Approval Success Rate for NCEs has Dropped to 16% Sys. Antiinfective 23.9% Musculoskeletal 20.4% Oncology/Immunology 19.4% GI/Metabolism 9.4% Cardiovascular 8.7% CNS 8.2% 0 27 Clinical Approval Success Rate Source: DiMasi et al, Clin Pharmacol Ther, 2010;87:

22 Transition Probability Phase Transition Probabilities by Therapeutic Class 100 Musculoskeletal Onc/Immunologic GI/Metabolic 80% 79% 72% 72% 68% 63% 60% 58% Cardiovascular CNS Syst Antiinfective 49% 52% 55% 50% 64% 46% 35% 35% 32% 33% 0 Phase 1-2 Phase 2-3 Phase 3-NDA subm Source: DiMasi et al, Clin Pharmacol Ther, 2010;87:
23
 Source: DiMasi & Grabowski, Managerial Decision Econ,")
24 Millions of 2005 Dollars Long Development Times + Low Success Rates = High R&D Costs ,241 1, Non-Clinical Clinical Total Costs Biotech Pharma (Time Adjusted) Source: DiMasi & Grabowski, Managerial Decision Econ, 2007;28:
25 Drivers of High Cost, Low Success Drug Development Chronic and complex indications Clinical trial size Increased protocol complexity Patient recruitment/retention Poor preclinical screens and predictive models Regulatory demands Commercial demands
26

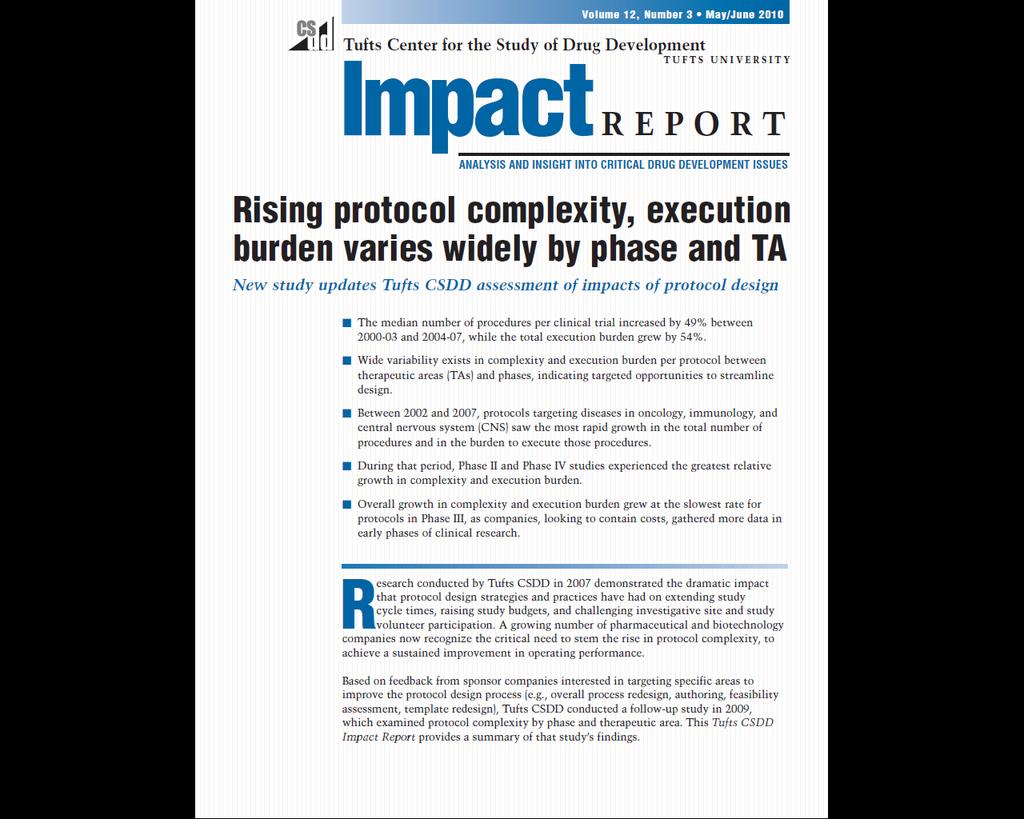
27 Source: Tufts CSDD Impact Report, Vol 12, No 3, May/June 2010
28 For the Research-Based Industry Business as Usual is No Longer an Option
29 Reported Success Factors Best Practices of Top-Performing Firms Focus on core competencies, higher level of outsourcing, prioritize resources Active collaboration with global regulatory agencies Enhanced utilization of e-data management technologies Global development strategy Source: Tufts CSDD, 2011
30 New R&D Strategies: 2 Approaches R&D Reorganization Focused units: e.g., GSK (CEDDs DPUs), PFE, ROG, NVS, BMS, SAN, LLY, AZN Divested functions: e.g., LLY-Chorus/Vanthys; LLY-Covance; SAN-Covance; BMS-Accenture; AZN-(API); LLY-Advion (bioanalytics) Partnerships and Alliances Academic institutions, PPPs, Patient groups Risk-sharing: e.g., LLY & Quintiles; MRK & PRXL (follow-on biols.) Pharma/Pharma: e.g., MRK & AZN, SAN & DE:MRK (onc); GSK & PFE (HIV); Enlight Biosciences (JNJ, LLY, MRK, NVS, PFE, ABT); Asian Cancer Research Group (LLY, PFE, MRK); ADNI (12 companies); BI & LLY (diabetes) Source: Tufts CSDD, 2011
31 A FIPNet Model for Drug Development: The Emergence of Innovation Nodes Research Pre-Discovery Discovery Preclinical Early Stage Development Late Stage Development Approval Phase IV Studies Large Pharma Coordination, Management Execution, Monitoring, Analysis Academia Biotechs/ Small Pharma Basic Research Translational Medicine Innovation, Partnerships Large Scale Clinical Trials Data Analysis Medical Writing Regulatory Approval CROs/Other Partners Execution, Monitoring, Analysis Source: Kaitin, Clin Pharmacol Ther, 2010;87:
32 BOTTOM LINE: The Innovation Landscape is shifting. In the new environment, all stakeholders will have a place at the table and will share in the risks and rewards of bioinnovation.

33 Conclusions
34 Conclusions The time, cost, and risk to bring a new medicine to market continue to represent formidable challenges for drug developers. These challenges have led to heightened focus on R&D efficiency and performance, and on new strategies, including R&D reorganization, partnerships, and network innovation.
35 Current Trends in Clinical Supplies Global clinical trial strategies introduce logistical complexity and increase clinical supplies costs (distribution, shipping, packaging, etc.) Biologics magnify the challenges (cold storage, specialty courier services, etc.) Industry s move to targeted medicines increases costs for clinical supplies tailored to stratified patient populations There is a growing move to FSP relationships with clinical supply providers Source: Tufts CSDD, 2011

36 You can be on the right track, and moving in the right direction, but if you re not moving fast enough, the train will still run you over. Will Rogers


37 Tufts Center for the Study of Drug Development Tufts University, Boston, Massachusetts, USA Kenneth I Kaitin, Ph.D. Director and Research Professor Tufts University School of Medicine Website kenneth.kaitin@tufts.edu