Document S1. Supplemental Experimental Procedures and Three Figures (see next page)
|
|
|
- Valerie Ray
- 5 years ago
- Views:
Transcription
1 Supplemental Data Document S1. Supplemental Experimental Procedures and Three Figures (see next page) Table S1. List of Candidate Genes Identified from the Screen. Candidate genes, corresponding dsrnas (listed as amplicons), and their scores in the sirna, endosirna, and mirna assays are shown. For any gene to be considered a candidate in a given assay, at least two independent dsrnas have to score. A 1 represents negative regulators of a given pathway, whereas a 1 represents positive regulators and 0 means did not score. Information in the columns labeled as Eukaryotic clusters and Eukaryotic orthologous groups were based on annotations in the COG database ( Each candidate gene was also assigned to a functional category based on the information from the COG database and the Flybase ( Detailed information on individual amplicons is listed at the DRSC website ( Table S2. Protein-Protein Interaction and Functional Interaction among Candidate Gene Products. These conclusions were based on annotations from the BioGRID database ( The following annotations were considered as indications of proteinprotein interactions: affinity capture-western; cofractionation; affinity capture-ms; reconstituted complex or two-hybrid. Phenotypic enhancement or phenotypic suppression were considered as an indication of genetic interaction. Table S3. Steady-State pri-mirna and mirna Levels upon Knockdown of Candidate Genes. Steady-state levels of CXCR4 and those of endogenous mir-2b upon knockdown of 43 selected candidate genes were examined by northern blotting and semiquantitative RT-PCR (q-pcr). For the northern blotting experiment, mirna levels were quantified and normalized first against U6 RNA levels and then against the average results from multiple control samples (cells treated with dsrna against LacZ). The results were subsequently log(2) transformed. As for the q-pcr assays, to measure steady-state levels of mature CXCR4, mir-2b, and pri-cxcr4, the ΔΔ Ct values ([CtU6 CtmiRNA]sample [CtU6 CtmiRNA]control) are shown. Results from northern blotting assays represent average values from two to four independent batches of RNA samples, whereas results from independent q-pcr experiments using the same batch of RNAs are shown. The reciprocals of the fold change of mir reporter values were log(2) transformed to generate the mir scores. One representative dsrna for each candidate gene was employed in the assay. Table S4. Steady-State esi-2.1 Levels upon Knockdown of Candidate Genes. Steady-state levels of esi-2.1 upon knockdown of 36 selected candidate genes were examined by semiquantitative RT-PCR (q-pcr). The ΔΔCt values ([CtU6 Ctesi-2.1]sample [CtU6 Ctesi- 2.1]control) are shown. The reciprocals of the fold change of endo-sirna reporter values were log(2) transformed to generate the esi-2.1 scores. One representative dsrna for each candidate gene was employed in the assay. Table S5. List of Candidate Genes that Were Also Identified in Published Genome-Wide RNAi Screens. Candidate genes and the corresponding references are listed.
2 Molecular Cell, Volume 32 Supplemental Data Comparative Analysis of Argonaute-Dependent Small RNA Pathways in Drosophila Rui Zhou, Ikuko Hotta, Ahmet M. Denli, Pengyu Hong, Norbert Perrimon, and Gregory J. Hannon Supplemental Experimental Procedures DNA constructs A 688-bp DNA fragment was PCR-amplified from a Renilla luciferase cdna and cloned into pwiz using compatible XbaI/AvrII sites to generate pwiz-renilla- Reverse. Subsequently, an XbaI/T4/EcoRI fragment from pwiz-renilla-reverse was cloned into prmha-3 using BamHI/T4/EcoRI sites to generate prmha-3- Renilla-Reverse. Finally, the same Renilla PCR product was cloned into prmha-3-renilla-reverse using compatible XbaI/NheI sites to generate prmha- 3-Renilla-hairpin. A SalI/BglII fragment from pgl3-basic (Promega) was cloned to prmha-3 using SalI/BamHI sites to generate prmha-3-firefly-long. A DNA fragment containing the coding region of the Renilla luciferase gene was amplified by PCR and cloned into prmha-3 using BamHI/EcoRI sites to generate prmha-3-renilla. A pair of oligos containing two perfect binding sites for esi-2.1 were annealed and cloned into prmha-3-renilla using BamHI/SalI sites to generate sensor constructs for esi-2.1. The pmt-d05 construct carries a DNA fragment derived from a modified short pri-bantam (pri-bancx) where the secondary structure remains the same as pri-bantam except that the stem sequence has been modified to generate CXCR4. The pri-bancx fragment was amplified by PCR from a template made by ligation of synthesized DNA fragments, and cloned into pmt (Invitrogen) using EcoRI and XhoI restriction sites. The pmt-f12 construct was generated using a similar strategy except that the CXCR4 region in the pri-bancx is perfectly basepaired. Template sequence for pmt-d05: CGCTCAGATGCAGATGTTGTTGATGTTATAAAGACCACGATCGAAAGAGGA AAAACGGAAAACGAACGAAAAGCGTTTGTAACTCCAATGATTTGACTACGAG ACGTTTTCACTCGTGCTAACTACTGTTTTTCATACAAGTTGTTAGCTGGAGTG AAAACTTCTTGTCAATGAATACCACATTCCACATTCCGATGGTCGATTTTTGT TGTTTGGTGTGCCTACACAGATATAGCGATATCGTGTAACAAAGCTTTGAAC TTATGCCGACCGATC
3 Template sequence for pmt-f12: CGCTCAGATGCAGATGTTGTTGATGTTATAAAGACCACGATCGAAAGAGGA AAAACGGAAAACGAACGAAAAGCGTTTGTAACTCCAATGATTTGACTACGAG AAGTTTTCACTCCAGCTAACAACTGTTTTTCATACAAGTTGTTAGCTGGAGTG AAAACTTCTTGTCAATGAATACCACATTCCACATTCCGATGGTCGATTTTTGT TGTTTGGTGTGCCTACACAGATATAGCGATATCGTGTAACAAAGCTTTGAAC TTATGCCGACCGATC Cloning Primers: Bantam-CXCR4 EcoRI fwd TTCACGTGAATTC CGCTCAGATGCAGATGTTGTTGATG Bantam-CXCR4 XhoI rev TTCACGTCTCGAG GATCGGTCGGCATAAGTTCAAAGCTTTG The Renilla luciferase reporter construct carrying CXCR4 target sites (pmt- Renilla-CXCR4-6B) was subcloned from the RL-CXCR-6-bulge reporter plasmid (Doench et al, 2004) into pmt using EcoRI and XhoI sites. RNAi screening The screens were performed in 384-well plates. To screen for components of the sirna pathway, 10 μl of RZ-14 cells (suspended in serum-free Schneider s medium at a density of 2X10 6 cells/ml) were dispensed to each well containing 5 μl dsrna (~ ng in total), incubated at room temperature for 45 minutes, then supplemented with 30 μl growth medium containing FBS. Three days after dsrna treatment, cells were induced with 25 μm CuSO 4 and luciferase assays were performed another two days later using Dual-Glo luciferase reagents (Promega). To screen for components of the mirna pathway, a transient transfection approach was employed. Approximately 100 ng plasmid DNA (a mixture of 5 ng pmt-renilla-cxcr4-6b, 93 ng pmt-d05 and 2 ng prmha-3-firefly-long) was mixed with 0.8 μl Enhancer in 15 μl EC (Qiagen) and incubated at room temperature for 5 minutes. Then 0.35 μl of Effectene reagent was added and the mixture was immediately dispensed into each well containing ~ ng of dsrnas. After incubation at room temperature for 10 minutes, 40 μl S2-NP cells (10 6 cells/ml) were added to each well. Cells were induced with 200 mm CuSO 4 3 days after transfection, and luciferase assays were performed 24 hours later. For each well, the ratio of Renilla luciferase to firefly luciferase, referred to as relative luciferase unit (RLU), was calculated. For each individual plate, the mean RLU (RLU mean ) was calculated, and each well received a score based on the ratio of RLU sample /RLU mean. For the sirna pathway primary screen, cutoff values of 1.5/0.6 were used to select candidates, whereas cutoff values of 1.6/0.6 were used for the mirna pathway primary screen. For the secondary screen, candidate dsrnas were re-synthesized using the MegaScript kit (Ambion) and arrayed in 384-well plates. Each assay plate also contains wells containing LacZ dsrnas as controls. The plates were
4 subsequently assayed in 3 to 4 independent experiments using the corresponding sirna/mirna assay systems. Each sample was assigned a score as fold change in RLU relative to the average of RLUs derived from the control samples (cells treated with dsrna against LacZ). The cutoff values for the secondary screens were 1.2/0.8 for the sirna pathway screen, and 1.4/0.75 for the mirna pathway screen, respectively. To minimize potential off-target effects associated with long dsrnas, for candidate dsrnas that scored in the secondary screen, one or more additional independent dsrnas were synthesized and tested in a similar setting. Only genes represented by two or more independent consistently scoring dsrnas were selected as final candidates. To screen for dsrnas that impacted the endogenous sirna pathway, a sensor construct for esi-2.1 was employed to screen the composite collection of candidate dsrnas emerging from the sirna and mirna primary screens. The experimental setting was the same as described in the mirna primary screen except that a mixture of 98 ng prmha-3-renilla-esi-2.1-sensor and 2 ng prmha- 3-Firefly-long was transfected into each well. The cutoff values for the endosirna pathway screen were 1.2/0.8. Bioinformatic analysis of the screening results To generate Figure 1C, the average fold change in reporter activity for multiple independent dsrnas targeting the same gene was calculated, and the reciprocals of the average fold change in reporter activity were log(2) transformed. The resulting values reflect the relative activities of each small RNA pathway in a given sample. The values were subjected to Hierarchical clustering (average linkage analysis) using the Cluster software. As for Figure 2A, the mirna pathway activity (determined by the procedure described above) associated with selected dsrnas targeting a given gene, the relative CXCR4 and mir-2b RNA levels (as an average from 2 to 4 independent Northern blotting experiments), and the relative levels of mature and pri-cxcr4 (from 3 independent q-pcr experiments) were subject to Hierarchical clustering. The resulting image was re-arranged to generate the final figure. Similar procedure was followed to generate Figure 2B.
5 References Doench, J. G., Petersen, C. P., and Sharp, P. A. (2003). sirnas can function as mirnas. Genes Dev 17,
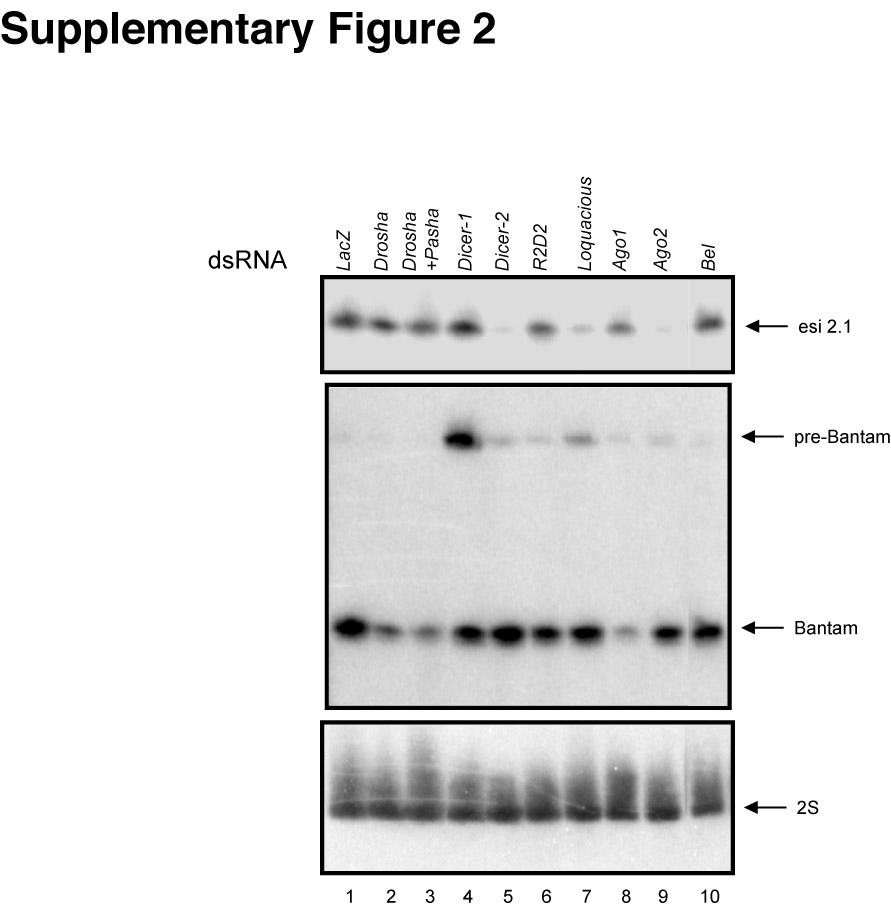
6 Supplemental Figure Legends: Figure S1. Assay Systems for Monitoring the sirna, mirna, and EndosiRNA Pathways in Cultured Drosophila Cells (A) Schematic representation of the RNAi pathway reporter system (RZ-14 cells) in which a perfectly complementary hairpin induces Renilla luciferase silencing. (B) Schematic representation of the mirna pathway reporter system. An artificial mirna (CXCR4) embedded in pri-bantam silences a Renilla luciferase transcript carrying multiple imperfect CXCR4-binding sites in the 3 UTR. (C) RZ- 14 cells were treated with indicated dsrnas by soaking, and gene expression was induced with CuSO 4 3 days after dsrna treatment. Luciferase activity was measured after another 48 hours. The ratio of Renilla luciferase/firefly luciferase (Relative luciferase unit, or RLU) was calculated and normalized against RLU from cells treated with dsrna against LacZ. Error bars represent standard deviation (n 4). (D) S2-NP cells were transfected with the CXCR4 mirna expression vector and reporter plasmids together with various dsrnas, and treated with CuSO 4 3 days after transfection to induce transgene expression. Luciferase assays were conducted after another 24 hours and analyzed and plotted as described in C. (E) Schematic representation of the endo-sirna pathway reporter system. An endogenous sirna (esi-2.1) silences a Renilla luciferase transcript carrying two perfect esi-2.1-binding sites in the 3 UTR. Figure S2. Knockdown of Bel Does Not Affect Steady-State Levels of esi- 2.1 S2-NP cells were treated with various dsrnas (as labeled on top of the panel). Total RNAs were extracted and subjected to Northern blotting analysis using probes against Bantam and esi S RNA serves as loading control. Figure S3. Knockdown of Bel Does Not Affect Levels of Ago2-Bound esi- 2.1 (A) S2-NP cells were first transfected with an expression construct for FLAGtagged Ago2, then treated with various dsrnas (as labeled on top of the panel). Cells were harvested and cell lysates were prepared. Approximately the same amount of total cell lysates were subjected to immunoprecipitation using anti- FLAG agarose beads. Total RNAs were subsequently extracted from the immunoprecipitates and subjected to Northern blotting analysis using a probe against esi-2.1. RNAs purified from an equivalent of ~25% of the cell lysates employed in the immunoprecipitation experiment were processed in parallel to serve as control for input material. (B) Approximately 1% of the input cell lysates and 5% of the immunoprecipitates were subjected to anti-flag immunoblotting to show the relative amount of the input material, and the membrane carrying cell lysates was re-probed with the Bel antibody to show effective knockdown.
7
8
9