Investor Presentation. November 2016
|
|
|
- Doris Harrison
- 5 years ago
- Views:
Transcription


1 Investor Presentation November 2016
2 Safe Harbor Statement The statements in this presentation that relate to guidance, pro forma presentations, future plans, goals, business opportunities, events or performance are forward-looking statements that involve risks and uncertainties, including risks associated with business and economic conditions, failure to achieve expected benefits of acquisitions, failure to comply with Food and Drug Administration regulations, customer and/or supplier contract cancellations, manufacturing risks, competitive factors, ability to successfully introduce new products, uncertainties pertaining to customer orders, demand for products and services, growth and development of markets for the Company's products and services, and other risks identified in our filings made with the Securities and Exchange Commission. Actual results, events and performance may differ materially. Readers are cautioned not to place undue reliance on these forward-looking statements, which speak only as of the date of this presentation. The Company disclaims any obligation to update these forward-looking statements as a result of developments occurring after the date of this presentation. Readers are encouraged to refer to the risk disclosures described in the Company s Form 10-K for the year ended December 31, 2015 and subsequent filings with the SEC, as applicable. Please see Safe Harbor and Forward-Looking Information in the Appendix to this presentation for more information. In this presentation, we present the non-gaap financial measures of Adjusted Revenue, Adjusted EPS, Adjusted EBITDA, free cash flow and net debt. Please see Use of Non-GAAP Financial Measures in the accompany appendix and our third quarter 2016 earnings press release for the reasons we use these measures, a reconciliation of these measures to the most directly comparable GAAP measures and other information relating to these measures. The Company neither updates nor confirms any guidance regarding the future operating results of the Company which may have been given prior to this presentation. 2 Factors Affecting Future Performance & Non-GAAP Financials


 *2016 Outlook reflects guidance provided on")

3 Company Overview Novanta is a trusted Technology Partner to Medical and Advanced Technology Equipment Manufacturers Headquartered in Boston, MA. Office locations in 7 countries +$384M in revenue, +$66M in Adjusted EBITDA, +$1.00 non-gaap EPS* Global positions in a ~$2 billion addressable market, with 5%-7% CAGR Approximately 1,400 employees Trade on NASDAQ (ticker: NOVT) *2016 Outlook reflects guidance provided on November 2, The Company neither updates nor confirms this forward looking guidance. **Adjusted EBITDA & Adjusted E.P.S. are non-gaap measures. The reconciliation to our most comparable GAAP measures is provided in the accompanying appendix. 3

4 Why Invest in Novanta Exposure to Secular Growth Markets ~45% of revenue in steadily growing Medical markets ~55% in automation, robotics, metrology, fine material processing Profitable niche leadership positions Market Expansion New product innovation into adjacent markets Increased content with existing customers Expand commercially through global reach Diversified Business Model Recurring revenue streams through sticky solutions and long OEM product cycles, in diversified niche markets Strong Cash Flow conversion through continuous improvement business system Strategic M&A Disciplined M&A Creating value by deploying continuous improvement and sales channel synergies 4 Multiple growth drivers in attractive medical focused end markets
5 Where and How We Play Core Technologies Target Markets Precision Motion Vision Photonics (including Laser) Medical Advanced Industrial Value Chain Focus Components Sub-Systems Hardware components and subsystems Software & Controls Increasing offerings with software, connectivity & controls Systems Business Model Application & Customer Specific Highly Engineered and semi- Customized Solutions to Original Equipment Manufacturers ( OEMs ) Long Design In Cycles and 5 to 10 year customer product life cycles Lean based Operations Excellence / Continuous improvement program drives margin expansion and product quality 5 Focus on intelligent mission critical solutions for OEMs

6 2020 Strategic Direction Leader in Intelligent Mission Critical & Enabling Technologies Breakthrough Scale Double in size and market cap Consistent Growth 5-7% organic growth, 50% of revenue in medical markets Global Market Leadership Top 2 share position globally Superior Profitability Deliver 20% Adj. EBITDA, with diversified businesses Reputation for Excellence Widely recognized as a world class operating company 6 Doubling our company with leading positions in attractive growing markets


7 Revenue Breakdown Product Groups End Markets Precision Motion Photonics Medical Vision Advanced Industrial 7 Diversified technologies and markets with significant medical exposure

8 Strong Global Presence % of Sales 41% Americas 32% EMEA 27% Asia Poole, UK Seattle, WA Silicon Valley, CA Syracuse, NY Boston, MA Munich, Germany Beijing, China Suzhou, China Tokyo, Japan Shenzhen, China Major Sales & Service Site Major R&D Site Major Manufacturing Site 8 Over 1,400 employees, with 60% of revenue outside Americas


9 Expanding Medical Portfolio Market Size: $1B (CAGR: 5 7%) Segments Ophthalmology Critical Care Lab Equipment Surgical Treatment Key Applications Novanta Solutions OCT Cataract Surgery LASIK Surgery Laser Scanning Visualization Precision Motion Patient Monitoring EKG Defibrillation Auto ID / RFID Precision Motion Machine Vision IVD Life Sciences Analytical Machine Vision Precision Motion Laser Scanning Endoscopy Robotic Surgery Surgical Tools Visualization Precision Motion Machine Vision Our Position #1 #1 #1 or 2 #1 or 2 Growth Drivers Aging population Laser technology penetration New product expansion Market growth Technology penetration of precision motion and machine vision Growth in IVD and DNA sequencing tests Procedure growth Robotic surgery Connected OR 9 We have leading positions in the segments we serve

10 Technology for the Operating Room 10 Driving Novanta content growth in a variety of equipment in the OR
11 Minimally Invasive Surgical Market Attractive Market Conversion from Open to Minimally Invasive Surgery - Safer: Increased safety with smaller incisions - Cheaper: Decreased length of hospital stay ($2k/day) - Better: Less trauma to the body, less blood loss - Faster: Faster patient recovery times Growth in Endoscopic Equipment is driven by - Minimally Invasive Surgery benefits - Increase in disease categories that require endoscopy - Technological advancements 11 A mid-single digit growth market over the long-run

12 Clinical Lab Equipment 12 Driving content in the box through enabling technologies to OEMs
13 The Next Generation Sequencing (NGS) Market $28B $102B 46 $56B Other Biomedical Research Reproductive & Genetic Health Cancer - theragnostics Cancer - Liquid Biopsy CAGR % 20% 17% 22% Key NGS Market Adoption Drivers Key sequencing growth applications - Population sequencing (biomedical research) - Cancer Theranostics sequencing guiding targeted therapy - Cancer monitoring, prognosis and screening ( Liquid biopsy - upside) Improved solutions - Decreasing test costs - Improvements in informatics and interpretation of test data Clinical acceptance and adoption - Increasing body of evidence of validity and clinical relevance of liquid biopsy - Appropriate reimbursement rates for Next Generation Sequencing based tests Source: JP Morgan, May Is poised to show double digit growth, with liquid biopsy as large upside

14 Adjusted Revenue ~15% CAGR Mid-Single Digit Organic Growth * Adjusted Revenue is a non-gaap measure. The reconciliation to our most comparable GAAP measures is provided in the accompanying appendix. ** 2016 Outlook reflects guidance provided on November 2, The Company neither updates nor confirms this forward looking guidance. 14 Driving revenue growth through mid-single digit organic and acquisitions

15 Profitability Adjusted EBITDA Adjusted E.P.S. ~12% Mid-to-High Single Digit +22% CAGR CAGR 8% to 10% *Adjusted EBITDA & Adjusted E.P.S. are non-gaap measures. The reconciliation to our most comparable GAAP measures is provided in the accompanying appendix. ** 2016 Outlook reflects guidance provided on November 2, The Company neither updates nor confirms this forward looking guidance. 15 Driving predictable and sustainable income growth
16 About Novanta Novanta is a leading global supplier of core technology solutions that give advanced technology and healthcare OEMs a competitive advantage. We combine deep expertise at the intersection of photonics and motion with a proven ability to solve complex technical challenges. This enables Novanta to engineer core components and sub-systems that deliver extreme precision and performance, tailored to our customers demanding applications. We deliver highly engineered laser, vision and precision motion solutions to customers around the world. The driving force behind our growth is the team of innovative professionals who share a commitment to innovation and customer success. Novanta s common shares are quoted on NASDAQ under the ticker symbol NOVT. 16 Bringing The Innovation Advantage to everything we do


17 17 APPENDIX
18 Use of Non-GAAP The non-gaap financial measures used in this presentation are non-gaap Adjusted Revenue, Adjusted EBITDA, and Adjusted EPS from continuing operations. The Company believes that the non-gaap financial measures provide useful and supplementary information to investors regarding the Company s operating performance. It is management s belief that these non-gaap financial measures would be particularly useful to investors because of the significant changes that have occurred outside of the Company s day-to-day business in accordance with the execution of the Company s strategy. This strategy includes streamlining the Company s existing operations through site and functional consolidations, strategic divestitures and product line closures, expanding the Company s business through significant internal investments, and broadening the Company s product and service offerings through acquisition of innovative and complementary technologies and solutions. The financial impact of certain elements of these activities, particularly acquisitions, divestitures, and site and functional restructurings, is often large relative to the Company s overall financial performance, which can adversely affect the comparability of its operating results and investors ability to analyze the business from period to period. Adjusted Revenue excludes the JK Lasers business to only show the results of ongoing operations of the Company as the JK Lasers business was sold in April We excluded JK Lasers sales from Adjusted Revenue because divestiture activities can vary between reporting periods and between us and our peers, which we believe make comparisons of long-term performance trends difficult for management and investors, and could result in overstating or understating to our investors the performance of our operations. Additionally, we include estimated revenue from contracts acquired with business acquisitions that will not be fully recognized due to business combination rules. Because GAAP accounting rules require the elimination of this revenue, GAAP results alone do not fully capture all of our economic activities. These non-gaap adjustments are intended to reflect the full amount of such revenue. The Company defines Adjusted EBITDA as Operating Income (loss) from Continuing Operations before deducting depreciation, amortization, non-cash share-based compensation, restructuring, acquisition, divestiture and other costs, impairment of goodwill and intangible assets, acquisition fair value adjustments, and inventory related charges associated with product line closures. The Company s Adjusted EBITDA is used by management to evaluate operating performance internally, communicate financial results to the Board of Directors, benchmark results against historical performance and the performance of peers, and evaluate investment opportunities including acquisitions and divestitures. In addition, Adjusted EBITDA is used to determine bonus payments for senior management and employees. Accordingly, the Company believes that this non-gaap measure provides greater transparency and insight into management s method of analysis. Adjusted EPS from Continuing Operations excludes amortization of acquired intangible assets and revenue fair value adjustments related to business acquisitions, restructuring, acquisition, divestiture, and other costs, inventory related charges associated with product line closures, the gain on sale of JK Lasers and the related unrealized foreign exchange loss on the U.S. dollar sales proceeds held by our U.K. subsidiary, impairment of goodwill and intangible assets, significant nonrecurring income tax expenses (benefits) related to releases of valuation allowance, effects of changes in tax laws, income tax audit settlements, effects of acquisition related tax planning actions on our effective tax rate, and the income tax effect of non-gaap adjustments. Non-GAAP financial measures should not be considered as substitutes for, or superior to, measures of financial performance prepared in accordance with GAAP. They are limited in value because they exclude charges that have a material effect on the Company s reported results and, therefore, should not be relied upon as the sole financial measures to evaluate the Company s financial results. The non-gaap financial measures are meant to supplement, and to be viewed in conjunction with, GAAP financial measures. Investors are encouraged to review the reconciliation of these non-gaap financial measures to their most directly comparable GAAP financial measures as provided in the tables accompanying this document. 18
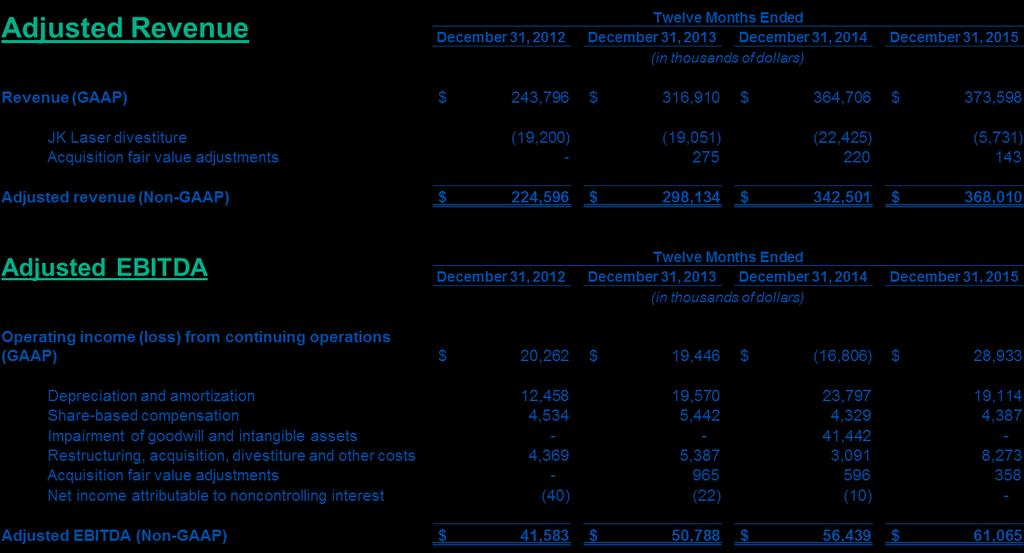
19 Non-GAAP Reconciliation 19

20 Non-GAAP Reconciliation *Adjusted EPS was not updated for the Scientific Lasers divestiture. Management determined that revising the Adjusted EPS figures would not have resulted in a material change. 20 Novanta s Transformation is Gaining Momentum