The following is intended to outline our general product direction. It is intended for information purposes only, and may not be incorporated into
|
|
|
- Myles Stone
- 5 years ago
- Views:
Transcription
1
2 The following is intended to outline our general product direction. It is intended for information purposes only, and may not be incorporated into any contract. It is not a commitment to deliver any material, code, or functionality, and should not be relied upon in making purchasing decisions. The development, release, and timing of any features or functionality described for Oracle s products remains at the sole discretion of Oracle.
 Abhinav Agarwal Consulting Product Manager (abhinav.agarwal@oracle.")
3 Interactive Visualizations in Oracle Business Intelligence Suite, Enterprise Edition Plus (S309087) Abhinav Agarwal Consulting Product Manager

4 Program Agenda Introduction Information Insight End-User Perspective The Author s Perspective Advanced Topics <Insert Picture Here>


5 Oracle Business Intelligence Complete, Open, Integrated Data Integration Ad-hoc Analysis Interactive Dashboards Essbase Reporting & Publishing Proactive Detection and Alerts Disconnected & Mobile Analytics MS Office & Outlook Integration Common Enterprise Information Model BI Server Integrated Security, User Management, Personalization Multidimensional Calculation and Integration Engine Intelligent Request Generation and Optimized Data Access Services OLTP & ODS Data Warehouse, Datamart OLAP SAP, Oracle, Siebel, Excel Business Systems Database Machine, Exadata Essbase PeopleSoft, Custom XML Process


6 Information Any Interaction Style Interactive Analysis Drill anywhere visualization Published Reporting Page-Oriented, High Volume, Pixel-Perfect Smart Office Access Secure Integration with Microsoft Office Dashboards and Scorecards Role-based and Personalized


7 Information Pervasive BI Across Your Enterprise Proactive Alerts, Mobile Access Push BI to and mobile devices Guided Analytics Enable greater analysis success FPO Embedded in OLTP Applications In-Context Insight BI Drives Business Processes Intelligence-driven business processes BPEL, ESB Oracle BI
8 Information Visualization Effective Interactive Bite-sized
9 Information Visualization Effective Interactive Bite-sized Tables Pivots Charts Maps Narrative Ticker Scorecards Gauge Funnel Tag clouds Treemaps Dashboards Sparklines Trellis views Hierarchical views
10 Choosing The Right Visualization

11 Good Charles Minard's 1869 chart showing the losses in men, their movements, and the temperature of Napoleon's 1812 Russian campaign.
12 and Bad
13 and Bad
14 Charts Can Lie Chart Revisited What The Data Told

15 Charts Can Lie Chart Revisited What The Data Told What The Chart Suggested

16 Example 1 Tables Can Be Effective

17 Example 1 Tables Can Be Effective

18 Example 1 Charts Can Be Effective

19 Example 1 The Correct Chart Can Be Effective
20 Example 1 The Correct Chart Can Be Effective
21 Example 1 The Correct Chart Can Be Effective
22 Example 2 Improving The Table
23 Example 2 Improving The Table
24 Example 2 Improving The Table


25 Example 2 Improving The Table But
26 Example 2 Improving The Chart
27 Example 2 Improving The Chart
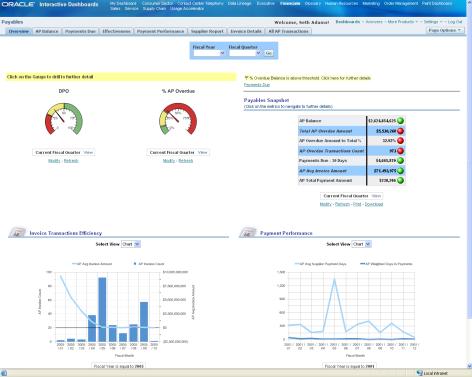
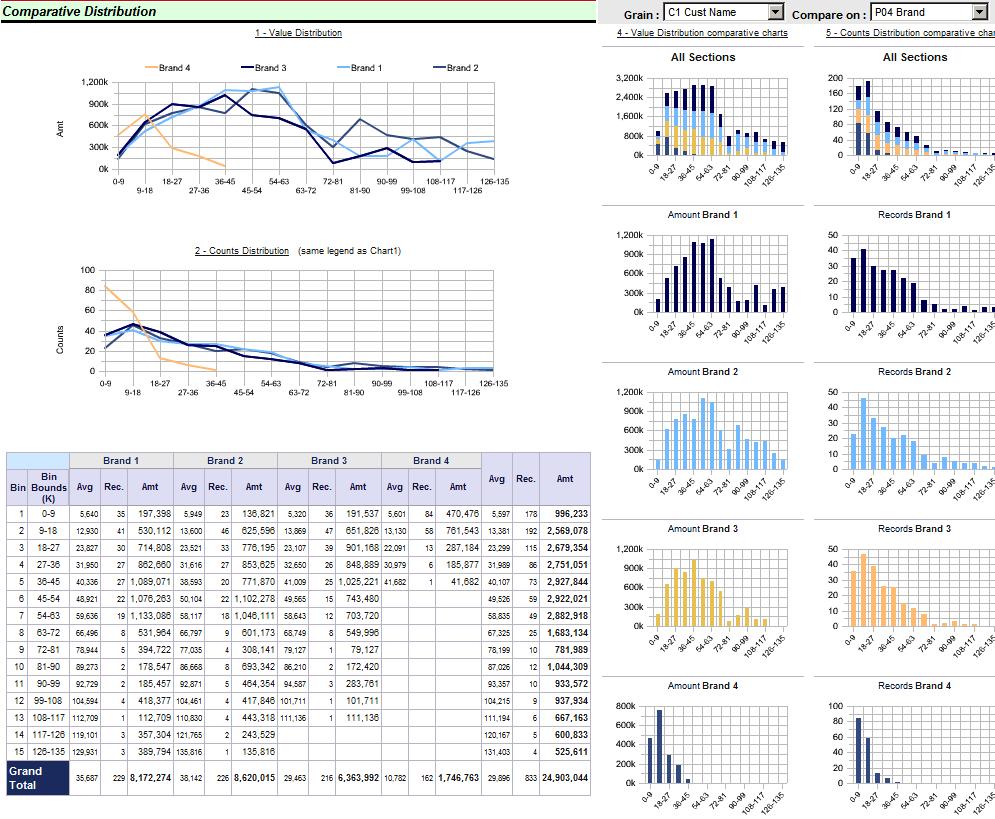
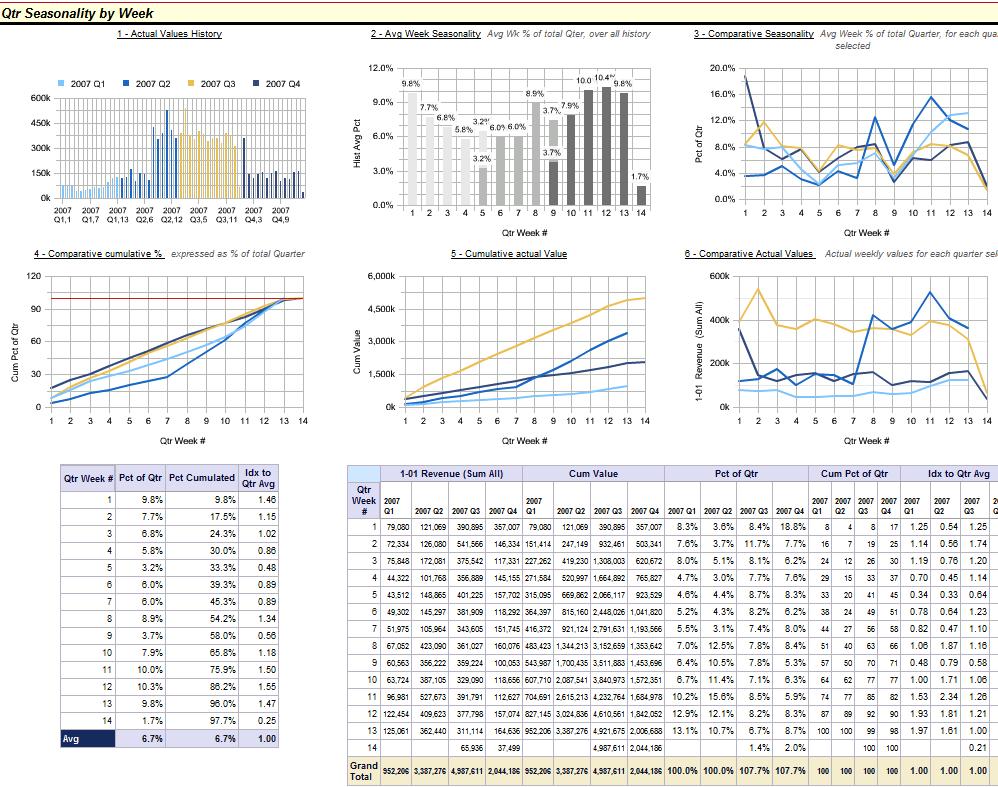
28 Interactivity in Action
29 The following is intended to outline our general product direction. It is intended for information purposes only, and may not be incorporated into any contract. It is not a commitment to deliver any material, code, or functionality, and should not be relied upon in making purchasing decisions. The development, release, and timing of any features or functionality described for Oracle s products remains at the sole discretion of Oracle.
30 I
31 I
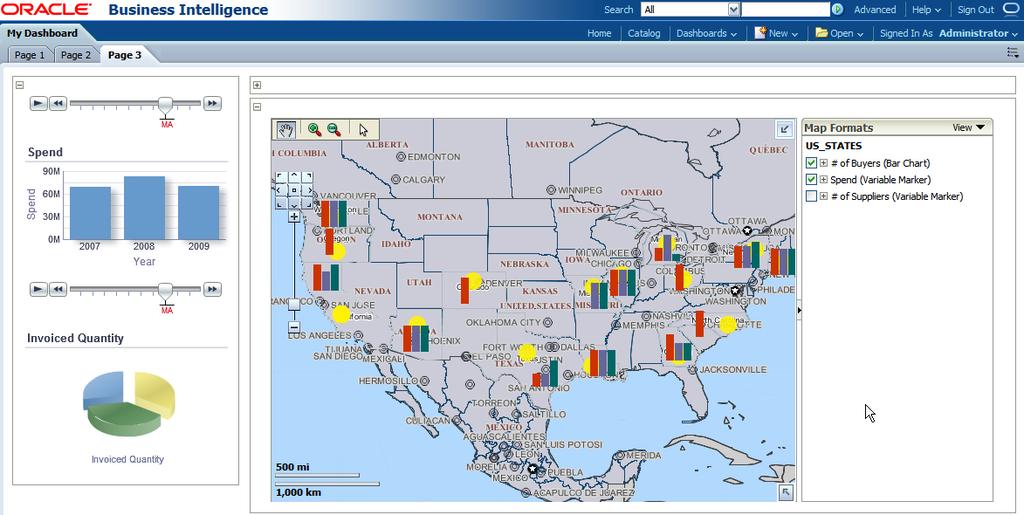
32 I Year Plant Location Country, State Spending Type Spend Suppliers Buyers Invoiced Quantity


33 I Year Plant Location Country, State Spending Type Spend Suppliers Spend, Country Buyers Invoiced Quantity Year Suppliers Buyers Spending Type Invoiced Quantity
34
35
36

37
38
39
40
41
42

43 Designing Interactivity
44 Recap Charts Interactivity Sliders Prompts Zoom-and-scroll Legends Master-Detail linking Maps Thematic overlays Dot-density plots Variable sized markers Bubbles Custom markers Pie Charts Bar Charts Master-Detail linking
45 The preceding is intended to outline our general product direction. It is intended for information purposes only, and may not be incorporated into any contract. It is not a commitment to deliver any material, code, or functionality, and should not be relied upon in making purchasing decisions. The development, release, and timing of any features or functionality described for Oracle s products remains at the sole discretion of Oracle.
46 For More Information search.oracle.com business intelligence or oracle.com/bi
47
48