FLORIDA RURAL WATER ASSOCIATION ASSET MANAGEMENT PROGRAM
|
|
|
- Denis Lawson
- 5 years ago
- Views:
Transcription


1 FLORIDA RURAL WATER ASSOCIATION ASSET MANAGEMENT PROGRAM
2
3

4
5
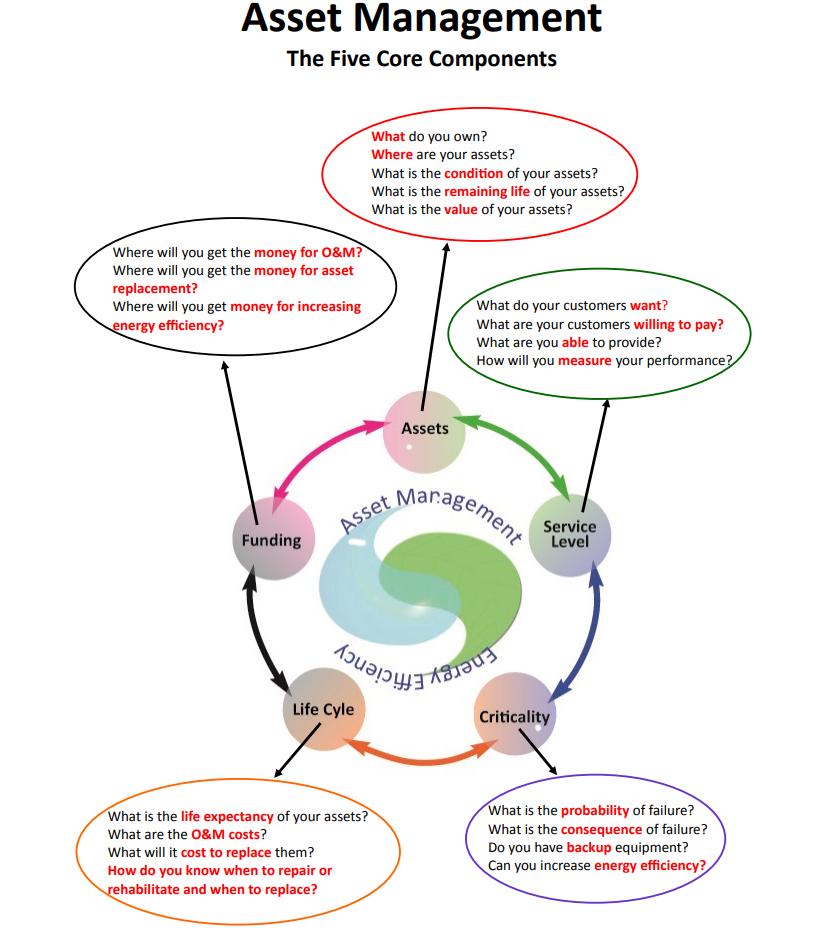
6 BENEFITS OF ASSET MANAGEMENT Examples of outcomes that can be realized by utilities through asset management: Prolonging asset life and improving decisions about asset rehabilitation, repair, and replacement Meeting consumer demands with a focus on system sustainability Setting rates based on sound operational and financial planning Budgeting focused on critical activities for sustained performance Meeting service expectations and regulatory requirements Improving responses to emergencies Improving the security and safety of assets Reducing overall costs for both operations and capital expenditures Reduced Loan Interest Rates saving customers money. All evaluation / report efforts are paid for by the Drinking Water and Clean Water State Revolving Fund (DWSRF & CWSRF) Programs
7 CHALLENGES FACED BY UTILITY MANAGERS Determining the best (or optimal) time to rehabilitate/repair/replace aging assets. Increasing demand for services Overcoming resistance to rate increases Diminishing resources Rising service expectations of customers Increasingly stringent regulatory requirements Responding to emergencies because of asset failures Protecting assets
8 Key Role for Local Officials: Building Community Support Successful implementation of an asset management program means overcoming potential barriers by including the community in the process. Local officials are key players in obtaining community support towards a successful asset management program. Barriers to implementing an asset management program may include: Expecting to see immediate results Changing from a focus on operations to a focus on assets Paying for short-term costs to achieve long-term savings Reconciling a short-term focus (ie., rate adjustments) with longterm view of system sustainability
9 Community Support In order for your system to gain community support, your customers should: Understand what you do Believe that your work has value See that the way you work meets level of service expectations Asset management helps you: Share information with your customers Describe the risks of not maintaining system components Communicate your system s condition and needs Justify rehabilitation, repair, and replacement project priorities Justify your long-term financial plan to the public


10 How do we get there?


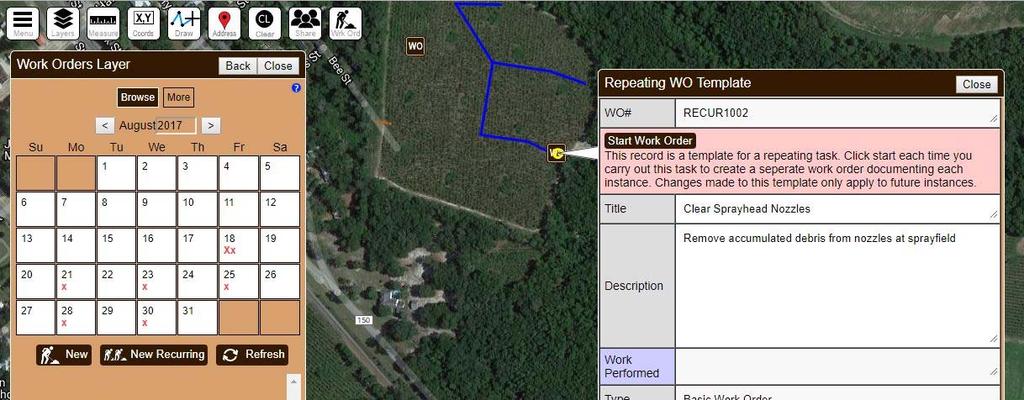
11 Diamond Maps


12


13 25% 40% 10% 25%


14
 City of \"XXXX\" Proposed Improvements & Associated Rate Sufficiency Recommended Action (in excess of current O&M, R&R) Years Until Action Needed Five Year Cost")

15 Item No. Major Asset (highest to lowest priority) City of "XXXX" Proposed Improvements & Associated Rate Sufficiency Recommended Action (in excess of current O&M, R&R) Years Until Action Needed Five Year Cost ($) Projected CAPES & OPEX Expenses by Year CAPEX Transmission Piping Upgrade 10,000 LF of 8" PVC 4 $500,000 $500,000 2 Distribution Piping Upgrade 2" to 4" PVC 3 $80,000 $80,000 3 Service Laterals Replace all Galvanized Pipe 1 $30,000 $15,000 $15,000 4 Pump House New Roof 2 $10,000 $10,000 5 SCADA Update software 5 $2,000 OPEX 1 Treatment Plant Flowline LC30 flow controller failed. 1 $500 $500 2 Chlorine injection point quill is beginning to rust. (5 7 yr. life) 3 $500 $500 3 Water Meters (plant) McCrometer UM 0604 flow meter inaccurate. 1 $2,500 $1,000 $1,500 4 Service Laterals (207 laterals) Review the need to replace services 1 $3,400 $680 $680 $680 $680 $680 5 Electrical Service and Controls Annual test and inspection 2 $1,000 $200 $200 $200 $200 $200 6 Wells & Pumps No.2 vertical turbine well & pump requires maintenance 2 $2,000 $500 $500 $500 $500 7 Transmission/Dist. Piping 7 flush stands noted (flush annually) 1 $1,000 $200 $200 $200 $200 $200 8 Fire Hydrants(30 total FH) Test/Flow 30 FH & Valve/yr. Repair 1 Failed FH. Paint 7 FH 1 $2,500 $500 $500 $500 $500 $500 9 Storage Tanks Aquastore GST recently refurbished (clean annually) 1 $5,000 $1,000 $1,000 $1,000 $1,000 $1, Isolation Valves (24 listed) Annual cycle needed; replace missing lids 1 $1,500 $300 $300 $300 $300 $300 FINANCIALS 1.50% Estimated SRF Interest Rate Total/Year CAPEX $15,000 $25,000 $80,000 $500,000 $0 20 Year Loan Planning CAPEX Debt Service $4,660 $29,123 $0 CAPEX TOTAL $4,660 $33,783 $33,783 OPEX TOTAL $4,380 $4,880 $3,880 $3,380 $3,380 TOTAL $19,380 $29,880 $13,200 $37,163 $37, % Percent increase/year (US Census ) Customers ,545 4,590 4,636 4,683 4,730 Monthly Rate Sufficiency/Customer $0.36 $0.19 $0.24 $0.43 $0.00 Cumulative Monthly Rate Sufficiency/Customer $0.36 $0.55 $0.78 $1.21 $1.21 (*) Water Rate Sufficiency/Year (based on 5,000 gal avg) $33.50 $33.86 $34.05 $34.28 $34.71 $34.71 Percent Rate Sufficiency Needed/Year 0.0% 1.1% 0.6% 0.7% 1.2% 0.0% NOTE: The CAPEX and OPEX Cost and associated rate sufficiency shown above are in excess of current utility activity. For SRF Loans, the minimum construction loan amount is $75,000. Grouping programs is desirable to reduce overall cost associated with funding applications. Automatic re occurring Annual Rate Increase of 1.5%, based on the current CPI is recommended to manage inflation of good and services associated with delivery of water service. (*) RESIDENTIAL 2018 Base $28.80 rate, consumption charge: 0 3,000 gallons $2.35 per thousand


16


17

18 XYZ Utility XYZ Utility


19 XYZ Utility XYZ Utility


20 XYZ Utility XYZ Utility


21 XYZ Utility XYZ Utility


22 XYZ Utility


23 Have AMFS action items been addressed? Have known deficiencies been addressed? If yes, note these as completed. If no, consider setting interim timeframes for critical elements and accomplishing high priority actions. Are any AMFS elements prepared as a stand-alone document? If yes, has any information changed that needs updating? Update: Annual Review and Update AM Team LOS Goals Asset Conditions and other statuses Critical Assets Priority Capital Improvement Plan Financial Projections.
 Implemented to reach those goals")
 Asset Management is a TEAM EFFORT In order to slay the dragon it is imperative to have buy-in from management as well as operations,")
24 Asset Management and Fiscal Sustainability An Asset Management Plan is intended to be a living, breathing document. As such, it must be: Developed with clear Level of Service goals in mind Specific Measurable Attainable Reachable Trackable (SMART) Implemented to reach those goals Maintained regularly using software such as Diamond Maps or CUPSS Updated annually at a minimum to reflect current status and goals Set new, higher goals next priority project, rate sufficiency, (SMART) Asset Management is a TEAM EFFORT In order to slay the dragon it is imperative to have buy-in from management as well as operations, maintenance, finance, engineering and all support roles.

25 Implementation Generators ( kw) GIS Software and Mapping Equipment Ground Penetrating Radar Units Hydrant Flowmeters Hydrant Pressure and Flow Kits Lab Equipment Leak Correlators Leak Detectors Magnetic Locator Meter Testing Equipment Pressure Recorders Test Kits/Water Quality Valve Exercisers VFDs Voltage Converter 3" Trash Pump 6" By-pass Pump Amp Meters Centrifuges Colorimeters D O Meters Flow Meters Line Tracers Magnetic Locators Microscopes ORP Meters Push Cameras Rotation Meters Sewer Line Video Smoke Blower Drinking Water and Wastewater Circuit Riders and Trainers, Groundwater/Sourcewater Specialists, Engineers, Financial/Management Circuit Riders, Energy Efficiency Specialist, Asset Management Team
 546-3566 Paul Thompson Paul.Thompson@frwa.")
 279-4989 Patrick Dangelo Patrick.Dangelo@frwa.")
26 David Haring (386) Paul Thompson (386) Laureen Busacca (352) Patrick Dangelo (386) Chris Bailey (678)