Observational Health Data Sciences and Informatics (OHDSI) Data integration & data sharing in the era of Big Data Berlin 2016 July 12-13
|
|
|
- Mark Norris
- 5 years ago
- Views:
Transcription
")

1 Observational Health Data Sciences and Informatics (OHDSI) Data integration & data sharing in the era of Big Data Berlin 2016 July 12-13
2 OHDSI (pronounced Odyssey ) The Observational Health Data Sciences and Informatics (OHDSI) program is a multistakeholder, interdisciplinary collaborative to create open-source solutions that bring out the value of observational health data through large-scale analytics OHDSI has established an international network of researchers and observational health databases with a central coordinating center housed at Columbia University
3 OHDSI s vision OHDSI collaborators access a network of 1,000,000,000 patients to generate evidence about all aspects of healthcare. Patients and clinicians and other decision-makers around the world use OHDSI tools and evidence every day.

4 OHDSI s global research community >140 collaborators from 20 different countries Experts in informatics, statistics, epidemiology, clinical sciences Active participation from academia, government, industry, providers Currently 600 million patient records in 52 databases

5 Why large-scale analysis is needed in healthcare All health outcomes of interest All drugs
6 Patient-level predictions for personalized evidence requires big data 2 million patients seem excessive or unnecessary? Imagine a provider wants to compare her patient with other patients with the same gender (50%), in the same 10-year age group (10%), and with the same comorbidity of Type 2 diabetes (5%) Imagine the patient is concerned about the risk of ketoacidosis (0.5%) associated with two alternative treatments they are considering With 2 million patients, you d only expect to observe 25 similar patients with the event, and would only be powered to observe a relative risk > 2.0 Aggregated data across a health system of 1,000 providers may contain 2,000,000 patients
7 Evidence OHDSI seeks to generate from observational data Clinical characterization: Natural history: Who are the patients who have diabetes? Among those patients, who takes metformin? Quality improvement: what proportion of patients with diabetes experience disease-related complications? Population-level estimation Safety surveillance: Does metformin cause lactic acidosis? Comparative effectiveness: Does metformin cause lactic acidosis more than glyburide? Patient-level prediction Precision medicine: Given everything you know about me and my medical history, if I start taking metformin, what is the chance that I am going to have lactic acidosis in the next year? Disease interception: Given everything you know about me, what is the chance I will develop diabetes?


8 What is the quality of the current evidence from observational analyses? August2010: Among patients in the UK General Practice Research Database, the use of oral bisphosphonates was not significantly associated with incident esophageal or gastric cancer Sept2010: In this large nested casecontrol study within a UK cohort [General Practice Research Database], we found a significantly increased risk of oesophageal cancer in people with previous prescriptions for oral bisphosphonates 8
9 OHDSI s approach to open science Open science Data + Analytics + Domain expertise Generate evidence Open source software Enable users to do something Open science is about sharing the journey to evidence generation Open-source software can be part of the journey, but it s not a final destination Open processes can enhance the journey through improved reproducibility of research and expanded adoption of scientific best practices
10 Standardizing workflows to enable reproducible research Open science Population-level estimation for comparative effectiveness research: Is <intervention X> better than <intervention Y> in reducing the risk of <condition Z>? Generate evidence Database summary Cohort definition Cohort summary Compare cohorts Exposureoutcome summary Effect estimation & calibration Compare databases Defined inputs: Target exposure Comparator group Outcome Time-at-risk Model specification Consistent outputs: analysis specifications for transparency and reproducibility (protocol + source code) only aggregate summary statistics (no patient-level data) model diagnostics to evaluate accuracy results as evidence to be disseminated static for reporting (e.g. via publication) interactive for exploration (e.g. via app)
11 Protocol Opportunities for standardization in the evidence generation process Data structure : tables, fields, data types Data content : vocabulary to codify clinical domains Data semantics : conventions about meaning Cohort definition : algorithms for identifying the set of patients who meet a collection of criteria for a given interval of time Covariate construction : logic to define variables available for use in statistical analysis Analysis : collection of decisions and procedures required to produce aggregate summary statistics from patient-level data Results reporting : series of aggregate summary statistics presented in tabular and graphical form
12 OHDSI Distinguishing Features International effort (size & coverage) 43 sources terminologies from around the world Open science (depth) Infrastructure serves the science Stack: Terminology, CDM, ETL, QA, Visualization, Novel analytic methods, Clinical research Full information model


13 Strength Consistency Temporality Biological gradient Plausibility Comparative effectiveness Experiment Coherence Predictive modeling Analogy Specificity How OHDSI Works OHDSI Coordinating Center Source data warehouse, with identifiable patient-level data ETL Standardized, deidentified patientlevel database (OMOP CDM v5) Data network support Analytics development and testing Research and education OHDSI Data Partners Standardized large-scale analytics Analysis results Summary statistics results repository OHDSI.org
14 Objectives in OMOP Common Data Model development One model to accommodate both administrative claims and electronic health records Claims from private and public payers, and captured at point-of-care EHRs from both inpatient and outpatient settings Also used to support registries and longitudinal surveys One model to support collaborative research across data sources from around the world One model that can be manageable for data owners and useful for data users (efficient to put data IN and get data OUT) Enable standardization of structure, content, and analytics focused on specific use cases


15 OMOP CDMv2 Evolution of the OMOP Common data model OMOP CDM now Version 5, following multiple iterations of implementation, testing, modifications, and expansion based on the experiences of the OMOP community who bring on a growing landscape of research use cases. OMOP CDMv4 OMOP CDMv5 Page 15
16 OMOP CDM V5
17 Standardized Vocabularies: Conditions Querying Classifications SMQ SMQ SMQ MedDRA MedDRA MedDRA System organ class (Level 5) High-level group terms (Level 4) High-level terms (Level 3) Cohort SMQ MedDRA Preferred terms (Level 2) Top-level classification SNOMED-CT MedDRA Low-level terms (Level 1) Higher-level classifications (Level 2 and up) SNOMED-CT Standard vocabulary Low-level concepts (Level 1) SNOMED-CT Source codes Source codes ICD-10-CM Read Oxmis ICD-9-CM SNOMED Mapping Existing De Novo Derived Coding

18 Distribution of Domains in Vocabularies
19 Preparing your data for analysis Patient-level data in source system/ schema ETL design ETL implement Patient-level data in OMOP CDM ETL test OHDSI tools built to help WhiteRabbit: profile your source data RabbitInAHat: map your source structure to CDM tables and fields ATHENA: standardized vocabularies for all CDM domains Usagi: map your source codes to CDM CDM: DDL, index, constraints for Oracle, SQL Server, PostgresQL; Vocabulary tables with loading scripts ACHILLES: profile your CDM data; review data quality assessment; explore populationlevel summaries vocabulary OHDSI Forums: Public discussions for OMOP CDM Implementers/developers
20 Patient-level data in OMOP CDM Standardized large-scale analytics tools under development within OHDSI ACHILLES: Database profiling CIRCE: Cohort definition HERMES: Vocabulary exploration HERACLES: Cohort characterization CALYPSO: Feasibility assessment OHDSI Methods Library: CYCLOPS CohortMethod SelfControlledCaseSeries SelfControlledCohort TemporalPatternDiscovery Empirical Calibration LAERTES: Drug-AE evidence base PLATO: Patient-level predictive modeling HOMER: Population-level causality assessment
21 Getting Your Data into the OMOP CDM Everyone s data starts messy! To get into a standardized model, you need Someone familiar with the source dataset Someone familiar with healthcare Someone who can write SQL Fortunately, OHDSI has great tools (and people!) to help you out
22 Example The U.S. Centers for Medicare and Medicaid Services (CMS) releases a variety of public data sets For this example, we will use SynPUF, a synthetic claims dataset based on real patient data We will cover the steps of mapping this over to OMOP CDM V5

23 OMOP CDM V5

24 Where to find the CDM?
25 Synthetic Sample Data Set Synthetic Public Use Files Beneficiary Summary Carrier claims Inpatient claims Outpatient claims Prescription drug events CSV format
26 Step 1: What is in your dataset? WhiteRabbit WhiteRabbit, a tool that lets you Scans your dataset Extracts summary information on the contents Produces a file that can be consumed for ETL planning

27 Step 2: Map Your Dataset to CDM Rabbit In a Hat Rabbit-In-a-Hat is a tool that uses the WhiteRabbit output and lets you match up your dataset with the CDM model
28 OHDSI Has Extensive Vocabulary Maps Athena 1 SNOMED Systematic Nomenclature of Medicine - Clinical Terms (IHDSTO) International Classification of Diseases, Ninth Revision, Clinical Modification, Volume 1 and 2 2 ICD9CM (NCHS) 3 ICD9Proc International Classification of Diseases, Ninth Revision, Clinical Modification, Volume 3 (NCHS) 4 CPT4 Current Procedural Terminology version 4 (AMA) 5 HCPCS Healthcare Common Procedure Coding System (CMS) 6 LOINC Logical Observation Identifiers Names and Codes (Regenstrief Institute) 7 NDFRT National Drug File - Reference Terminology (VA) 8 RxNorm RxNorm (NLM) 9 NDC National Drug Code (FDA and manufacturers) 10 GPI Medi-Span Generic Product Identifier (Wolters Kluwer Health) 11 UCUM Unified Code for Units of Measure (Regenstrief Institute) 12 Gender OMOP Gender 13 Race Race and Ethnicity Code Set (USBC) 14 Place of Service Place of Service Codes for Professional Claims (CMS) 15 MedDRA Medical Dictionary for Regulatory Activities (MSSO) 16 Multum Cerner Multum (Cerner) 17 Read NHS UK Read Codes Version 2 (HSCIC) 18 OXMIS Oxford Medical Information System (OCHP) 19 Indication Indications and Contraindications (FDB) 20 ETC Enhanced Therapeutic Classification (FDB) 21 ATC WHO Anatomic Therapeutic Chemical Classification 22 Multilex Multilex (FDB) 28 VA Product VA National Drug File Product (VA) 31 SMQ Standardised MedDRA Queries (MSSO) 32 VA Class VA National Drug File Class (VA) 33 Cohort Legacy OMOP HOI or DOI cohort 34 ICD10 International Classification of Diseases, 10th Revision, (WHO) 35 ICD10PCS ICD-10 Procedure Coding System (CMS) 40 DRG Diagnosis-related group (CMS) 41 MDC Major Diagnostic Categories (CMS) 42 APC Ambulatory Payment Classification (CMS) 43 Revenue Code UB04/CMS1450 Revenue Codes (CMS) 44 Ethnicity OMOP Ethnicity 46 MeSH Medical Subject Headings (NLM) 47 NUCC National Uniform Claim Committee Health Care Provider Taxonomy Code Set (NUCC) 48 Specialty Medicare provider/supplier specialty codes (CMS) 50 SPL Structured Product Labeling (FDA) 53 Genseqno Generic sequence number (FDB) 54 CCS Clinical Classifications Software for ICD-9-CM (HCUP) 55 OPCS4 OPCS Classification of Interventions and Procedures version 4 (NHS) 56 Gemscript Gemscript NHS dictionary of medicine and devices (NHS) 57 HES Specialty Hospital Episode Statistics Specialty (NHS) 60 PCORNet National Patient-Centered Clinical Research Network (PCORI) 65 Currency International Currency Symbol (ISO 4217) 70 ICD10CM International Classification of Diseases, 10th Revision, Clinical Modification (NCHS) 72 CIEL Columbia International ehealth Laboratory (Columbia University)

29 Additional Vocabulary Support If you use non-standard vocabularies, you can also utilize our vocabulary mapper tool Usagi
30 Step 3: Turn the Crank Write the SQL using the generated ETL doc as you guide Get help on the forums from the many folks who have done it before We provide tools to explore and analyze your data and data quality as you go along so you can iterate as needed
31 Getting Value from Your Data Once your data has been transformed, the OHDSI platform opens up a variety of ways to explore it
32 Characterization in OHDSI In OHDSI, characterization = generating a comprehensive overview of a patient dataset Clinical (e.g., conditions, medications, procedures) Metadata (e.g., observation periods, data density) Supports Feasibility studies Hypothesis generation Data quality assessment Data sharing (aggregate-level)


33 ACHILLES: Database characterization to examine if the data have elements required for the analysis

34 ACHILLES Report Types

35 ACHILLES Heel Helps You Validate Your Data Quality
36 Why Data Quality? Fitness for analysis, trust in outputs, completeness of data Data transformation: Source -> Target Errors in data: Source error (typo in birth year; no pattern) ETL error (has pattern) Mapping error Common Data Models allows sharing of data quality rules and creating of data quality tools Existence of data quality tools allows sites to quickly implement a starter set of rules
37 Achilles Heel (your free data quality tool) Achilles (step 1 of 2) Pre-computed measures (Achilles.sql) Achilles Heel (step 2 of 2) Data quality rules (AchillesHeel.sql) Achilles Web Web-based data viewer Paradigm: Patient level data -> something smaller (10B rows) (2M rows)
38

39
40

41 Step 1 Pre-computed analyses

42 Drug quantity by drug ID
43 What is new? (Achilles Heel v1.2; March 2016) Introduction of RULE_ID and rule overview CSV file Better reporting of depth of the error (number of rows with a given error) Support for CDM v5 Generalizability to other CDMs Separation of model-conformance rules from rules examining source data (zombie events) Data measure vs. data quality measure; target model terminology (RxNorm) More rules (contribute your favorite DQ rule); non- Achilles efforts (IRIS)
44 From Populations to Cohorts Once you ve explored your overall dataset, designing cohorts allows you to analyze individual populations, conduct studies, explore trial feasibility, and so forth CIRCE provides a graphical interface for defining patient cohorts
45 Building Cohorts When building cohorts, it is very helpful to reference ACHILLES data to see frequently used concepts This data-driven approach can similarly be achieved through the Hermes vocabulary explorer
46 Building Cohorts In addition to the graphical tools, cohorts can also be generated by manual SQL queries or imported from external sources

47 HERMES: Explore the standardized vocabularies to define exposures, outcomes, and covariates

48 CIRCE: Define cohorts of interest

49
50 Cohort Creation vs Analysis Cohorts may be designed and stored and shared Choice of tools to visualize and analyze Cohort visualization is performed using Heracles

51 HERACLES: Characterize the cohorts of interest

52 HERACLES
53
54
55
56 HERACLES Parameters Can limit to specific analyses (e.g., just procedures) Can target specific concepts (e.g., a drug class, a particular condition) Can window on cohort-specific date ranges

57 CALYPSO: Impact of Study Inclusion Criteria in Clinical Trials
58 Open-source large-scale analytics through R (and C, CUDA) Why is this a novel approach? Large-scale analytics, scalable to big data problems in healthcare: millions of patients millions of covariates millions of questions End-to-end analysis, from CDM through evidence No longer de-coupling informatics from statistics from epidemiology

59 LAERTES: Summarizing evidence from existing data sources: literature, labeling, spontaneous reporting
60 Columbia data network approach New York City Columbia PCORnet EHR OHDSI OMOP NYC CDRN i2b2 NYC CDRN i2b2 OHDSI OMOP SCILHS (Boston) OHDSI i2b2 SHRINE

61 OHDSI answers questions Naproxen has one of the most significant associations with GI bleed, along with other NSAIDs Explore all drugs for a given outcome
62 Generate evidence OHDSI in Action Randomized trial is the gold standard Observational research seen as supporting
63 Observational Data & Clinical Trials Sample size calculations Do we have enough patients to carry out a trial? Recruitment Find patients or their clinicians from EHRs Pragmatic trials: recruitment and data collection ADAPTABLE aspirin trial Complementary causal evidence (future) New methods to handle confounding and ascertain causes from retrospective observational databases
64 Characterization Today we carry out RCTs without clear knowledge of actual practice There will be no RCTs without an observational precursor It will be required to characterize a population using largescale observational data before designing an RCT Disease burden Actual treatment practice Time on therapy Course and complication rate Done now somewhat through literature and pilot studies
65 Treatment Pathways Global stakeholders Public Academics Industry Evidence RCT, Obs Conduits Social media Lay press Literature Guidelines Advertising Local stakeholders Family Patient Clinician Regulator Formulary Labels Consultant Inputs Indication Feasibility Cost Preference
66 1. Join the collaborative Network process 2. Propose a study to the open collaborative 3. Write protocol 4. Code it, run it locally, debug it (minimize others work) 5. Publish it: 6. Each node voluntarily executes on their CDM 7. Centrally share results 8. Collaboratively explore results and jointly publish findings
67 OHDSI in action: Chronic disease treatment pathways Conceived at AMIA Protocol written, code written and tested at 2 sites Analysis submitted to OHDSI network Results submitted for 7 databases 15Nov Nov2014 2Dec2014 5Dec2014
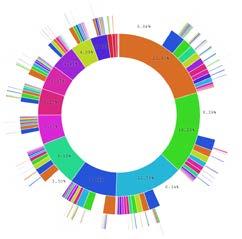
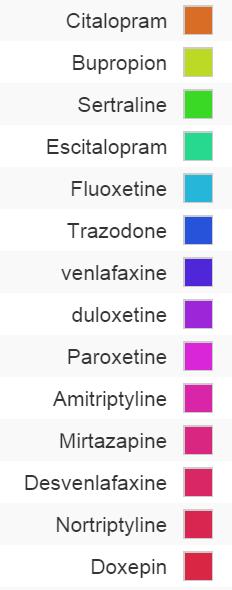
68 Condition definitions Disease Medication classes Diagnosis Exclusions Hypertension ( HTN ) antihypertensives, diuretics, peripheral vasodilators, beta blocking agents, calcium channel blockers, agents acting on the renin-angiotensin system (all ATC) hyperpiesis (SNOMED) pregnancy observations (SNOMED) Diabetes mellitus, Type 2 ( Diabetes ) drugs used in diabetes (ATC), diabetic therapy (FDB) diabetes mellitus (SNOMED) pregnancy observations (SNOMED), type 1 diabetes mellitus (MedDRA) Depression antidepressants (ATC), antidepressants (FDB) depressive disorder (SNOMED) pregnancy observations (SNOMED), bipolar I disorder (SNOMED), schizophrenia (SNOMED)

69 Treatment pathway event flow
70 Abbreviation OHDSI participating data partners Name Description Population, millions AUSOM Ajou University School of Medicine South Korea; inpatient hospital 2 EHR CCAE MarketScan Commercial Claims and Encounters US private-payer claims 119 CPRD UK Clinical Practice Research Datalink UK; EHR from general practice 11 CUMC Columbia University Medical Center US; inpatient EHR 4 GE GE Centricity US; outpatient EHR 33 INPC Regenstrief Institute, Indiana Network for Patient Care US; integrated health exchange 15 JMDC Japan Medical Data Center Japan; private-payer claims 3 MDCD MarketScan Medicaid Multi-State US; public-payer claims 17 MDCR MarketScan Medicare Supplemental and Coordination of Benefits US; private and public-payer claims OPTUM Optum ClinFormatics US; private-payer claims 40 STRIDE Stanford Translational Research Integrated US; inpatient EHR 2 Database Environment HKU Hong Kong University Hong Kong; EHR 1 9

71 Proceedings of the National Academy of Sciences, 2016

72 Treatment pathways for diabetes T2DM : All databases Only drug First drug Second drug


73 Population-level heterogeneity across systems, and patient-level heterogeneity within systems Type 2 Diabetes Mellitus CCAE Hypertension CUMC Depression MDCD CPRD INPC GE JMDC MDCR OPTUM Hripcsak et al, PNAS, under review


74 Patient-level heterogeneity HTN: All databases 25% of HTN patients (10% of others) have a unique path despite 250M pop

75 Medication-use metrics by data source
76 Monotherapy diabetes 1 0,9 General upward trend in monotherapy 0,8 0,7 0,6 0,5 0,4 0,3 0,2 0, AUSOM (SKorea*) CCAE (US#) CPRD (UK*) CUMC (US*) GE (US*) INPC (US*#) JMDC (Japan#) MDCD (US#) MDCR (US#) OPTUM (US#) STRIDE (US*)
77 Monotherapy HTN Academic medical centers differ from general practices 1 0,9 0,8 0,7 0,6 0,5 0,4 0,3 0,2 0, AUSOM (SKorea*) CCAE (US#) CPRD (UK*) CUMC (US*) GE (US*) INPC (US*#) JMDC (Japan#) MDCD (US#) MDCR (US#) OPTUM (US#) STRIDE (US*)
 CCAE (US#) CPRD (UK*) CUMC (US*) GE (US*) INPC (US*#) JMDC (Japan#) MDCD (US#) MDCR (US#) OPTUM (US#) STRIDE")
78 Monotherapy diabetes General practices, whether EHR or claims, have similar profiles 1 0,9 0,8 0,7 0,6 0,5 0,4 0,3 0,2 0, AUSOM (SKorea*) CCAE (US#) CPRD (UK*) CUMC (US*) GE (US*) INPC (US*#) JMDC (Japan#) MDCD (US#) MDCR (US#) OPTUM (US#) STRIDE (US*)
79 Privacy Patient privacy Keep data within institutional firewall De-identify the database removing identifiers and potentially shifting dates US: Safe Harbor and Statistical Determination of Low Risk of Re-identification Business privacy Public display of uncorrected error rates Retained object Public display of competitive strengths and weaknesses Pool data
80 Conclusions: Treatment pathways General progress toward more consistent therapy over time and across locations Differ by country Differ by practice type Not differ so much by data type (claims, EHR) Differ by disease Even before guidelines published Disease differences and literature Huge proportion of unique pathways
81 Conclusions: Network research It is feasible to encode the world population in a single data model Over 600,000,000 records by voluntary effort (682,000,000) Generating evidence is feasible Stakeholders willing to share results Able to accommodate vast differences in privacy and research regulation
82 Join the journey 82