Gaining Insight from PI System Data Using New Tools for Operational Intelligence Presented by. Curt Hertler, Marketing Manager, OSIsoft
|
|
|
- Bethanie Maxwell
- 5 years ago
- Views:
Transcription

1 Gaining Insight from PI System Data Using New Tools for Operational Intelligence Presented by Curt Hertler, Marketing Manager, OSIsoft
2 Agenda Business Intelligence (BI) Technologies Multidimensional Data Analysis Operational Intelligence Introduction to Self-service BI PI AF PI OLEDB Enterprise 2010 Microsoft PowerPivot for Excel 2010 Microsoft SharePoint 2010 Enterprise Example Walk Through Other Examples and Additional Information 2
")
3 Business Intelligence (BI) Technologies 3
, based on user-selected criteria (dimensions), to identify opportunities for improvement.")
4 4 Multidimensional Data Analysis Quick, ad hoc, aggregation of large amounts of interesting data (facts), based on user-selected criteria (dimensions), to identify opportunities for improvement.


5 Operational Intelligence 5

6 Customer Example: CFE Mexico 6

7 Introduction to Self-Service BI 7


8 OSIsoft / Microsoft BI Stack Enterprise Enterprise or above PI for Office 2010 PI System
9 9 Self-service BI Toolkit for the PI System Facts and Dimensions PI AF (PI System 2010) Datasets for BI Data Extraction PI OLEDB Enterprise 2010 (PI for Office 2010) Desktop Analysis and Cube Configuration Microsoft PowerPivot for Excel 2010 Enterprise Accountability Microsoft PowerPivot for SharePoint 2010 Microsoft SharePoint 2010 Enterprise Microsoft SQL Server 2008 R2 Enterprise or above
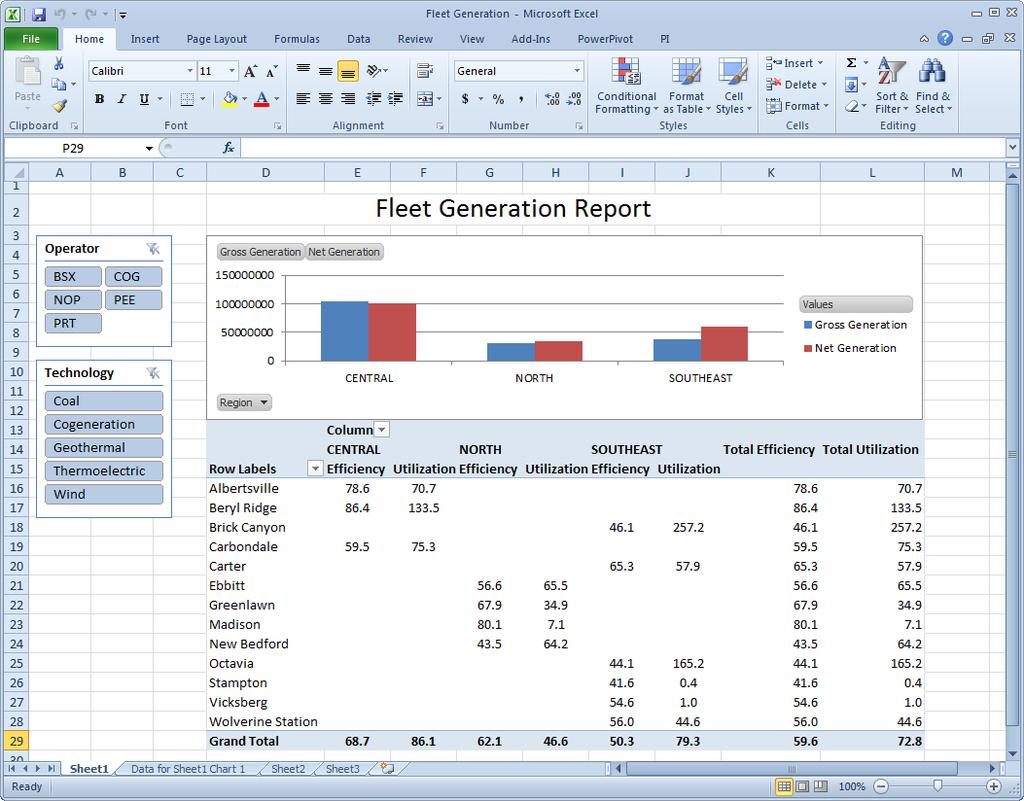
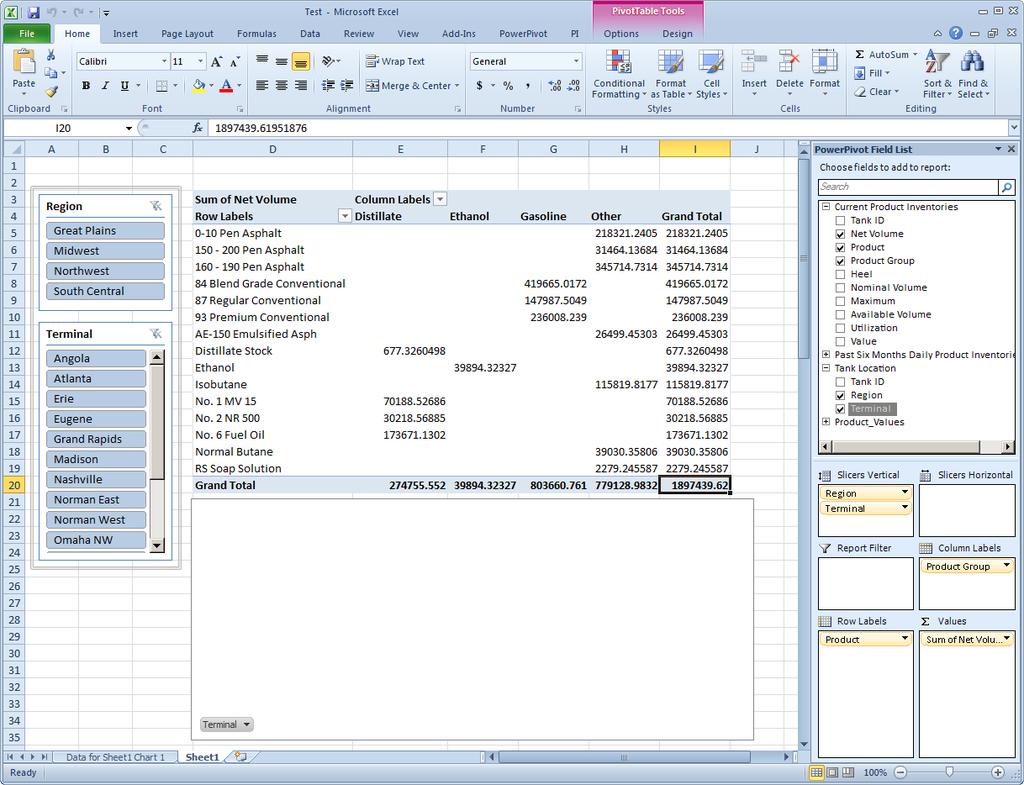
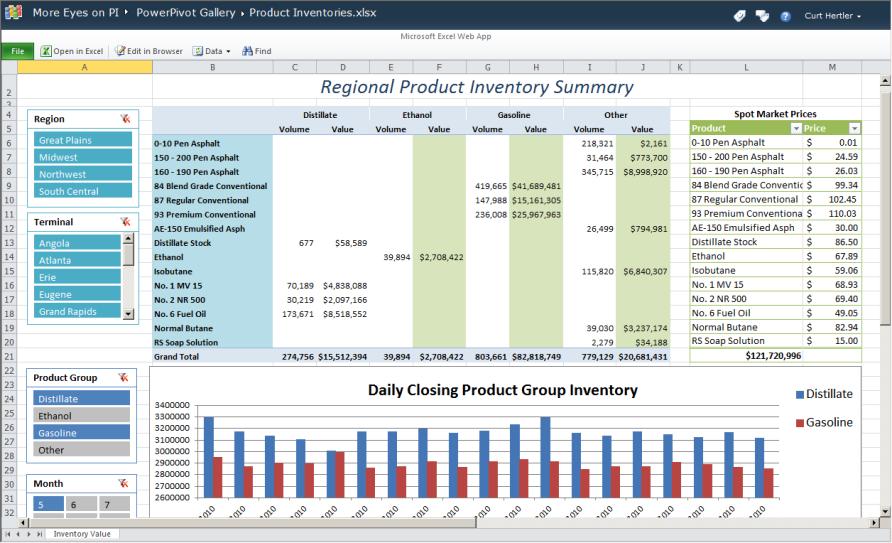
10 Example: Product Inventories 10


11 11 PI AF Associates Facts and Dimensions Facts Dimensions Facts AF Attributes Hierarchy Attributes Volume Region PI Point Product Terminal Formula Product Tank Other Dimensions Group Hierarchy Templates Categories


12 12 PI OLEDB Enterprise 2010 Facts Dimensions PI - SQL AF AF Attributes Hierarchy Commander


13 Introducing PowerPivot for Excel 2010 Empowering The End User Enable users to perform self-service analysis and intuitively build their own BI solutions Allow users to interactively explore and perform calculations on large data sets Integrate data from multiple sources Minimize dependence on IT support 13

 are")


14 Microsoft PowerPivot for Excel 2010 Add-In for Excel Accessible Supports very large datasets from a variety of sources. Scalable Relationships and calculations (DAX 1 ) are easily defined. Configurable Data cube created and stored with spreadsheet. Personal Analytical functionality supported in SharePoint Organizational Data refresh may be scheduled. Timely 1. Data Analysis Expression Language Data Sources: PI, RDB, SAS Cubes, Spreadsheet 14
15 Multidimensional Data Cube Dimensions Terminal Region Tulsa Wichita Benton Clemont Great Plains Michigan Midwest South Central Time RON $ RON $ RON $ RON $2340 Hour 87,560 Kero. $ ,132 No. 2 $ ,132 No. 2 $ ,,360 Kero. $7360 Month 87,565 Prop. $ ,561 Ethanol $ ,500 LPG. $ Prop. $2360 Shift T-445 SS Storage Tank Facts Net Volume (BBL) Product Value ($) 15

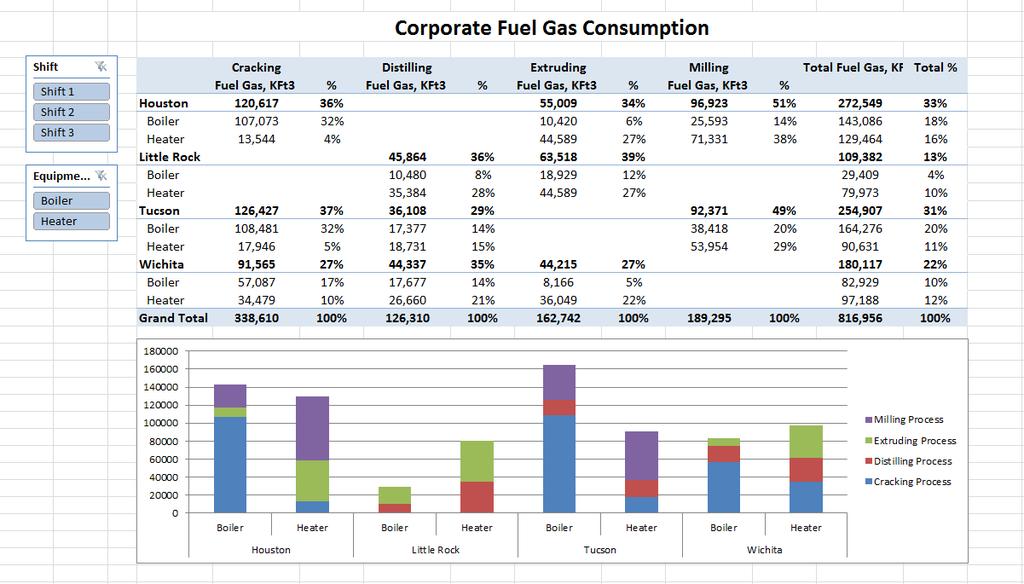
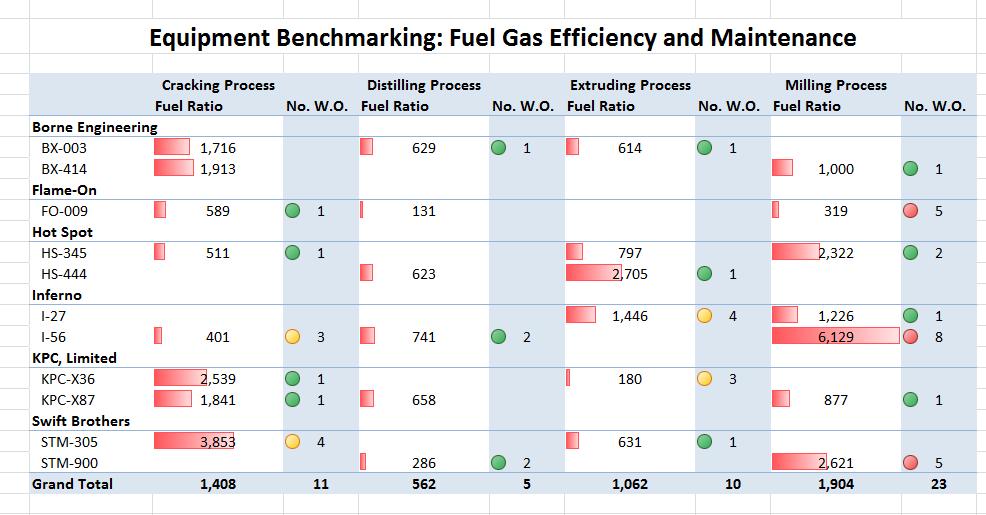
16 Example Walk Through 16
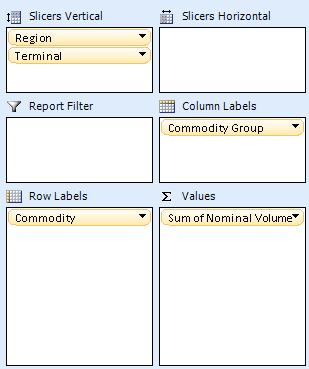
17 17 Product Inventories and Valuation Slicers filter data shown in PowerPivot Tables and Charts
18 Product Inventories and Valuation 18

19 Product Inventories and Valuation 19
20 Product Inventories and Valuation 20
21 21 Product Inventories and Valuation Linked Tables Manual entry of data into PowerPivot cube for What- If analysis


22 Import Data into PowerPivot PowerPivot Add-In for Excel 2010 Configure Relationships Add Calculations Using DAX 1 Current Product Inventories PI OLEDB Enterprise 2010 Six Months Daily Inventories PI OLEDB Enterprise 2010 Tank Location PI OLEDB Enterprise 2010 Commodity Prices Excel Linked Table 1. Data Analysis Expression Language
23 Build PowerPivot Tables and Charts 23

24 SharePoint 2010 Enterprise 24

25 25 Other Examples and Additional Information

26 26 Energy Benchmarking Utility consumption comparison between refineries by process. Filter performance by month or crude type


27 27 Power Distribution and Asset Condition Substation power distribution by rate period and transformer age. Identify transformer condition risk.

28 28 Facility Energy Management Hourly energy expense based on time of day and outside temperature.

29 29 Raw Material Processing and Yield Improvement Analyze process conditions against product yield. Filter performance by ore grade, shift or processing line

30 30 IT Resources Dashboard Overview of corporate computing efficiency and resource utilization. Quantify resource use by application Avoid potential server problems
31 31 Resources OSIsoft Resources Recorded Users Conference 2010 and 2011 Presentations Recorded vcampus Presentations Prescriptive Architecture Guides Books PowerPivot for the Data Analyst, Bill Jelen Practical PowerPivot & DAX Formulas for Excel 2010, Art Tennick Microsoft Resources PowerPivot ( CFE Case Study ( Server-2010/Comisi-n-Federal-de-Electricidad-CFE/Mexico-s-Electrical-Utility- Sees-Saving-Millions-of-Dollars-through-Collaborative-BI/ ) Windows Azure DataMarket (datamarket.azure.com)

32