TENNANT COMPANY. BAIRD CONFERENCE November 7, Tom Paulson SVP and CFO REINVENTING HOW THE WORLD CLEANS
|
|
|
- Megan Dalton
- 5 years ago
- Views:
Transcription

1 BAIRD CONFERENCE November 7, 2018 Tom Paulson SVP and CFO REINVENTING HOW THE WORLD CLEANS
2 2 Safe Harbor Statement This presentation contains certain statements that are considered forward-looking statements within the meaning of the Private Securities Litigation Reform Act of Forward-looking statements generally can be identified by the use of forward-looking terminology such as may, will, expect, intend, estimate, anticipate, believe, project, or continue or similar words or the negative thereof. These statements do not relate to strictly historical or current facts and provide current expectations of forecasts of future events. Any such expectations or forecasts of future events are subject to a variety of factors. We caution that forward-looking statements must be considered carefully and that actual results may differ in material ways due to risks and uncertainties both known and unknown. Information about factors that could materially affect our results can be found in Part I, Item 1A, Risk Factors in our Annual Report on Form 10-K for the year ended December 31, 2017, and in Part II, Item 1A, Risk Factors in our most recent quarterly report on Form 10-Q. Shareholders and potential investors are urged to consider these factors in evaluating forward-looking statements and are cautioned not to place undue reliance on such forward-looking statements. We undertake no obligation to update or revise any forward-looking statement, whether as a result of new information, future events or otherwise. Investors are advised to consult any further disclosures by us in our filings with the Securities and Exchange Commission and in other written statements on related subjects. It is not possible to anticipate or foresee all risk factors, and investors should not consider any list of such factors to be an exhaustive or complete list of all risks or uncertainties.

3 3 About Tennant Company Tennant Company, a Minnesota corporation founded in 1870 and incorporated in 1909, is a world leader in designing, manufacturing and marketing solutions that empower customers to achieve quality cleaning performance, reduce environmental impact and help create a cleaner, safer, healthier world. NYSE Symbol: TNC REVENUES 5 Year ORGANIC GROWTH 2017 Adjusted EBITDA* Balance sheet & cash flow *See appendix for Non-GAAP reconciliation.


4 4 OUR VISION We will lead our global industry in sustainable cleaning innovation that empowers our customers to create a cleaner, safer and healthier world. THE CLEANING INDUSTRY LEADER INNOVATION LEADER UNMATCHED SERVICE INDUSTRY-LEADING QUALITY
5 $ Millions 5 Shareholder Return Tennant Dividends & Share Repurchases $65 $60 $55 $50 $45 $40 $35 $30 $25 $20 $15 $10 $5 $0 Dividends Share Repurchase $46.0 $22.2 $14.1 $12.8 $13.2 $14.5 $14.5 $14.3 $ % Dividend Yield Consecutive years of cash dividends 2017 & 2018 Focus on Debt Reduction Consecutive years of increase in annual cash dividend payout Remaining Share Repurchase Authorization (1.4M shares)
6 6 Global Footprint GLOBAL MANUFACTURING LOCATIONS MINNEAPOLIS Minnesota, USA Headquarters HOLLAND Michigan, USA CHICAGO Illinois, USA UDEN The Netherlands 2017 GLOBAL NET SALES BY REGION LOUISVILLE Kentucky, USA ITALY IPC SHANGHAI China Americas EMEA APAC LIMEIRA Brazil 64% 27% 9% TENNANT BY THE NUMBERS 4,300+ EMPLOYEES 13 MFG PLANTS 40,000+ CUSTOMERS 300+ SALES REPS 400+ DISTRIBUTORS 100+ COUNTRIES


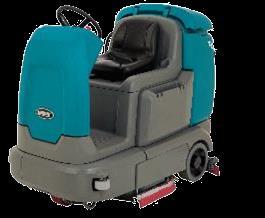

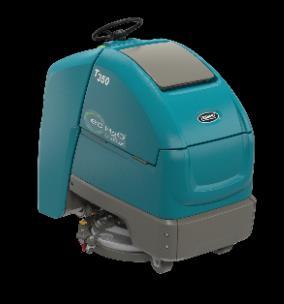


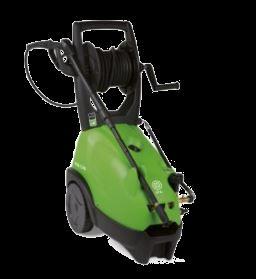

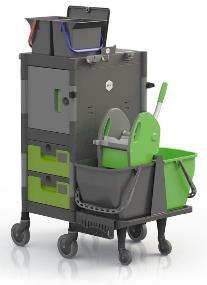

7 7 A Broad Portfolio of Solutions Whatever the cleaning need, Tennant offers a variety of equipment and technologies to help increase cleaning productivity PRODUCTS Commercial Industrial Vacuums Pressure Washers Coatings Aftermarket Tools TECHNOLOGIES ROBOTICS

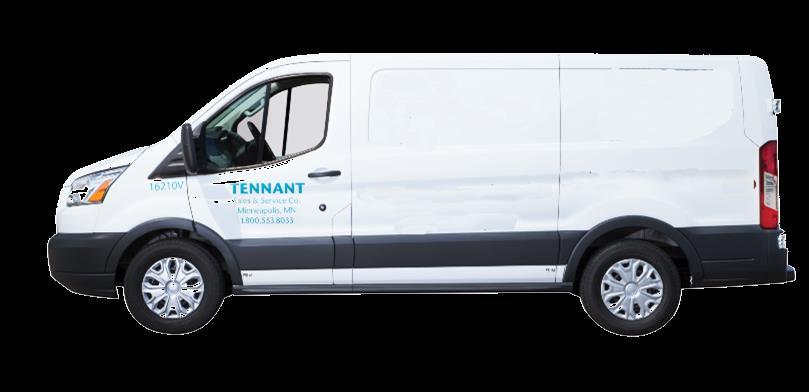


8 CREATING GROWTH Aftermarket & Recon Support Global Direct Service Employees Extensive Field Service Team Parts & Consumables Pre-Owned Machines
9 9 Global Revenue Global Revenue by SALES CHANNEL Net Sales by PRODUCT GROUP 67% 33% 64% 20% 13% 3% Direct More than 500 cross-functional teams & market specialists Distribution Distribution partners in more than 80 countries around the world Equipment Equipment Mix Commercial 56% Industrial 36% Pre-owned 3% All other 5% Parts & Consumables Service Coatings


10 10 How we go to Market Our Channels Key Markets Our Customers Strategic Accounts Direct Sales Contract Cleaners Manufacturing Distribution Service Education Healthcare e-commerce Logistics & Warehousing Retail
11 11 Market Share Tennant IPC Nobles Alfa Orbio 20% MARKET SIZE $5B Nilfisk Advance Clarke Viper 38% Includes only Tennant-like categories Excludes power washers & tools Karcher Windsor TecServ ProChem Hako Minuteman PowerBoss 18% 12% of the market consists of others with a market share of 3% or less Taski 9% 3%

12 12 TENNANT S FUTURE
13 13 Growth Strategy $ DIVERSIFICATION OF REVENUE STREAMS IPC INTEGRATION TECHNOLOGY LEADERSHIP COST STRUCTURE OPTIMIZATION STRENGTHEN FINANCIAL POSITION GROWTH PLAN FOCUS Diversify our revenue streams by expanding our sales growth drivers across all geographic regions and managing our go-to-market strategy to address new customer segments and products Successfully complete the integration of IPC Build on our recognized technology leadership and support our robust new product pipeline Optimize our cost structure to improve operating efficiency while continuing to fuel growth investments Strengthen our financial position and balance solid cash flow, growth investments, debt reduction, dividends and share repurchases Focus on our organic growth plans and be openminded about the right strategic inorganic growth opportunities with potential to further enhance shareholder value


14 CREATING GROWTH Diversification of Revenue Streams 14 AMERICAS EMEA APAC Region Expanding sales growth drivers across all geographic regions Brand & Product Diversifying our brand & product portfolio
 100+")


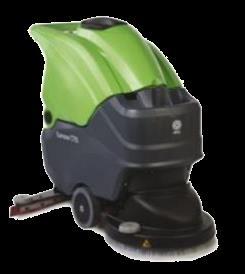
15 CREATING GROWTH IPC Group 15 Revenue by GEOGRAPHY Growth Strategy Acquisition MFG LOCATIONS 5 COUNTRIES (SALES) 100+ EMEA 78% Americas 13% APAC 9% Revenue by PRODUCT Synergy Opportunities Complementary sales channels Cross-selling to reach new customers Cost synergies Sweepers/Scrubbers 27% Vacuums 17% Tools/Supplies 18% High Pressure 15% Parts & Consum. 14% Service 9%


16 CREATING GROWTH Technology Leadership 16 TNC Internal R&D Solving Customer Challenges through Innovation Core Process Innovation 3 rd Party Extension MACHINE Productivity Drive efficiency in cleaning task PROCESS Productivity Drive efficiency in cleaning process Tennant Innovation Ecosystem TOTAL COST Productivity Drive efficiency in elimination of task or process New Product Vitality Index R&D Investment Technology Research Supplier Partnership +30% 3-4% Joint Development


17 CREATING GROWTH Autonomous Cleaning Machines 17 Tennant quality and performance with Brain navigation software offers unmatched value proposition to address customer labor needs Q Introduction Autonomous T7 Scrubber in North America with further expansion into global markets & additional models to follow Industry-Leading Autonomous Navigation System Brain Corp Relationship Uniquely Positioned in Market Single point of contact for equipment, extensive field service & support, robust customer training and process consultation

18 18 FINANCIAL SUMMARY
19 $ Millions $ Millions 19 Financials Revenue EBITDA Adjusted EPS Revenue EBITDA (adjusted)* EPS (adjusted)* $1,200 $1,000 $800 $822 $812 $809 $1,003 $1,120 $120.0 $100.0 $80.0 $91.0 $84.5 $85.7 $101.6 $120.5 $3.00 $2.50 $2.00 $2.70 $2.49 $2.59 $2.10 $600 $60.0 $1.50 $1.54 $400 $40.0 $1.00 $200 $20.0 $0.50 $ Guidance Midpoint $ Guidance Midpoint $ Guidance Midpoint 2018 Guidance 2018 Guidance 2018 Guidance $1.115B to $1.125B (~5% Organic) $119M to $122M (10.8%) $2.05 to $2.15 *See appendix for Non-GAAP reconciliation.
20 $ Millions 20 Capital Allocation Use of Cash Free Cash Flow Invest in the business $50 $45 $40 $35 $45.2 $40.1 $32.0 $36.2 Manage debt under 3.0 leverage $30 Dividends Share repurchase $25 $20 $15 $10 $5 $20.8 Strategic inorganic growth $ Operating Cash Flow $59.8 $59.4 $45.2 $57.9 $54.2 CapEx ($14.6) ($19.3) ($24.4) ($25.9) ($18.0)
21 21 Summary Growth Strategy Operating Performance DIVERSIFICATION OF REVENUE STREAMS IPC INTEGRATION TECHNOLOGY LEADERSHIP GROSS MARGIN RECOVERY PLANS STRONG CASH FLOW DRIVING SHAREHOLDER VALUE