Designing Guest Flow and Operations Logistics for the Dolphin Tales
|
|
|
- Fay Watson
- 5 years ago
- Views:
Transcription
1 Designing Guest Flow and Operations Logistics for the Dolphin Tales
2 The Team The Aquarium Joseph Handy Alex Desiderio Ruth Lopez Brian Davis Georgia Tech Eva K Lee Chien Hung Chen Niquelle Brown Tsung Lin Wu Time motion study: C Girard, I Alev, S Lahlou, H Lee, B McClure, AO Ozlu, A Yang, K Yee, F Yuan
3 The Georgia Aquarium The world s largest aquarium with over 8.5 million gallons of water and 120,000+ animals Dolphin_Tales_Final_web.mov


4 The Aquarium Layout

5 The new Dolphin Tales Analyze the exhibit s impact on guest flow within the Aquarium Goal: enhance guest experience while minimizing congestion and optimizing the wellness of the dolphins.
6 Objectives Understand current guest flow and behavior patterns (choice/selection patterns) Predict new exhibit flow and its impact on surrounding areas and overall guest flow Optimize operations, logistics, and resource allocation with guest flows Determine optimal scheduling, loading, unloading, and exit strategies Investigate smart space allocation, design and usage options
7 Challenges Limited physical space, same doors for entrance and exit Must understand the heterogeneous flows across the entire Aquarium, a difficult task of data collection Critical decision nodes must be identified to coincide with the cognitive decisions of guests
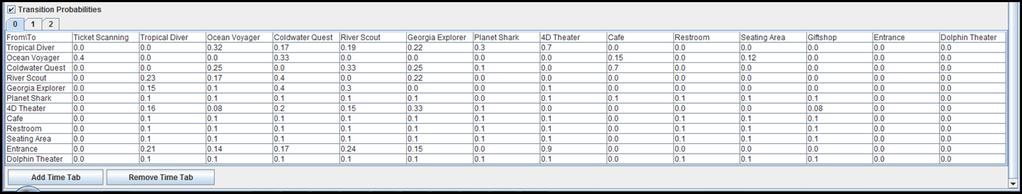
8 Complex and Individual Based Modeling Determine points of interest Perform time motion study Interarrival times of guests Individual versus group behavior Travel times between points of interest Time spent in points of interest Cognitive decision behavior of guests Model the system: the facility layout, physical design and activities, and guest movement


9 The Aquarium Layout
10 RealOpt ABM Large scale simulation optimization decision support environment Modeling: Process based top down approach Individual bottom up approach with active decision making capability Hybrid (cognitive versus influenced by processes)
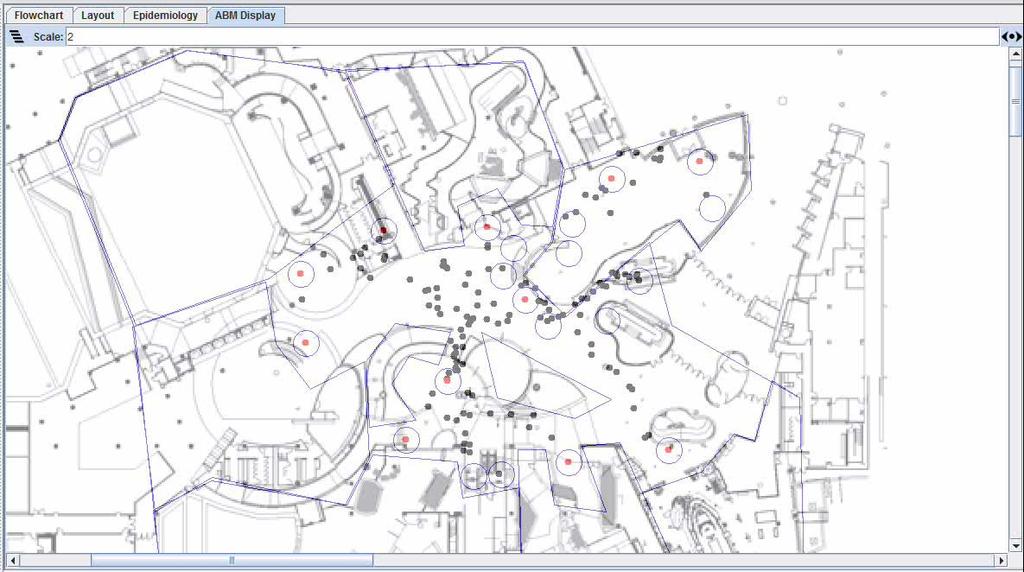
11 The simulation environment

12 Drawing Panel
13 System Processes Users can define system processes, and precedence relations between those processes in 3 manners: On all processes On some, while others are determined dynamically during simulation, based on probabilities, and the agent s choice Determined entirely during simulation Novelty: as users incorporate (draw) processes onto the Layout Panel, the associated systems process flowchart is automatically created.


14 Physical Layout vs Process Flow

15 Processes of a Submodel
16 3D Path Finding: Novel Features Topological maps connecting different layers in the 3D virtual world Each region (node) connects to other region through actual physical Connectors (stairs, elevators, hallways) Global map generated automatically from user input Path finding is performed on the connected graph (sequence of regions a guest will travel to reach his/her destination)
17 2D Path Finding: Novel Features Physical layout drawn will define user movements Discretized into cells (nodes) Local graph is formed with nodes connected indicating accessibility Paths are determined while satisfying the physical obstacles Rapid pre solve on all possible origin destination pairs Agents may have limited knowledge of entire physical layout (some nodes removed in their path finding process)
18 The optimization engine
19 Multiple Resource Allocation Objectives: minimize resources maximize throughput Constraints: maximum limits on wait time and queue length range of utilization desired at each station assignability and availability, for each resource group, of resource types at each station maximum limit on the cycle time of the individual.

20 Nonlinear Mixed Integer Program Parameters:
21 Nonlinear Mixed Integer Program Decision Variables x ijr : the number of resources of type i in resource group r assigned to station j. r R, i T r, j S ir Cost functions Cost at each station = g j ( k ijr x ijr, w j, q j, u j ) Total cost = j (g j, c, j) Not a closed form
22 NMIP: Mathematical Formulation
23 Computational Strategies Perform several simulation iterations to estimate the system parameters Apply a fluid model to determine the resource allocation, x* Apply a minimum network flow model to assign workers of specific skills based on x* Perform simulation and re optimize with local search to incorporate stochasticity information within the search process Must be smart in implementation to ensure rapid solution time.
24 Show Schedules Simulation optimization strives to serve the maximum number of guests who desire to see the show while minimizing congestion across different regions of the Aquarium.
25 Recommendations Strategies and corresponding prediction of loading and emptying times for the Dolphin theatre. Optimal schedule times & number of Dolphin shows: Sundays Fridays: 2 shows when number of Aquarium attendees < 6000, or 3 shows otherwise. Saturdays: 3 shows when attendees are under 7000, or 4 shows otherwise. To minimize congestion, it is desirable to separate each show by at least 90 minutes. Optimal number of guests per show: attendees appear to arouse most excitement among the crowd.
26 Recommendations Optimal staffing and resource allocation for efficient operations and guest experience. For rapid clearing of the Dolphin Lobby, between 15 50% of guests should use the 2 nd floor exit. Stroller parking: a large percentage of the Dolphin Lobby area will be occupied by strollers. valet stroller parking (outside the Dolphin Lobby) in the main lobby to provide seamless guest experience, and avoid logistics bottlenecks and congestion in the Dolphin lobby.

27 Time to Empty the Theatre
28 Impact of Exiting Time and Show Interval on Dolphin Area Traffic
29 Added Values Optimal show schedule is conducive to the well being of the dolphins Reduction of one unnecessary show per week saves over $1.5 million per year (> 11 million) Capability to employ the system for future expansion and other studies (yield management, bundle tickets, systems optimization)
30
31
32
33 OR Technological Advances I: Powerful simulation optimization system with complex modeling and rapid computation We integrated simulation and optimization technology into a unified software framework for realistic modeling of large scale real world applications with human cognitive and behavioral elements. We created a more seamless and more powerful decision support environment. The software assists in optimizing overall systems dynamics, processes, and operations.
34 OR Technological Advances II: Large scale optimization and computation We designed a powerful 2 step approach heuristic algorithm for finding good feasible solutions for intractable nonlinear mixed integer program resource allocation instances. Aids in solving a wide variety of difficult NMIP instances that are computationally intractable using currently available strategies.
35 OR Technological Advances III: Powerful cognitive analytic integration We developed software for automatically interpreting human computer rendered drawings of processes/tasks in our design panel into system process maps for simulation and optimization. As complex visualization and graphical user interfaces become ubiquitous in decision analysis, automatic translation from mouse clicks and keystrokes to analytic workflow models become essential in humancomputer interface. Our design exploits multiple automatic translations that offer seamless user interfaces as well as powerful cognitive analytic integration.
36 Added Value Has been used to model other types of events Emergency response evacuation (London subway explosion, evacuation of football stadium in Spain, Haiti earthquake) Epidemiology and disease propagation Surveillance Mass dispensing clinical facilities Receive, staging, storage for medical countermeasures

37