Investor Presentation
|
|
|
- Priscilla Little
- 5 years ago
- Views:
Transcription


1 Investor Presentation May 7,
2 Safe Harbor Statement This presentation contains forward-looking statements within the meaning of the Private Securities Litigation Reform Act of These forward-looking statements may be identified by their use of terms and phrases such as believe, will, estimate, continue, anticipate, intend, should, plan, expect, predict, could, potentially or the negative of these terms or other similar expressions and include statements concerning future financial and operating performance. The outcome of the events described in these forward-looking statements is subject to known and unknown risks, uncertainties and other factors that could cause actual results to differ materially from the results anticipated by these forward-looking statements, including, but not limited to: the Company s dependence on the success of BroadWorks and on its service provider customers to sell services using its applications; claims that the Company infringes the intellectual property rights of others; the Company s dependence in large part on service providers continued deployment of, and investment in, their IP-based networks; and the Company s ability to expand its product offerings, as well as those factors contained in the Risk Factors section of the Company s Form 10-K for the year ended December 31, 2011 filed with the SEC on February 29, 2012 and in the Company s other filings with the SEC. All information in this presentation is as of May 7, Except as required by law, the Company undertakes no obligation to update publicly any forward-looking statement made herein to conform the statement to actual results or changes in the Company s expectations. 2


3 BroadSoft Overview Service providers are transforming their business models through IP-based applications Our software is the platform over which these applications are delivered We are the global market leader 3
4 Investment Highlights Large, Converging Markets Global movement to all IP networks Rapid broadband and IP enabled device growth Increasing demand for varied, hosted communications options World s Leading Platform & Solutions Broadest feature set, proven scalability and % reliability Seamless integration with next-generation networks Worldwide market share leader Global Customer Footprint Over 500 customers in more than 65 countries 18 of 25 top service providers Top 5 North American Hosted VoIP and UC service providers Strong Growth Q1:12 revenue growth of 29% year-over-year to $38 million Q1:12 non-gaap diluted EPS of $0.29 Data source: Infonetics & Company results 4


5 Service Provider Movement to All IP is Creating a Foundation To Deliver Applications Network Modernization 4G Mobile Rollout Billions Triple Play Rollout Enterprise VoIP Network Transformation Tens of Millions of lines Hundreds of Millions Many Hundreds of Millions Application Enablement 5


6 Quick Deployment of Cloud Based Services Transformation 6

7 Units (in millions) Significant UC Growth Forecast Ahead $ B $7.0 $6.0 $5.0 $4.0 $3.0 $2.0 $1.0 $- Worldwide Hosted/Managed UC Services Market North Amer EMEA APAC Worldwide IP Phone Market 50% 45% 40% 35% 30% 25% 20% 15% 10% 5% 0% IP Hosted vs. IP PBX Line Growth Q3:10-Q3:11 46% Hosted UC 9% IP PBX Data source: Wainhouse Research, Infonetics 7 Deskphones Softphones
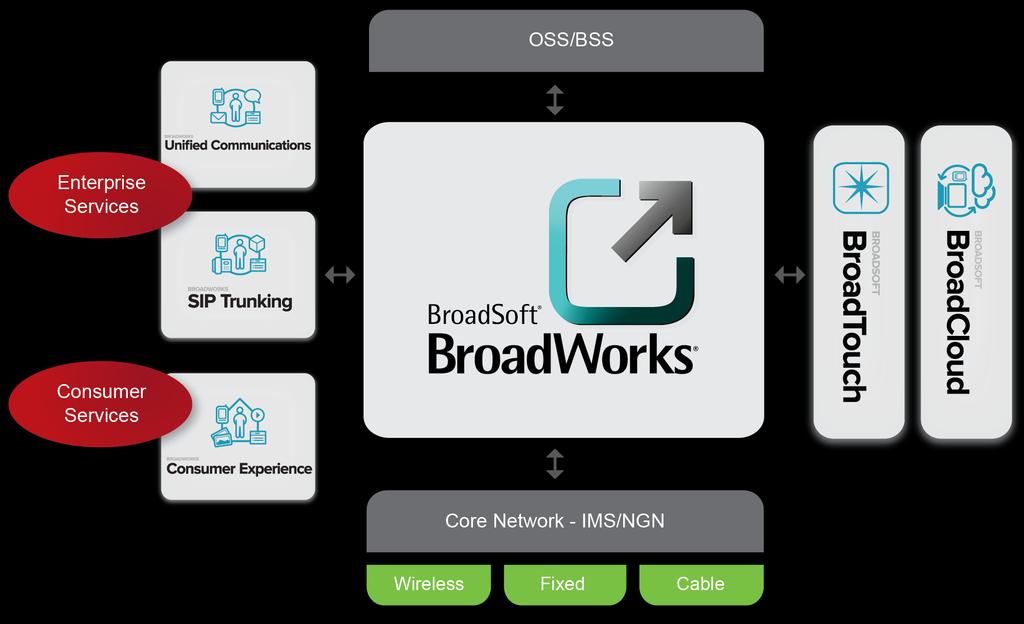

8 The BroadWorks Solution 8

9 Our Applications Application server software Software hosted by a service provider Calling, messaging and collaboration White label cloud services Cloud platform hosted by BroadSoft Services resold by service provider Android, ios, Blackberry, Mac, Windows apps On smartphones, tablets, laptops, desktops Easy to use experience


10 Our Focus on the User Experience Analyze their communication challenges Develop solutions to improve the experience Empower to communicate using their preferred service anywhere at anytime 10


11 Telstra Hosted UC Offering Target for UC offering: Multi-site enterprises Government Expanding to SMBs BroadSoft Services Hosted UC Telstra IP Telephony (TIPT) and Digital Business Microsoft OCS rollout SIP Trunking Call Center Hosted Video Conferencing 11

12 SIP Trunking Service Provider Networks SBC SBC Connects IP PBX s to a service provider s network over IP Value proposition: Enables voice and data network access consolidation Ensures business continuity Enables hybrid PBX/hosted solutions that leverage BroadWorks capabilities PBX PBX 12


13 XO SIP Trunking and Hosted UC Target: Small, mid-size & large enterprises BroadSoft Services: IP Flex - Integrated access for SMBs XO SIP - SIP trunking for SMBs XO Enterprise SIP SIP trunking for large enterprises XO Anywhere Fixed-Mobile Convergence XO Enterprise Cloud Communications Hosted UC 13


14 Consumer: Triple Play Delivery of multimedia communications services from a service provider s network and BroadSoft cloud Integrates with household devices Benefits: Complete bundle at very attractive prices Potential new cool applications Integration between wireline and wireless 14


15 France Telecom Triple Play Target: Consumers Current BroadSoft Services: Consumer Triple Play Largest IMS deployment worldwide Upcoming BroadSoft Services: Enterprise/Business Trunking (SIP) 15


16 BroadSoft Market Leadership 18 of top 25 Global Carriers Over 500 Customers in More Than 65 Countries 16


17 Growth Dimensions Additional Applications New Applications Subscriber Growth New Customers 17


")

18 Verizon UC, SIP Trunking & FiOS Triple Play Target: Consumers Small, mid-size & multinational enterprises BroadSoft Services: 2004: Hosted Unified Communications 2007: IP (SIP) Trunking 2009: FiOS Digital Voice - Consumer Triple Play 2010: FMC rollout in Europe 18


19 Functionality Best of Breed Pure Play Software Vendor High Deployments High 19

20 Why We Win Pure Application Layer Focus Independent of core switching platforms Consumer, enterprise, and mobile service offerings Rapid application delivery Carrier Grade Reliability Broadest Unified Communications Stack Continuous Innovation Reference base 18 of top 25 worldwide carriers Five 9 s reliability TL 9000 certification Call Control Collaboration: HD voice & videoconferencing, online content sharing, Instant Messaging, etc. Mobility extension Xtended BroadCloud BroadTouch BusinessLink 20


21 Right Team to Move Forward Michael Tessler President and CEO Scott Hoffpauir Chief Technology Officer James Tholen Chief Financial Officer David Bukovsky VP, Products Sam Hoffpauir VP, Engineering Leslie Ferry VP, Marketing Ken Rokoff VP, BroadCloud. Robert Weidenfeller VP, Operations Craig Decker VP, Sales EMEA Jonathan Reid VP, Sales APAC Greg Callanan VP, Sales Americas Greg Pounds VP, Cloud R&D Mary Ellen Seravalli VP, General Counsel 21
22 22 Financial Overview
23 Financial Highlights Strong momentum in Q1:12 Revenue of $38 million, 29% year over year growth Non-GAAP diluted EPS of $0.29 Substantial revenue visibility 85-90% of revenue from existing customers Significant recurring maintenance revenue base Strong balance sheet & cash flow $187 million in cash, cash equivalents and marketable securities as of March 31, 2012 Generated $3.9 million in adjusted operating cash flow 1 in Q1:12 1 Adjusted operating cash flow excludes a $6.5 million 3 rd party software pre-payment and $0.9 million final earn-out payment for the acquisition of M6. 23
 $(0.18) $0.48 $1.23 $1.")
24 Financial Performance Revenue ($mm) $138 $158- $162 $ $30 $32 $36 $41 $38 $36- $38 $96 $62 $69 Q1:11 Q2:11 Q3:11 Q4:11 Q1:12 Q2:12E Non-GAAP diluted EPS $0.18 $0.29 $0.38 $0.38 $0.29 $0.17-$ E Non-GAAP diluted EPS $(0.43) $(0.18) $0.48 $1.23 $1.22 -$


25 BroadSoft s Revenue Dynamics 2011 Geography* APAC 14% EMEA 24% Americas 62% 2011 Customer Diversity Applications Mix* 80% Customer Tiers* 70% Other Customers 60% Top 10 Customers 40% 60% 50% 40% 30% 20% 10% 31% 24% 37% 35% Hosted UC SIP Trunking Consumer 0% Tier 1 Tier 2/Cable 25 ** Hosted UC includes applications and other products * Based on Total Billings

26 Long Term Profit Model 2011 GAAP 2011 Non-GAAP* Q1:12 GAAP Q1:12 Non-GAAP** Long Term Model Gross Margin 82% 84% 79% 81% 84-85% Operating Expenses 62% 57% 66% 59% 55-56% Operating Income 20% 26% 13% 23% 28-30% * 2011 excludes stock compensation of $7.2M and amortization expense of $1.3M. ** Q1:12 excludes stock compensation of $3.2M, amortization expense of $0.6M. Note: Figures may not sum due to rounding 26
27 GAAP / Non-GAAP Reconciliation March 31, 2011 June 30, 2011 For the three months ended September 30, 2011 December 31, 2011 March 31, 2012 GAAP net (loss) income per diluted common share $ 0.13 $ 0.57 $ 0.26 $ 0.19 $ 0.06 Plus: Adjustment for preferred stock conversion Stock-based compensation expense Amortization of acquired intangible assets Non-cash interest expense on convertible notes Tax benefit related to valuation allowance release 0.01 (0.36) Non-GAAP net (loss) income per diluted common share $ 0.19 $ 0.29 $ 0.38 $ 0.38 $ 0.29 December 31, 2008 For the twelve months ended December 31, 2009 December 31, 2010 December 31, 2011 GAAP net (loss) income per diluted common share $ (1.81) $ (1.25) $ 0.32 $ (0.28) Plus: Adjustment for preferred stock conversion Stock-based compensation expense Amortization of acquired intangible assets Non-cash interest expense on convertible notes Tax benefit related to valuation allowance release Non-GAAP net (loss) income per diluted common share $ (0.43) $ (0.18) $ 0.48 $
28 28 Thank you