Combine Business Data From Cloud and On- Premise Applications for Superior Reporting, Analytics, and Business Intelligence
|
|
|
- Candace Ramsey
- 5 years ago
- Views:
Transcription


1 Combine Business Data From Cloud and On- Premise Applications for Superior Reporting, Analytics, and Business Intelligence MAY 16 & 17, 2018 CLEVELAND PUBLIC AUDITORIUM, CLEVELAND, OHIO
2 Introduction Headquarters in Atlanta, USA with international locations in the United Kingdom, Australia, and India. Oracle Platinum Partner Firm founded by a Group of former ERP Consulting Execs with a laser-like focus on Reporting and BI since Staff is frequently invited to speak at national and international conferences, on the latest industry trends and innovations. Working with clients globally across all industries. Products: ORBIT Analytics Self Service BI for any application and any data source Reporting Workbench Powerful Operational Reporting Solution for Oracle E-Business Suite Consulting: Implementations, Upgrades, Managed Services

3 Industries Served BIOTECH CONSTRUCTION MINING MANUFACTURING ELECTRONICS ENGINEERING PUBLIC SECTOR ENERGY RESTAURANTS FINANCIAL SERVICES RETAIL HIGHER ED SEMI CONDUCTOR TRANSPORTATION


4 Software Customers
5 Today s Topic Most organizations today have on-premise applications such as E- Business Suite, PeopleSoft, etc. as well as Cloud based applications such as Oracle Cloud Applications (Fusion), Taleo, Success Factors, etc. This hybrid approach creates a challenge of connecting the dots between data that spans multiple applications without expensive data warehouse solutions. This session will walk you through the steps to easily combine data from Cloud and On-Premise applications to build reports and dashboards to drive better business results.
6 Survey Research From Aon Hewitt: Six out of ten respondents (64%) are not satisfied with their current reporting tools. 86% of respondents resort to having to use Excel as their reporting tool. Source:

7 Survey Research

8 Drawbacks of not including all sources of data


9 Benefits with reporting from multiple data sources 360 Degree View of Data


10 What is Business Intelligence? Business Intelligence enables the business to make intelligent, factbased decisions Aggregate Data Present Data Enrich Data Inform a Decision Database, Data Mart, Data Warehouse, ETL Tools, Integration Tools Reporting Tools, Dashboards, Static Reports, Mobile Reporting, OLAP Cubes Add Context to Create Information, Descriptive Statistics, Benchmarks, Variance to Plan or LY Decisions are Fact-based and Data-driven

11 Data Visualization Data Visualizations allow business leaders to easily comprehend and interpret their raw data. Dashboards provide advanced interactive solutions for managers and executives to visualize relevant information for improved decisionmaking. Powerful visualization choices empower users to fully understand and act upon their data.


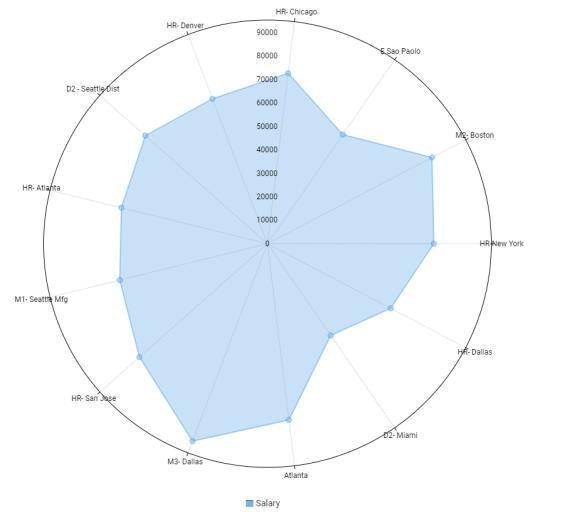
12 What do you use to understand your data? Business Intelligence uses these tools to tell a story.


13 Orbit Reporting + Analytics Introduction Orbit Reporting + Analytics A Smarter Approach to Business Intelligence A 100% web-based solution for comprehensive reporting and data analysis to help users explore, interpret, and share data to make informed business decisions.


14 Self Service Analytics User Experience Forward thinking organizations deliver high quality user experiences that engage the users. Data Driven Decision Making Improving governance and risk mitigation enabled by data driven analytics is a key organizational strategy. Operational Efficiency Increased self service access to information, and a reduced IT support results in save hundreds of thousands of dollars in technology costs..


15 Orbit Features Interactive Dashboards Enhance you decision making with simple to advanced charts and GEO-Spatial Location map Ad Hoc Reporting Take advantage of advance Ad Hoc Analysis using Data Grouping, Hierarchies, Pivots, Calculations Built-in Discoverer Conversion Utility Convert existing Discoverer reports into ORBIT Analytics Excel as Datasets Upload Excel files and produce interactive analytics right away Pre-Built Content Over 900 pre-built reports for all Oracle modules Unified On Premise & On Cloud Reporting Combine data from many sources into a single reporting platform.


16 Application Integrations E-Business Suite Fusion ORACLE E-Business Suite PeopleSoft TALEO ORACLE Fusion Salesforce
17 Data Rendering Options Dashboards Schedule / Delivery Visualizations Select a Report Pivot Analysis Report Excel Edge Open right away or schedule for later Filter data, drill to related details, out of the box! XML PDF

18 Live Demo
19 Advanced Data Modeling Physical Layer Tables/Views from disparate sources registered with ORBIT Analytics Logical Layer Physical objects organized into logical model Presentation Layer Fields and measures presented to end users for report/dashboard creation


20 Discoverer Migration Utility ORBIT has an import Utility to migrate all of your Discoverer Reports. How it works: Export EUL and Workbooks from Discoverer Convert all your Standard Objects, Custom Objects and your Complex Objects by exporting them from Discoverer and importing them into ORBIT Value Proposition Ability to extend your Discoverer Reports by converting them to ORBIT reports Dynamic data visualizations allows end users to analyze their data in a variety of output formats Import files into ORBIT


21 Live Demo Questions/Answers Contact Us: