Healthcare Analytics Design: Smart, Creative, Forward-Thinking
|
|
|
- Clarence Sparks
- 5 years ago
- Views:
Transcription

 HFMA s Patient Financial Communications")
1 Sponsored By: Healthcare Analytics Design: Smart, Creative, Forward-Thinking Wednesday February 22, 2017 (12:00 1:00 pm Pacific / 1:00 2:00 pm Mountain / 2:00 3:00 p.m. Central / 3:00 4:00 pm Eastern) HFMA s Patient Financial Communications Training Program Danyal Ibrahim, MD, MPH Chief Data & Analytics Officer
2 Agenda Analytics Journey at Saint Francis Hospital Success Stories Lessons Learned and Future Direction 2


3 Why Are We Doing This? Quality Analytics Pay For Performance BETTER COST BETTER CARE Physician Analytics Surgery Analytics Patient Flow Analytics Predicting Readmissions BETTER HEALTH Panorama 3
4 What Truly Matters: The Patient BETTER CARE BETTER HEALTH BETTER COST 4
5 Enterprise Analytics: Conceptual Framework Analytics Needs Direct Patient Care Supporting Patient Care Acute Care Post Acute Ambulatory Pop Health Revenue ERP Unit and Network Business Develop Real Time Near Real Time Big Picture Big Data Local Central 5
6 Data and Analytics Journey Data Strategy: Transform Health Data to Support Better Care, Better Health at Affordable Cost for a Lifetime Assessment Do we have the data? Is data integrated? Do we apply sound analytical methods Do we present it in a simple, intuitive and timely manner Can we identify what, who, where, towards answering why Action Steps Break the silos Build the team(s) Develop data platform Meaningful measurement metrics Harness data presentation capabilities Valid and integrated analytics Meaningful metrics Statistically sound analysis Intuitive visual presentations Actionable Timely Results 6
7 Ask the Right Questions 1. Do we have the data? 2. Is it integrated? 3. Do we apply sound statistical analysis? 4. Do we present it in a simple and meaningful way? 5. Can we identify "where" and "who" towards answering why? 6. Is it timely? Quality and Safety Patient Outcomes Processes of Care Timeliness of Care Patient Experience Operations Utilization of Resources Efficiency Capacity and Access Cost and Revenue 7
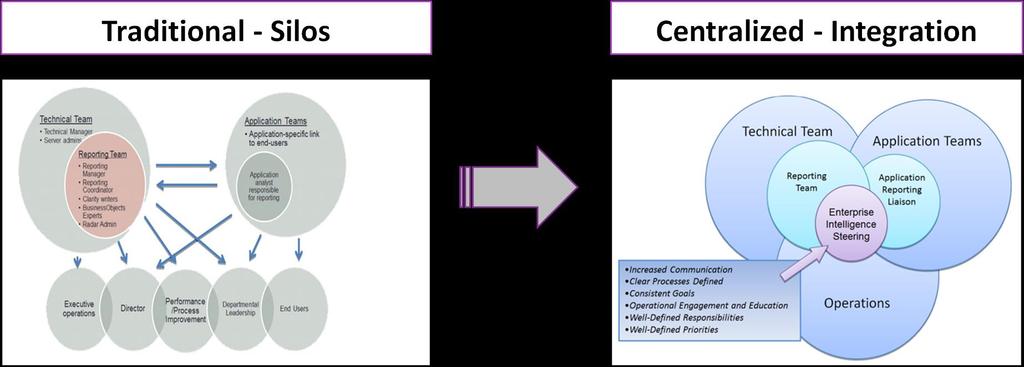
8 Data Strategy Components 1. Break data people silos 2. Build the team (Redesign) 3. Develop strong data foundation 4. Design and adopt meaningful measurement metrics 5. Harness data presentation capabilities 8
9 Data Strategy Components 1. Break the silos 2. Build the team Data as strategic asset Leadership support Data Governance Team sport Invest in essential skills 9

10 Data Governance 10

11 Team Redesign: Functional Unit 11
12 Essential Skills and Capabilities Development Capabilities Data Extraction Data Warehousing Rules Engine(s) Data Presentation Automation Security Analytics Capabilities BI Developers Interactive Data Visualizations Reporting Self-service Analyst and Liaison Skills Advanced Analytics Statistical Modeling Predictive Machine Learning Outcomes and Processes Measurement Risk Adjustment Benchmarking 12
13 Data Strategy Components 1. Break data people silos 2. Build the team 3. Develop strong data foundation Data acquisition/aggregation from various sources Data validation/standardization engine Data integration in data warehouse Solutions-based interactive visualizations 13

14 Data Platform 14
15 Data Strategy Components 1. Break data people silos 2. Build the team 3. Develop strong data foundation 4. Design and adopt meaningful measure metrics 5. Harness data presentation capabilities Role-based interactive analytics Unit-based integrated analytics Integrated KPIs dashboards Pay-for-Performance analytics PI-focused analytics 15

16 Meaningful Analytics Aid Decision Making by Care Teams 16
17 Successes along the Journey Improvement Initiatives Physicians Analytics Hospitalist Gen Surgery Quality and Safety Analytics Sepsis Readmissions Efficiency Analytics LOS Patient Flow Cost Awareness Dashboards Features Delivery Integration Function Oriented Unit-Based Service Lines Executive 17
18 Physicians Focused Analytics 18

19 Physicians Focused Analytics Hospitalist Dashboard 19

20 Physicians Focused Analytics Hospitalist Dashboard 20

21 Physicians Focused Analytics General Surgery Dashboard 21

22 Physicians Focused Analytics General Surgery Dashboard 22
23 Quality and Safety Focused Analytics 23

24 Quality Focused Analytics Readmissions Dashboard 24
25 Sepsis: The Challenge High volume ~ 1,200 patients annually High mortality rate ~ 22% High readmission rate ~ 23% High LOS ~ 11 days High cost ~ $15,000 per encounter 25

26 Sepsis: The Solution Promote evidence based excellent patient care Patient Care Areas Reduce care variation Reduce mortality Informatics Lab and Pharmacy Reduce LOS Reduce cost Analytics ED, ICU and ID New Core Measure SEP-1 effective October 2015 Education 26


27 Sepsis: Real-time Surveillance A nurse acknowledging the BPA should contact the physician as soon as possible to evaluate the patient for Sepsis. 27


28 Sepsis: Real-time Surveillance If a patient meets SIRS criteria, AND has a suspected source of infection, the physician should complete the sepsis screening form to document the suspected source. Positive SIRS plus a suspected source of infection = Sepsis 28

29 Sepsis: Analytics in the Workflow 29

30 Sepsis: Actionable Analytics 30

31 Sepsis: Near Real-time Scorecard 31

32 Sepsis: Big Picture Analytics 32


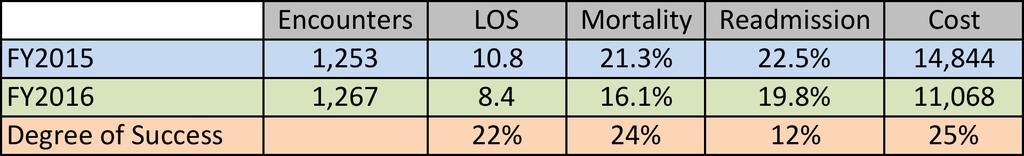
33 Sepsis: The Results 67 Saved Lives 33
34 Efficiency Focused Analytics 34
35 Patient Flow: The Challenge High excess days > 20,000 annually High boarding time > 4 hours Inefficient discharges < 15% before noon Unnecessary stay in hospital is associated with Poor patient outcome Patient experience 35

36 Patient Flow: The Solution Hospital-wide multi-disciplinary rounds focused on alleviating barriers to timely patient discharge Teamwork practice unit model with localized physician hospitalists Monitoring progress on length is stay, boarding in the ED and timely discharges 36

37 Efficiency Focused Analytics LOS and Patient Flow Dashboard 37

38 Efficiency Focused Analytics Patient Flow Dashboard 38
39 Patient Flow: The Results LOS ED Boarding Time (Hr) Discharges before noon FY % FY % Degree of Success 12.5% 34% 33% 39
40 Cost Awareness Focused Analytics 40

41 Cost Awareness Analytics Drugs Utilization Dashboards 41

42 Cost Awareness Analytics Variations in Care (Kidney Infection) 42

43 Cost Awareness Analytics Variations in Care (Kidney Infection) 43

44 Cost Awareness Analytics Variations in Care (Appendectomies) 44


45 Cost Awareness Analytics Variations in Care (Appendectomies) 45
46 Key Lessons along the Journey Alignment with organizational vision and strategy Culture, legacy and turf Engagement Leadership Staff Partners Measuring success by actions and patient-centered outcomes Quick wins and low hanging fruits Team skills 46
47 Enterprise Analytics: Future Direction Analytics Needs Direct Patient Care Supporting Patient Care Acute Care Post Acute Ambulatory Pop Health Revenue ERP Unit and Network Business Develop Real Time Near Real Time Big Picture Big Data Local Central 47

48 Future Direction 48
49 What Truly Matters: The Patient BETTER CARE BETTER HEALTH BETTER COST 49


50 Questions 50
51 To Complete the Program Evaluation The URL below will take you to HFMA on-line evaluation form. You will need to enter your member I.D. # (can be found in your confirmation when you registered) Enter this Meeting Code: 17AT4 URL: Your comments are very important and enables us to bring you the highest quality programs! 51