Exhibit 3 Load and Other Revenue Forecast
|
|
|
- Louisa Hampton
- 5 years ago
- Views:
Transcription

1 Page of Exhibit Load and Other Revenue Forecast
2 Page of 0 0 Table of Contents.. Load and Revenue Forecast Introduction Economic Overview Overview of Revenue Forecast Proposed Load Forecast Overview of Load Forecast Methodology (OEB Ref...) Customer Count Overview of Wholesale Purchases Overview of Variables Used Regression Results Determination of Customer Count Forecast Determination of Heating and Cooling Degree Days Determination of Remaining Variables Load Forecast Load Forecast by Class Final Normalized Load Forecast CDM Adjustment for the Load Forecast (OEB Ref...) Allocation of CDM Results Final Weather Adjusted Load Forecast Normalized Average Use per Customer ( NAC ) Model..... Accuracy of Load Forecast and Variance Analysis Variance Analysis of Load Forecast..... Other Revenues Overview of Other Revenue Other Revenue Variance Analysis Proposed Specific Service Charges Affiliate Service Charges... Appendix... 0
3 Page of Load and Revenue Forecast... Introduction The evidence presented in this exhibit provides information supporting the revenues derived from activities regulated by the Ontario Energy Board. Actual operating revenues from regulated operations are derived mainly from fixed and variable tariff charges as well as pass through charges and specific service charges. Hydro Inc. (NOTL Hydro) revenues are collected from five () customer classes:. Residential;. General Service less than 0 kw;. General Service 0, kw;. Unmetered Scattered Load (USL); and. Street Lighting. In this Application, NOTL Hydro requests approval of a new Large User customer class to accommodate a customer that is expected to grow beyond,000 kw in the near future. This exhibit also describes NOTL Hydro s load and customer forecasts. The load forecast methodology and assumptions are described in detail within this Exhibit. The evidence herein is organized according into the following topics;. Revenue and Load Forecast;. Accuracy of Load Forecast and Variance Analysis, and. Other Revenues 0... Economic Overview The Town of is a community in the Niagara region of Ontario. The community is located approximately one hour from Toronto. NOTL is bordered by St. Catharines to the west, Niagara Falls to the south, the Niagara River to the east and Lake Ontario to the north. The Queen Elizabeth Way (QEW) runs through the south west corner of NOTL and is the primary access. There is also a small airport which provides daily flights to Toronto as well as charter flights.
4 Page of The primary industries are agriculture, hospitality and tourism. The agricultural industry is dominated by wineries, fruit farms and greenhouses. The hospitality industry includes the White Oaks Resort & Spa, many hotels and numerous inns and bed and breakfast establishments. In addition to the above the tourism industry includes the Shaw Festival, the historic Olde Town (Capital of Upper Canada from -) and the new Outlet Mall. In addition, NOTL is home to a Niagara College campus and has a large and growing retirement community. There is almost no manufacturing in NOTL Overview of Revenue Forecast Table. below shows estimated revenues from NOTL Hydro s current 0 distribution charges applied to the 0 Test Year load forecast. Distribution Revenues are derived through a combination of fixed monthly charges and volumetric charges applied to the utility s proposed Load Forecast. Fixed rate revenues are determined by applying the current fixed monthly charge to the number of customers or connections in each of the customer classes in each month. Variable rate revenue is based on a volumetric rate applied to metered consumption or demand volume. NOTL Hydro s 0 forecasted revenues recovered through its currently approved distribution rates, and including the ICM rate rider, is projected at $,,0.
5 Page of Table.: Revenues at Current Rates Customer Class Variable Distribution Rate per Test Year Volume Gross Variable Revenue Residential $ 0.00 kwh,, $, GS < 0 kw $ 0.0 kwh,, $, GS > 0 kw $. kw, $, Large User $. kw 0,000 $, USL $ 0.00 kwh,0 $,0 Streetlighting 0. kw, $, $,, Customer Class Fixed Distribution Rate Test Year # Customers Gross Fixed Revenue Residential $., $,, GS < 0 kw $., $,0 GS > 0 kw $. $, Large User $. $,0 USL $.0 $, Streetlighting $., $ 0, $,,0 less transformer allowance $ (,) Customer Class ICM Rate Rider per Test Year Volume Gross ICM Revenue Residential $ kwh,, $, GS < 0 kw $ 0.00 kwh,, $ 0, GS > 0 kw $ 0. kw, $, Large User $ 0. kw 0,000 $ 0, USL $ kwh,0 $ $, Total 0 Distribution Revenue at Current Rates $,,0
6 Page of Forecast revenue for the 0 Test Year at the proposed rates is calculated below: Table.: 0 Forecast Revenues at Proposed Rates Customer Class Variable Distribution Rate per Test Year Volume Gross Variable Revenue Residential $ - kwh,, $ - GS < 0 kw $ 0.0 kwh,, $, GS > 0 kw $. kw, $, Large User $. kw 0,000 $, USL $ 0.00 kwh,0 $, Streetlighting.0 kw, $, $,, Customer Class Fixed Distribution Rate Test Year # Customers Gross Fixed Revenue Residential $ 0., $,, GS < 0 kw $., $,0 GS > 0 kw $. $, Large User $,. $, USL $ 0. $, Streetlighting $., $ 0, $,, $ (,) Customer Class ICM Rate Rider per Test Year Volume Gross ICM Revenue Residential $ - kwh,, $ - GS < 0 kw $ - kwh,, $ - GS > 0 kw $ - kw, $ - Large User $ - kw 0,000 $ - USL $ - kwh,0 $ - $ - Total 0 Distribution Revenue at Proposed Rates $,,
7 Page of Forecast revenue for the 0 Bridge Year at current rates is provided in Table.: Table.: 0 Forecast Revenues at Current Rates Customer Class Variable Distribution Rate per Bridge Year Volume Gross Variable Revenue Residential $ 0.00 kwh,0, $, GS < 0 kw $ 0.0 kwh,0, $, GS > 0 kw $. kw, $,0 Large User $. kw - $ - USL $ 0.00 kwh,0 $,0 Streetlighting 0. kw, $, $,0,0 Customer Class Fixed Distribution Rate Bridge Year Volume Gross Fixed Revenue Residential $., $,0, GS < 0 kw $., $, GS > 0 kw $. $,0 Large User $. - $ - USL $.0 $, Streetlighting $., $ 0,0 $,, $ (,0) Customer Class ICM Rate Rider per Bridge Year Volume Gross ICM Revenue Residential $ kwh,0, $, GS < 0 kw $ 0.00 kwh,0, $ 0, GS > 0 kw $ 0. kw, $,0 Large User $ 0. kw - $ - USL $ kwh,0 $ $, Total 0 Distribution Revenue at Current Rates $,, Table. provides a trend analysis of actual and forecast revenues: Table.: Revenue Trend Analysis ($000 s) F 0F Service Revenue $, $, $, $,0 $, $, Annual Growth -0.%.%.%.%.% The reduction in revenue in 0 is the result of the rebasing following the 0 Cost of Service application. The years 0-0 do not include the ICM rate rider as revenue as that is all
8 Page of 0 booked to the variance account. In 0, the ICM is gone and revenue includes the portion of rates required to support the transformer installed in 0. If this is backed out the growth in revenue from 0 becomes.% which is more consistent with historical growth.... Proposed Load Forecast The following section of the application covers the approach taken to determine the Load Forecast. This section also covers economic assumptions and data sources for customer and load forecasts. It explains wholesale purchases and subsequent adjustments to the wholesale purchases. It also provides the rationale behind each variable used in the regression analysis. Lastly, it presents the regression results and explains how they were used to determine the forecast for the 0 Bridge Year and the 0 Test Year. Table. below presents the actual and forecast trends for customer/connection counts, kwh consumption and billed kw demand.
9 Page of Table.: Customer and Volume Trend Table Year Residential Cust/Conn,,,,0,,,,, kwh,,0,0,,,0,,,,,,,0,,0,,, kw General Service < 0 kw Cust/Conn,,,,,,,,, kwh,,0,,,,,,0,,,0, 0,,0,0,,, kw General Service > 0 kw - kw Cust/Conn 0 kwh,,,,,,0 0,0,,,,,,0,,,,0, kw, 0, 0, 0,0,,,,, Unmetered Scattered Load Cust/Conn 0 kwh,,, 0,,0,0 0,,0,0 kw Street Lights Cust/Conn,,,,0,0,0,,, kwh,,,,,0,0,0,0,,,,, kw,,,,,,,00,, Large User Cust/Conn kwh ,0, kw ,000 Total Cust/Conn, 0,0 0, 0, 0,0,,,, kwh,0,,,,0,,,,,00 0,,0,, 0,,0,0, kw 0, 0, 0,0,,,,,,0
10 Page 0 of 0... Overview of Load Forecast Methodology (OEB Ref...) NOTL Hydro s forecast is based on a multi-variate regression model developed based on monthly wholesale purchased kwh from January 0 to December 0 as measured at the wholesale points of delivery (exclusive of losses; i.e., not loss adjusted) with the addition of the renewable generation within the NOTL Hydro service territory. The multi-variate regression model was chosen as it has a strong correlation (r-squared) and is, intuitively, the most suitable model. The methodology proposed in this application predicts wholesale consumption using a regression analysis that relates historical monthly wholesale kwh usage to monthly historical heating degree days and cooling degree days. Heating degree-day provides a measure of how much (in degrees), and for how long (in days), the outside temperature was below that base temperature. Cooling degree-day figures also come with a base temperature, and provide a measure of how much, and for how long, the outside temperature was above that base temperature. For degree days, daily observations as reported at Environment Canada s weather station at Port Weller (latitude: '00.000" N; longitude: '00.000" W, elevation.00 metres) are used. Seven years of heating and cooling data was used to match the available customer load data. The other variables used are total customer count, daylight hours, days per month, a spring/fall flag and cost of power. Each variable is discussed in detail later in this section.
11 Page of... Customer Count NOTL Hydro is projecting customer numbers to steadily increase (growth) in all customer classes as illustrated in the table below: Table.: Customer / Connection Projections Residential GS<0 kw GS>0 kw Growth Growth Year Count Rate Count Growth Rate Count Rate 0,, 0 0,.0, ,.0, ,0.0,.0.0 0,.0, ,.0, ,.0, 0..0 Geomean ,.0, ,.0, Large User USL Streetlights Growth Growth Year Count Rate Count Growth Rate Count Rate 0 -, , , , , , ,.00 Geomean Residential Customer Count Forecast NOTL Hydro operates within the Town of and serves the entire Town with the exception of around 0 customers served by neighbouring LDCs due to load transfers. Upon reviewing the latest Census data (0), Statistics Canada notes the following about Niagara-on- the-lake: , ,.0
12 Page of In 0, the enumerated population of (Town) was,, which represents a change of.% from 0. This compares to the provincial average of.% and the national average of.0%. Source: Statistics Canada 0 The growth reported by Statistics Canada is consistent with the growth seen in NOTL Hydro s residential customer count and, to a lesser degree, the growth in NOTL Hydro s General Service < 0 kw customer count. Most of is protected by the Greenbelt legislation with only the towns and villages of (Olde Town), Virgil, Glendale and St. David s available for development. Future development will therefore be largely driven by infill and small developments. This is consistent with the nature of the growth seen since 0 with two significant exceptions.

13 Page of Table.: Map of Greenbelt Designated Land in Areas in green are designated Greenbelt land with restricted development In 0/0, the Cannery Park residential development was completed. A total of residential customers were added in these two years just from this development. There are no developments of this scale planned for 0-0 or even for the next five years. As a result, a regression analysis of 0-0 overstates future growth. Forecasted growth in residential customers has been reduced to new customers each year to remove the impact of the Cannery Park development from the forecast. 0
14 Page of Table.: Forecast Residential Customers adjusted for Cannery Park Development 0 In late 0, NOTL Hydro completed the transfers of loads with its neighbouring utilities, Alectra and Niagara Peninsula Energy Inc. As a result of these load transfers, a net of residential customers were transferred to these other LDCs. The number of forecast residential customers in 0 has been reduced by these customers. GS > 0 kw Customer Count Forecast In 0, the Outlet Mall at the intersection of Glendale Avenue and the QEW was completed. The impact of this Mall had been included in our 0 Cost of Service application as an upward adjustment in our forecast. Almost, one hundred new General Service < 0 kw were added that year as each retail outlet in the Mall has its own account. Growth in commercial activities in is entirely in service sectors with growth in the retail, tourism and winery industries. There are no developments of this scale planned for 0-0 or even for the next five years. As a result, a regression analysis of 0-0 overstates future growth. Forecasted growth in GS<0 kw customers has been reduced to new customers each year to remove the impact of the Outlet Mall from the forecast.
15 Page of Table.: Forecast GS < 0 kw Customers Adjusted for Outlet Mall 0 Other Rate Classes Forecasted Customer Counts Two other adjustments have been made to the forecasted customer counts: The number of unmetered loads has been increased to to reflect the actual count in 0, The Large User class with one customer has been created in 0, The GS > 0 kw was reduced by one customer in 0 due to the transfer to the Large User class, The streetlight count is forecast to grow at the historical rate.
16 Page of... Overview of Wholesale Purchases NOTL Hydro purchases its power from the Independent Electricity Systems Operator (IESO) and from over 0 renewable energy generators located in. The following tables summarize the kwh wholesale purchases: Table.0: Wholesale kwh Purchases IESO,,,0,,,,,,0,0,, 0,, SOP,0,,,0,,,,,,,0, 0,, FIT,, 0,,0,0,000, MicroFIT,,,,,,,,,,,0,00 Total,,,,0,,0,, 0,, 0,,0 0,, Table.: Trend of Wholesale kwh Purchases NOTL Hydro s load has been steadily rising over the six year period (0 to 0) with wholesale purchases increasing by % between 0 and 0. The reduction in wholesale purchases in 0 is not the result of changes in specific customers or customer classes. Wholesale purchases were much higher than expected in 0 due to the hotter summer and where lower than expected in 0 due to cooler weather.
17 Page of The table below illustrates NOTL Hydro s billed kwh energy volume by major customer class for 0-0: Table.: 0-0 Customer Billed kwh Consumption for all three classes has risen in aggregate during the last six years. Both the residential and GS<0 kw customer classes show the weather derived drop in consumption from 0 to 0. 0 Table.: 0-0 Growth in Consumption by Class Class % Increase kwh Increase Residential.0%,00, GS<0 kw.%,,0 GS>0 kw.0%,,0 The customer class with the most growth in both percentage terms and in kwh has been the GS<0 kwh class.
18 Page of Table.: 0-0 Customer Billed kwh Average Consumption per Customer by Class 0 = Residential GS<0 kw GS>0 kw 0 The average consumption by the GS<0 kwh Customer Class is growing rather than declining and has done so every year other than in 0 which was due to the weather. The most likely explanation for this is economic growth as 0-0 have been growth years economically. Average consumption for residential customers during the same time period has fallen from kwh per month in 0 to kwh. This is consistent with trends seen across Ontario. Average consumption per customer in the GS>0 kw Customer Class will be affected by unrelated variables specific to each customer so no general conclusions can be made. No one customer in this class is large enough to have a significant impact on the average consumption.


19 Page of The chart below illustrates the monthly kwh purchases and shows the variances month-by-month over the -year period: Table.: kwh Wholesale Purchases by Month for 0-0 Purchases follow a regular monthly seasonal pattern with a general overall trend of higher purchases each year. The very high volume purchases in the summer of 0 due to the unusually hot weather stand out as an outlier Overview of Variables Used In addition to number of customers and monthly purchases of electricity, NOTL Hydro used the following factors in their analysis to estimate future demand: a) Weather (e.g. heating and cooling) which is by far the most dominant effect for most systems; b) Number of days per month; c) Daylight hours.
20 Page 0 of 0 Specifics relating to each variable used in the regression analysis are presented at the next section. a) Weather - Heating and Cooling: In order to determine the relationship between observed weather and energy consumption, monthly weather observations describing the extent of heating or cooling required within the month are necessary. Environment Canada publishes monthly observations on heating degree days (HDD) and cooling degree days (CDD) for selected weather stations across Canada. Heating degree-days for a given day are the number of Celsius degrees that the mean temperature is below C. Cooling degree-days for a given day are the number of Celsius degrees that the mean temperature is above C. For NOTL Hydro, the monthly HDD and CDD as reported at Environment Canada s weather station at Port Weller (latitude: '00.000" N; longitude: '00.000" W, elevation.00 metres) was used. NOTL Hydro has adopted the year average from 0 to 0 as the definition of weather normal in order to remain consistent with the other variables used in this analysis. The proposed normal weather methodology was chosen as the last seven years captures the impact of increasing temperatures from climate change and NOTL Hydro has no grounds for making any non-normal assumptions. 0 The following table outlines the monthly weather data used in the regression analysis. Table.: HDD and CDD as reported at Port Weller, ON. Weather Station Heating Degree Days Jan Feb Mar Apr May Jun Jul Aug Sep Oct Nov Dec
21 Page of Cooling Degree Days Jan Feb Mar Apr May Jun Jul Aug Sep Oct Nov Dec b) Number of Days per Month: NOTL Hydro also used a Days per Month variable because this identifies seasonal peaks and less/more days in calendar months. c) Customer Count Results of analysis in section... Variable captures growth in demand. d) Daylight Hours Average daylight hours per month to capture variation in demand between months due to need for lighting. e) Spring/Fall Flag. Daylight Hours Jan Feb Mar Apr May Jun Jul Aug Sep Oct Nov Dec Building on the heating/cooling days to capture the seasonality of demand across a year.
22 Page of f) Blended RPP Rates. Capturing the impact of higher and lower rates on the demand for electricity: The table below shows the sources of data used for the variables used in NOTL Hydro s Load Forecast: Blended RPP Rates Jan Feb Mar Apr May Jun Jul Aug Sep Oct Nov Dec Table.: Origin of Variables: Variable Source of Data a) Heating and Cooling Days: Environment Canada ( for Port Weller weather station b) Number of Days per Month: Used actual count of days per month for 0 to 0 c) Customer Count Actual Customer / Connection count per Customer Class d) Daylight Hours e) Spring/Fall Flag 0 for March, April, May, September October, November for January, February, June, July, August, December f) Blended RPP Rates 0 NOTL Hydro initially ran the regression analysis with only the first three variables. The result of was a % confidence level. By adding the additional variables NOTL Hydro was able to further improve the confidence level.
23 Page of... Regression Results The table below presents the regression results used to determine the load forecast: Regression Statistics Multiple R 0. R Square 0.0 Adjusted R Square 0.00 Standard Error. Observations Table.: Correlation/Regression Results ANOVA df SS MS F Significance F Regression.E+.0E+ 0.0.E- Residual.E+.E+ Total.E+ Coefficients Standard Error t Stat P-value Lower % Upper % Lower.0% Upper.0% Intercept HDD...00.E CDD E Daylight Hours # Customers E Day per Month E Spring/Fall Flag E Blended Rate
24 Page of The resulting regression equation yields an adjusted R-squared of.%. An R-squared of over 0% indicates the regression analysis is significant. The prediction formula has the following statistical results: Table.: Regression Results Statistic Value R Square.0% Adjusted R Square.% F Test. T-stats by Coefficient: a) Intercept (.) b) Heating Degree Days.0 c) Cooling Degree Days. d) Number of Days in Month. e) Customer Count.0 f) Daylight Hours -. g) Spring/Fall flag. h) Blended RPP Rate 0.0 Once a successful regression analysis has been run, the predicted wholesale purchases can be compared to the actual wholesale purchases. The table below provides this comparison. Table.0: Actual Purchased kwh versus Predicted kwh Year kwh Purchased (Actual) Forecast 0,,.00 0,0,..% 0,,0.,,..% 0,,0.,0,..0% 0,,.,,..% 0 0,,. 00,0,.0 0.% 0 0,,0.,,0..% 0 0,,. 0,0,.0.% Mean Average Percentage Error (Mape) :.% Median.% 0 To use the regression analysis to project for the 0 bridge year and the 0 test year the variables of heating and cooling days, customer counts and days in a month are required. The days in the month is a given but the other three input variables must be estimated.

25 Page of...0 Determination of Customer Count Forecast As described above, NOTL Hydro has used a simple geometric mean function to determine the forecasted number of customers for the 0 Bridge Year and 0 Test Year. However, because there were anomalies in the growth rates of several of the customer classes this calculation has had to be adjusted. The table below provides the updated forecasts with the adjusted expectations in customer growth: Table.: Customer Forecast Adjusted Forecasted Customer Counts
26 Page of Note: Number of customers / connections is based on the count at the year-end (i.e. st December). Year average customer counts have been used for this analysis. 0 Residential Customers: NOTL Hydro s residential customer count has been growing at a mean average of.% per year. This growth rate is overstated due to the Cannery Park development in 0-0 which added almost customers over what would normally be expected. The expected growth rate has been adjusted by reducing the growth rate to.%; the historical growth rate without Cannery Park. In addition, in 0, the expected growth was reduced by customers as these were transferred to Alectra under load transfer arrangements. General Service <0kW: NOTL Hydro s General Service < 0 kw class has been growing at a mean average of.% per year. This growth rate is overstated due to the Outlet Mall which opened in 0 and added almost 0 new customers over what would normally be expected. The expected growth rate has been adjusted by reducing the growth rate to.00%; the historical growth rate without the Outlet Mall. 0 General Service 0-kW: NOTL Hydro has used the geomean average of.0 to determine the expected growth of this class. However, in 0 one customer has been removed from this class and added to the newly created Large User class. Street Lighting: NOTL Hydro has used the geomean average of.0 to determine the expected growth of this class. Unmetered Scattered Load: NOTL Hydro has increased the expected Customer Count of this class to based on the actual count in early 0.
27 Page of Large User: NOTL Hydro has created a new Large User class based on the expected growth in demand from one of its customer. To adjust its model to reflect the difference between the expected customer counts based on the last six years of actual growth and NOTL Hydro s expected customer counts adjusting for nonrepeating factors over the past six years, NOTL Hydro has incorporated a Customer Count Adjustment Factor into its determination of Customer Count for the regression model Determination of Heating and Cooling Degree Days The average of the past seven years has been used to determine the heating and cooling degree days for the 0 bridge year and the 0 test year. There are no grounds to make any assumptions as to whether either of those years will be any cooler or hotter than the average. It is noted that many of the recent years have been the hottest on record due to global warming. Using seven years of data rather than ten or twenty years is more relevant in this case as would more accurately reflect the increased average temperature.... Determination of Remaining Variables Daylights hours, the Spring/Fall flag, and the number of days in the month would be unchanged in 0 and 0 from previous years. For the Blended RPP Rate the current rate has been assumed to remain in effect for the next two years Load Forecast Based on the inputs for the 0 bridge year and the 0 test year described above the resulting wholesale purchases are estimated as follows:
28 Page of Table.: Forecast Wholesale Purchases Month HDD CDD Daylight Hours # Customers Day per Month Spring/Fall Flag Blended Rate Weather Normalized 0-January ,, 0-February ,0, 0-March ,, 0-April ,, 0-May ,, 0-June ,,0 0-July ,0,0 0-August ,, 0-September ,, 0-October ,, 0-November ,,0 0-December ,, 0-January ,, 0-February ,, 0-March ,0, 0-April ,, 0-May ,, 0-June ,, 0-July ,,0 0-August ,,0 0-September ,0, 0-October ,0,0 0-November ,, 0-December ,,0 Year Forecast Purchases 0,, 0,,
29 Page of... Load Forecast by Class The wholesale purchases are allocated at this point based on historical weightings. Table.: Forecast Consumption Residential Class Residential Year Residential Metered kwh Wholesale Purchases Weather Normalized Ratio% * Weather Normal Average # Customers Per customer 0,,0,, 0,0,.%,0,, 0, 0,0,,,0,,.%,,, 0, 0,,0,,0,0,.%,,,, 0,,,,,,.%,,,0,0 0,, 0,, 00,0,.%,,0,, 0,, 0,,0,,.%,0,,, 0,0, 0,, 0,0,.%,,,,0 0,,.%,0,,, 0,,.%,0,,, Table.: Forecast Consumption GS < 0 kw Class General Service < 0 kw Year GS<0 Metered kwh Wholesale Purchases Weather Normalized Ratio% * Weather Normal Average # Customers Per customer 0,,0,, 0,0,.%,,0,, 0,,,,0,,.0%,,0,, 0,,,,0,0,.%,,0,, 0,,0,,,,.%,0,,,0 0,, 0,, 00,0, 0.% 0,,, 0, 0,0, 0,,0,, 0.0%,,0,, 0 0,,0 0,, 0,0,.%,0,0,,0 0,,.%,0,,, 0,,.%,,0,,0 0 For both residential and GS<0 kw classes the forecast loads have been weather normalized as load is influenced by variable weather significantly more than demand. The impact of this can be seen in the above comparison of historical actual purchases and weather normalized purchases. As previously mentioned, there is one customer moving from the GS>0 kw class to the Large User class. The load of this customer from 0 of,00,000 kwh, which under the regression, would not have changed too much by 0 has been removed from the 0 total volume for GS>0 kw.
30 Page 0 of To forecast demand (kw), the average of the ratio of demand to load (kw / kwh) over the seven year period has been calculated. This average has been applied to the 0 and 0 forecast loads to determine the forecast demand. Table.: Forecast Consumption and Demand GS > 0 kw Class General Service > 0 kw - kw Year kwh Adjusted kwh kwh kw Customer/ Connection kwh per connection KW per connection KW/kWh Ratio 0,,,,, 0,0.0, ,,,, 0,,00.0, ,,0,,0 0, 0,., ,0, 0,0, 0,0,., ,,,,,,., ,,,,,,., ,0,,0,,,., ,,,,,,.,.0 0,0, -,00,000,,,,.,.0 0 Avg - Years =.00,., To estimate the load for this customer a monthly demand of,000 kw was assumed. The estimates of load from this customer vary from MW to 0 MW but NOTL Hydro does not have any indication when their load will ramp up, how fast and how consistently. The MW or,000 kw is therefore the proposed load above and below which NOTL Hydro is seeking approval to establish and use a variance account to capture the revenue implications of the actual load for this customer as presented in Exhibit, section... Using the same kw/kwh ratio as calculated below for all GS>0 W customers NOTL Hydro has calculated the load for this large user customer to be,0, kwh. Table.: Forecast Consumption Large User Class Large User Year kwh Adjusted kwh kwh kw Customer/ Connection kwh per connection KW per connection KW/kWh Ratio ,0,,0, 0,000,0, 0, To convert the forecast demand into forecast consumption, the average kw/kwh ration from the GS>0 rate class from 0-0 has been used.
31 Page of In the case of Unmetered Scattered Load, the load has been determined based on the actual load as determined in early 0. Due to the increase in the number of customers this estimate was considered to be more accurate than the regression analysis. Table.: Forecast Consumption - Unmetered Scattered Load Unmetered Scattered Load Year kwh Adjusted kwh kwh kw Customer/ Connection kwh per connection KW per connection KW/kWh Ratio 0 0,, 0, ,, 0, ,, 0, , 0, 0, ,0,0 0, ,0,0, , 0,, ,0,0 0, ,0,0 0,. - - For Street Lighting, the load has been determined based on the average usage in 0-0. Most of the streetlights in have been converted to LED streetlights with a resulting significant drop in energy consumption. The average energy consumption per connection for 0-0 has been used as estimate for 0-0 as it is considered a better estimate than the regression analysis. Demand has been forecast by applying the average of the historical load to demand ratios to the forecast load.
32 Page of Table.: Forecast Load and Demand - Street Lighting Streetlighting Year kwh Adjusted kwh kwh kw Customer/ Connection kwh per connection KW per connection KW/kWh Ratio 0,,,,,, ,,,,,, ,0,0,0,0,, ,0,0,0,0,, ,,,, ,,,, ,,,00, ,,,, 0.. 0,,,, 0.. Avg - Years =
33 Page of... Final Normalized Load Forecast The table below illustrates the historical and projected Load Forecast by customer class before any adjustments for Conservation and Demand Management: Table.: Final Load Forecast (not CDM adjusted) Year Residential Cust/Conn,,,,0,,,,, kwh,,0,0,,,0,,,,,,,0,,0,,0, kw General Service < 0 kw Cust/Conn,,,,,,,,, kwh,,0,,,,,,0,,,0, 0,,0,0,,,0 kw General Service > 0 kw - kw Cust/Conn 0 kwh,,,,,,0 0,0,,,,,,0,,,,, kw, 0, 0, 0,0,,,,, Unmetered Scattered Load Cust/Conn 0 kwh,,, 0,,0,0 0,,0,0 kw Street Lights Cust/Conn,,,,0,0,0,,, kwh,,,,,0,0,0,0,,,,, kw,,,,,,,00,, Large User Cust/Conn kwh ,0, kw ,000 Total Cust/Conn, 0,0 0, 0, 0,0,,,, kwh,0,,,,0,,,,,00 0,,0,, 0,,0,,0 kw 0, 0, 0,0,,,,,,0
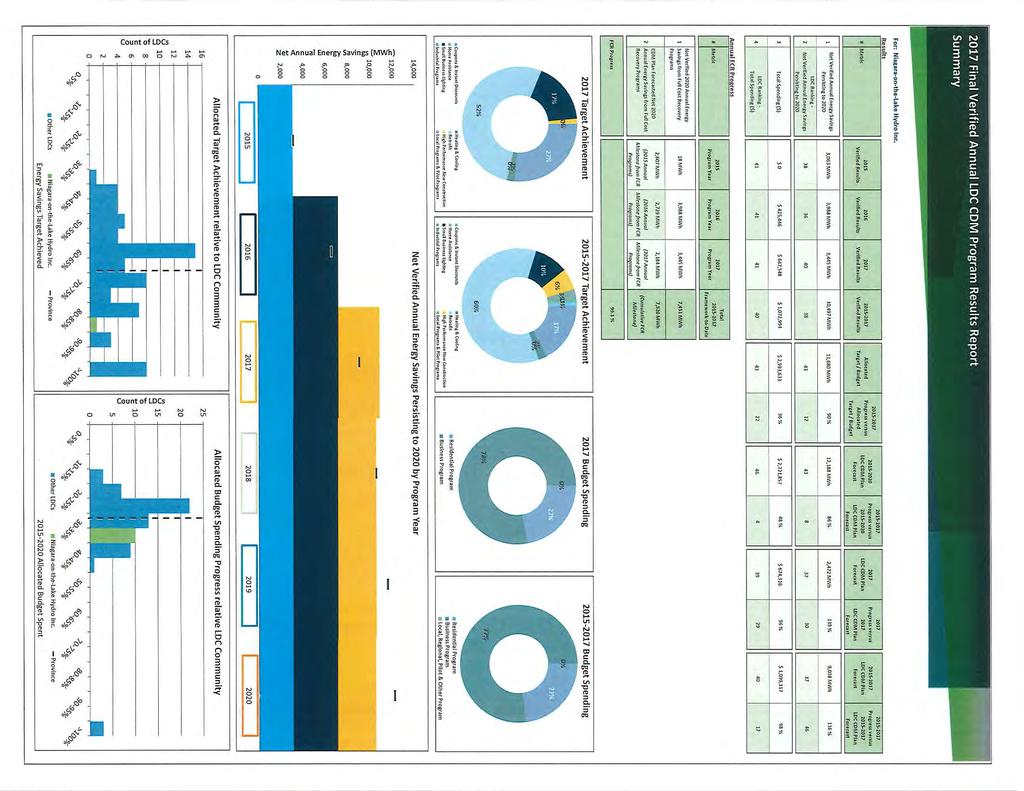
34 Page of 0... CDM Adjustment for the Load Forecast (OEB Ref...) While the forecast as presented in the previous section assumes some level of embedded natural conservation, it does not take into account the impacts on energy purchases arising from CDM programs undertaken by NOTL Hydro s customers. The load forecast is a projection of the expected level of electricity purchases that would occur over the specified period in the absence of any CDM initiatives. Therefore, in accordance with the filing requirements, the forecasted energy purchases are further adjusted to reflect CDM reductions. The schedule below provides NOTL Hydro s actual results for 0-0 and forecast results for As can be seen NOTL Hydro expects to exceed its 0-00 CDM plan. Full details of NOTL Hydro s CDM results are available in the latest report from the IESO in Appendix A. Table.0: 0-00 CDM Program Year (0-00) kwh Target:,0, Total % 0 CDM Programs.0%.%.%.%.%.% 0.% 0 CDM Programs.%.%.%.%.%.0% 0 CDM Programs.%.%.%.%.% 0 CDM Programs.%.%.%.% 0 CDM Programs.%.%.% 00 CDM Programs.0%.0% Total in Year.0%.%.% 0.%.%.0% 00.00% kwh 0 CDM Programs,,.00,,.00,,.00,0,.00,0,.00,0,0.00,,.00 0 CDM Programs,0,.00,0,.00,0,.00,0,.00,,.00 0,0,.00 0 CDM Programs,,0.00,,0.00,,0.00,,0.00,0,.00 0 CDM Programs,,.,,0.0,,.,,. 0 CDM Programs,0,.0,0,0.,0,0. 00 CDM Programs,0.,0. Total in Year,,.00,,0.00 0,,00.00,0,0.,0,0.,,.,,. Table.: Weight Factor Applied to 0-0 due to CDM Weight Factor for Inclusion in CDM Adjustment to 0 Load Forecast Weight Factor for each year's CDM program impact on 0 load forecast
35 Page of Table.: Effect of CDM Activity to be accounted for in 0 Load Forecast Total for 0 Amount used for CDM threshold for LRAMVA,0,.00,0,.00,0,.00,,.00 Amount used for CDM threshold for LRAMVA (0),,0.00,,0.0,0,.0,0,. Total Manual Forecast to Load Forecast,,0.00,,0.0,.,0,. The values entered in the 0-00 originate from the Conservation First Framework LDC Tool Kit published July, 0 which shows NOTL Hydro s target to be. GWh.
36 Page of 0... Allocation of CDM Results NOTL Hydro s CDM target is,0,000 kwh between 0 and 00. The overall CDM adjustment is shown in Table. and is calculated by: 0 to 0 are given no weighting as these CDM efforts are already built into the forecast through actual results. 0 has been given a 0% weighting based on half the CDM efforts being already incorporated but recognizing the future impact of these conservation initiatives. The 0 Bridge Year has been given a full weighting as CDM initiatives this year will have a full impact on the 0 Test year. The 0 Test Year CDM reduction is 0% as half the CDM initiatives are assumed not to have any impact in that year due to timing. The manual adjustment used for the load forecast is allocated on pro-rata basis using the 0 kwh forecast. The table below presents the pro-rata share and corresponding CDM reduction in consumption by rate class: Table.: CDM Adjustments to Load Forecast Manual Reallocation Final Adjusted (kwh) kwh Year Plan Share Target Residential kwh,0,, %,,, 0 General Service < 0 kw kwh,,0, %,,, - General Service > 0 kw - kw kwh,,,, 0%,,,0, kw,,0,0, Unmetered Scattered Load kwh,0-0% 0,0 - Street Lights kwh, - 0% 0, kw,, Large User kwh,0, - 0% 0,0, kw 0,000 0,000 Total kwh,,0,, 00%,, -,0, Total KW,0,0
37 Page of... Final Weather Adjusted Load Forecast The table below provides details of the Final Customer and Volume Load Forecast for each of the years. This summary of the billing determinants by rate class has been used to develop NOTL Hydro s proposed rates: Table.: Final Customer and Volume Load Forecast Year Residential Cust/Conn,,,,0,,,,, kwh,,0,0,,,0,,,,,,,0,,0,,, kw General Service < 0 kw Cust/Conn,,,,,,,,, kwh,,0,,,,,,0,,,0, 0,,0,0,,, kw General Service > 0 kw - kw Cust/Conn 0 kwh,,,,,,0 0,0,,,,,,0,,,,0, kw, 0, 0, 0,0,,,,, Unmetered Scattered Load Cust/Conn 0 kwh,,, 0,,0,0 0,,0,0 kw Street Lights Cust/Conn,,,,0,0,0,,, kwh,,,,,0,0,0,0,,,,, kw,,,,,,,00,, Large User Cust/Conn kwh ,0, kw ,000 Total Cust/Conn, 0,0 0, 0, 0,0,,,, kwh,0,,,,0,,,,,00 0,,0,, 0,,0,0, kw 0, 0, 0,0,,,,,, Normalized Average Use per Customer ( NAC ) Model NOTL Hydro did not use the Normalized Average Use per Customer ( NAC ) Model as the multivariant regression analysis yielded a strong correlation and is considered the superior tool for this type of analysis. 0.. Accuracy of Load Forecast and Variance Analysis... Variance Analysis of Load Forecast As per section.. of the OEB Filing Requirements Applicants must demonstrate the historical accuracy of the load forecast approach. NOTL Hydro has provided revenue, customer/connection
38 Page of count by rate class and total system load in kwh and variances. Appendix -B is also provided as part of the Chapter Appendices with its analysis. The table below shows the yearly change in consumption and distribution revenue for the Residential class: 0 Table.: Residential Variance Average kwh Year Customers # Change % Change kwh* % Change / Customer / Month Distribution Revenue** % Change 0,,,0 $,, 0,.%,0, 0.% $,,.% 0,.%,,0.% $,,.0% 0,0.%,, 0.% 0 $,,00-0.% 0 Board Approved,0 () -0.%,,0 -.% $,, -0.% 0,.%,,.% $,0,.% 0,.%,,.% 0 $,,0.% 0,.%,0, -.% $,,0.% 0 - Bridge,.%,0,.% $,,.% 0 - Test,.%,0,.% $,,.% Average.%.%.% * 0 and 0 kwh are weather normalized and do not include CDM adjustments ** Includes Service Charge and and Variable Distribution Rate The residential customer class count has been growing steadily since 0 at a rate of.% per annum. As discussed above, this growth rate is inflated by the Cannery Park development in 0 and 0. Once this is adjusted for the growth rate becomes an average of.%. In 0, NOTL Hydro lost residential customers to Alectra as part of a load transfer. 0 The residential consumption has been growing less slowly at.% per annum as our residential customers have become more efficient in their use of electricity. This is consistent with the pattern seen across Ontario. 0 was substantially higher than would otherwise have been expected due to warmer weather. Distribution revenue has been growing quicker than both number of customers and kwh load as it also reflects changes in rates. The table below shows the yearly change in consumption and distribution revenue for the General Service <0 kw class:
39 Page of 0 Table.: General Service < 0kW Variance Average kwh Year Customers # Change % Change kwh* % Change / Customer / Month Distribution Revenue** % Change 0,,,0, $,, 0,.%,,.%, $,,.% 0, - -.%,, -0.%,0 $,0, -.% 0,.%,,0.%, $,0, -.% 0 Board Approved, - -.%,0, -.%,0 $, -.% 0, 0 0.%,,.%, $,0,0.% 0, 0.%,0,.%, $,,.% 0, - -0.% 0,,0 -.%, $,00, -.% 0 - Bridge, 0.%,0,.%, $,0,0.% 0 - Test, 0.%,,0.%, $,0,0.% Average.0%.% 0.% * 0 and 0 kwh are weather normalized and do not include CDM adjustments ** Includes Service Charge and and Variable Distribution Rate The number of customers in the GS<0 kw class has been slowly increasing with the exception of the large increase in 0 due to the opening of the Outlet Mall. Excluding the Outlet Mall, growth has been around customer a year though for the forecast new customers each year has been assumed. The actual number of customers also varies from year to year due to customers shifting to and from the GS>0 kw rate class depending on demand. Consumption has been growing at a strong rate at almost % due to the addition of the Outlet Mall and the increase in average consumption per customer. NOTL Hydro believes the growth in the Ontario economy and tourist traffic in has been the reason for this. Distribution revenue for this class has only slightly increased despite the growth in number of customers and kwh load. This is due to the decrease in rates during this time period. In 0, the fixed and variable rates were $. and $0.0 respectively while in 0 the fixed rate has decreased to $. and the variable rate to $0.. 0 The table below shows the yearly change in consumption and distribution revenue for the General Service 0-,kW class:
40 Page 0 of Table.: General Service 0-,kW Variance Average kwh Year Customers # Change % Change kw* % Change / Customer / Month Distribution Revenue** % Change 0 0, $, % 0,.% $, 0.% % 0, 0.% $,0.0% 0.% 0,0.% $,0 -.0% 0 Board Approved - -.% 0, -.% $,0 -.% %,.% $ 0,0.% %, -.% $, -.% 0.%, 0.% $,.% 0 - Bridge.%,.% $,.% 0 - Test 0 0.%, -.% $,00,0.% Average.%.% 0.% * 0 and 0 kw do not include CDM adjustments ** Includes Service Charge and and Variable Distribution Rate 0 The customer count for the GS>0 kw class has grown very slowly at an average of one customer per year. Most of this growth is also accounted for by the addition of the larger outlets in the Outlet Mall. has almost no industry so growth in this class is driven by growth in service industries such as retail, wineries and hotels. Year to year variations are also affected by customers shifting to the GS<0 kw class and vice versa. Consumption has also been growing slowly. These customers have been the biggest beneficiaries of NOTL Hydro s conservation services. Average use per customer has been steady with the forecast decline in 0 solely due to the transfer of the one customer to the Large User class with a resulting drop in consumption of,00,000 kwh. Distribution revenue increases in the test year due to proposed rate changes. When compared to 0, the number of customers has increase by. In 0, the fixed and variable rates were $. and $. respectively while in 0 the fixed rate has decreased to $. while the variable rate has increased to $.. The 0 revenue also reflects the impact of the transfer of the one customer to the large user class.
41 Page of The table below shows the yearly change in consumption and distribution revenue for the Large User class: Table.: Large User Variance Average kwh Year Customers # Change % Change kw* % Change / Customer / Month Distribution Revenue** % Change 0 - Test 00.0% 0, %,000 $, 00.0% * 0 and 0 kw do not include CDM adjustments ** Includes Service Charge and and Variable Distribution Rate 0 The Large User class is a new class NOTL Hydro is proposing to create based on growth intentions provided by our largest and fastest growing customer. This customer has invested significantly to upgrade their electrical capabilities including paying for a largely dedicated feeder line. They are also substantially expanding their premises and production. As NOTL Hydro does not have a reliable forecast for consumption or demand the forecast above has been created assuming a,000 kw a month demand. NOTL Hydro is proposing a variance account to capture the revenue implications of actual demand above or below this level. As a result of this variance account, the benefit of the expansion to,000 kw is captured in rates of all customers and the variance account will provide further benefits if demand exceeds the,000 kw.
42 Page of Table.: Street Lighting Variance Average kwh Year Connections # Change % Change kw* % Change / Customer / Month Distribution Revenue** % Change 0,, 0 $,0 0, 0.0%, 0.% 0 $,.0% 0, 0.%, 0.% 0 $, 0.% 0,0 0.%, -0.% 0 $,.% 0 Board Approved, %,.% 0 $, 0.% 0,0.%, -.% 0 $, -.0% 0,0.%, -.% 0 $, -0.% 0, 0.%,00.% 0 $,0.0% 0 - Bridge,.%,.% 0 $,0.% 0 - Test,.%,.% 0 $, -.% Average.% -.0%.% * 0 and 0 kw do not include CDM adjustments ** Includes Service Charge and and Variable Distribution Rate The number of streetlights has been growing but not consistently as it is based on new developments within. NOTL Hydro used the historical rate of increase to forecast and increase of streetlights for 0. Streetlight consumption has fallen significantly due to the installation of LED streetlights in 0-0. NOTL Hydro also supported this with a CDM payment of over $00k. Distribution revenue will decrease significantly in 0 due to a change allocation of costs as per the OEB letter dated June, 0 (EB-0-0). 0 Table.0: Unmetered Scattered Load Average kwh Year Customers # Change % Change kwh* % Change / Customer / Month Distribution Revenue** % Change 0, 0 $, %, 0.% $, 0.% %,.% $, -.0% 0 0.% 0, -.% $, -.% 0 Board Approved 0.% 0,.% 0 $,.% %,0 -.% $, -.% %,0-0.%,0 $, -.% 0 0.0% 0,.% $,.% 0 - Bridge.%,0 0.% 0 $,.% 0 - Test 0 0.0%,0 0.0% 0 $,.% Average.%.% -.% * 0 and 0 kwh are weather normalized and do not include CDM adjustments ** Includes Service Charge and and Variable Distribution Rate NOTL Hydro has a small number of Unmetered Scattered Load Accounts that provide a small amount of revenue. The revenue from this class is expected to remain consistent in 0 and 0.
43 Page of 0.. Other Revenues... Overview of Other Revenue Other Distribution Revenues are revenues that are distribution related but are sourced from means other than distribution rates. For this reason, other revenues are deducted from NOTL Hydro s proposed Revenue Requirement. Further details on the derivation of the Revenue Requirement are presented at Exhibit. Other Distribution Revenues includes items such as: Specific Service Charges Late Payment Charges Other Distribution Revenues Other Income and Expenses
44 Page of Other Operating Revenues A detailed breakdown of Other Operating Revenue by USoA account is shown in the table below. These balance are consistent with those shown in Appendix -H: Table.: Specific Service Charges Actual Actual Actual 0 Forecast Forecast Forecast CGAAP CGAAP MIFRS MIFRS MIFRS MIFRS MIFRS (new rates) Total Total Total Total Total Total Total Specific Service Charges Misc Revenue - microfit service charge $,.0 $,.0 $,.0 $,.0 $,.0 $,.0 $,0.00 Misc Revenue Meter Reading $0.00 $.00 $0.00 $0.00 $0.00 $0.00 $0.00 Misc Revenue Account History $0.00 $.00 $0.00 $0.00 $0.00 $0.00 $0.00 Misc Revenue Stale Dated Cheques ($,.00) $0. $0. $0.00 $0.00 $0.00 $0.00 Misc Rev Suppliers Dicounts $. $0. $,. $. $. $. $. Misc Revenue Bank & Clerical Errors $0.00 $0.0 $0.00 $0.00 $0.00 $0.00 $0.00 FIT charge $,. $,.00 $,.0 $,.0 $,0. $,0. $,0. Arrears Certificate $. $. $.00 $.00 $. $. $. Statement of Account $0.00 $0.00 $0.00 $0.00 $0.00 $0.00 $0.00 Pulling post-dated cheques $0.00 $.00 $.00 $.00 $.00 $.00 $.00 Duplicate invoices for previous billing $0.00 $0.00 $0.00 $0.00 $0.00 $0.00 $0.00 Request for other billing information $0.00 $0.00 $0.00 $0.00 $0.00 $0.00 $0.00 Easement Letter $.00 $0.00 $0.00 $0.00 $.0 $.0 $.0 Account history $.00 $0.00 $00.00 $.00 $0.00 $0.00 $0.00 Credit reference/credit check (plus credit agency costs) $,0.00 $0.00 $,. $0.00 $.0 $.0 $.0 Returned Cheque charge (plus bank charges) $,0.00 $,. $,00.00 $.00 $,.0 $,.0 $,.0 Charge to certify cheque $0.00 $0.00 $0.00 $0.00 $0.00 $0.00 $0.00 Account set up charge / change of occupancy charge $,0.00 $,0.00 $,0.00 $,00.00 $,.0 $,.0 $,.0 Special Meter reads $0.00 $0.00 $0.00 $0.00 $0.00 $0.00 $0.00 Meter dispute charge plus Measurement Canada fees (if meter found correct) $0.00 $0.00 $0.00 $0.00 $0.00 $0.00 $0.00 Collection of account charge no disconnection $,0.00 $,0.00 $,0.00 $0,0.00 $,.0 $,.0 $,.0 Disconnect/Reconnect at meter during regular hours $,0.00 $,00.00 $,0.00 $,.00 $,. $,. $,. Disconnect/Reconnect at meter after regular hours $0.00 $.00 $0.00 $0.00 $0.00 $0.00 $0.00 Disconnect/Reconnect at pole during regular hours $.00 $0.00 $.00 $,0.00 $.00 $.00 $.00 Disconnect/Reconnect at pole after regular hours $0.00 $0.00 $0.00 $0.00 $0.00 $0.00 $0.00 Service call customer-owned equipment $0.00 $0.00 $0.00 $0.00 $0.00 $0.00 $0.00 Service call after regular hours $0.00 $0.00 $0.00 $0.00 $0.00 $0.00 $0.00 Install / remove load control device during regular hours $0.00 $0.00 $.00 $.00 $0.00 $0.00 $0.00 Install / remove load control device after regular hours $0.00 $0.00 $0.00 $0.00 $0.00 $0.00 $0.00 Temporary service install and remove overhead no transformer $0.00 $0.00 $0.00 $0.00 $0.00 $0.00 $0.00 Temporary service install and remove underground no transformer $0.00 $0.00 $0.00 $0.00 $0.00 $0.00 $0.00 Temporary service install and remove overhead with transformer $0.00 $0.00 $0.00 $0.00 $0.00 $0.00 $0.00 MARKUP $,. $,00. $,. $,. $,. $,. $,. Total Specific Service Charges $,. $,. $0,. $,. $,. $,0. $,.
45 Page of Table.: Late Payment Charges Actual Actual Actual 0 Forecast Forecast Forecast CGAAP CGAAP MIFRS MIFRS MIFRS MIFRS MIFRS (new rates) Total Total Total Total Total Total Total Late Payment Charges Late Payment - per month $,0. $0,0. $,. $,. $,. $,. $,. Total Late Payment Charges $,0. $0,0. $,. $,. $,. $,. $,. Table.: Other Distribution Revenue Actual Actual Actual 0 Forecast Forecast Forecast CGAAP CGAAP MIFRS MIFRS MIFRS MIFRS MIFRS (new rates) Total Total Total Total Total Total Total Other Distribution Revenue Retailer Service Agreement -- monthly fixed charge (per retailer) $,.0 $,.0 $,.00 $,0.0 $,0.0 $,0.0 $,0.0 Service Transaction Request - request fee,per request, applied to the requesting party $.0 $. $. $. $. $. $. Standard Supply Service -- Administrative Charge - Residential $,0. $,0. $,. $,. $,. $,. $,. Standard Supply Service -- Administrative Charge - USL $.0 $. $. $.0 $.00 $.00 $.00 Standard Supply Service -- Administrative Charge - Streetlights $. $.0 $. $.0 $.00 $.00 $.00 Standard Supply Service -- Administrative Charge - GS<0 $,. $,. $,. $,.0 $,00.00 $,0.00 $,0.00 Standard Supply Service -- Administrative Charge - GS>0 $. $. $.0 $0. $. $.00 $.00 Standard Supply Service -- Administrative Charge - Large User $0.00 $0.00 $0.00 $0.00 $0.00 $.00 $.00 Specific Charge for Access to the Power Poles per pole/year $,.0 $,0.0 $,0. $,. $,. $,. $,. ROOM RENTAL P.O.P. SITE $,. $,00. $,. $,. $,. $,. $,. ROOF RENTAL FIT $0.00 $0.00 $0.00 $,00.00 $,00.00 $,00.00 Deferred Revenue Recognized (IFRS) $0.00 $0.00 $,0. $,. $,0. $,. $,. Total Other Distribution Revenues $0,0. $0,0. $,. $,0.0 $0,. $0,. $0,.
46 Page of Table.: Other Income and Expenses Actual Actual Actual 0 Forecast Forecast Forecast CGAAP CGAAP MIFRS MIFRS MIFRS MIFRS MIFRS (new rates) Total Total Total Total Total Total Total Other Income and Expenses Regulatory Debit ($,.) -$,0. $0.00 $0.00 $0.00 $0.00 $ CGAAP Accounting Changes ($,0.) -$,. -$00,. -$,. -$,. -$,. $0.00 REVENUE FROM JOBS $,0. $0,. $,. $,. $,. $,. $,. PROFIT/LOSS ON INVESTMENT $,.00 $,.00 $,.00 $,.00 $0.00 $0.00 $0.00 GAIN ON DISP OF PROPERTY ($,0.) $0.00 $0.00 $,. $0.00 $0.00 $0.00 Loss on Disposal of Property $0.00 $0.00 $0.00 -$,0. $0.00 $0.00 $0.00 REVENUES NON-UTILITY OPERATIO $,. $,. $0.00 $0.00 $0.00 $0.00 $0.00 EXPENSES NON-UTILITY OPERATIO ($,.) $0.00 $0.00 $0.00 $0.00 $0.00 $0.00 CDM REV $0.00 $,. $,. $,. $00, $00, $00, CDM EXP $0.00 -$,. -$,. -$,.0 -$00, $00, $00, MISC INCOME SALE OF SCRAP $,.0 $0.00 $,.0 $,0.0 $,0.0 $,0.0 $,0.0 MISC INCOME ADMIN EXP RECOVER $,. $,. $,. $,. $,. $,. $,. INT & DIV INCOME MISCELLANEOUS $0.00 $,. $,. $0.00 $0.00 $0.00 $0.00 INT & DIV INCOME CIBC T-BILLS $0.00 $0.00 $0.00 $,0. $,0. $,0. $,0. INT & DIV INCOME CIBC -0 $,0. $,0.0 $,. $,. $,. $,. $,. $0.00 Total Other Income and Expenses ($,.) $,. $,0. -$,. -$,0. -$,. $0,.00 Total Other Revenue -$,. $,. $,. $,. $,. $,. $0, Other Revenue Variance Analysis The tables below provide year over year variances of other operating revenues. Due to the high number of individual accounts only the summary level of balances are provided with written explanations as to the cause of the variance. The details are the same as those provided above: Table.: Variance Analysis of Other Operating Revenues: 0 Board Approved to 0 Actual Board Approved Actual CGAAP CGAAP 0 0 $ Variance % Variance Specific Service Charges $,0 $, $ (,) -% Late Payment Charges $,000 $,0 $,0 % Other Distribution Revenue $, $ 0,0 $ (,) -% Other Income and Expenses $,00 $ (,) $ (,) -% 0 Total $, $ (,0) $ (,) -% Actual Service Charge revenue was lower than the approved amount due to a debit of $k due to reversing stale dated cheques that had been written-off to revenue in 0. Late Payment revenue was higher as the number of late payment accounts was higher than expected. This will vary from year to year based on customer behavior. Other Distribution Revenue is largely as Board approved. The variation in Other Income and Expenses is entirely due to the Regulatory
47 Page of Debit (Account ) and CGAAP Accounting Changes (Account 0-); otherwise the revenue was as Board approved. The CGAAP Accounting Change was the expense booked to offset the reduction in the depreciation expense from lengthening the expected life of many of the assets under IFRS until the new rates came into effect: Table.: Variance Analysis of Other Operating Revenues 0 to 0 Actual Actual CGAAP CGAAP 0 0 $ Variance % Variance Specific Service Charges $, $, $, % Late Payment Charges $,0 $ 0,0 $, % Other Distribution Revenue $ 0,0 $ 0,0 $ 0% Other Income and Expenses $ (,) $, $, -0% 0 Total $ (,0) $, $, -0% The increase in Specific Services revenues is the lack of the $k write-off in 0. Late payment charges fluctuated significantly upward for no reason other than customer behavior. Other Distribution Revenue was unchanged. Significant changes in Other Income and Expenses included a $k reduction in the Regulatory Debit (Account ) and CGAAP Accounting Changes (Account 0-); the removal of water billing services to an affiliated company as it had a loss of $0k in 0 and $k of CDM revenue. Table.: Variance Analysis of Other Operating Revenues 0 to 0 Actual Actual CGAAP CGAAP 0 0 $ Variance % Variance Specific Service Charges $, $ 0,0 $, % Late Payment Charges $ 0,0 $, $,0 % Other Distribution Revenue $ 0,0 $, $, % Other Income and Expenses $, $, $, % 0 Total $, $, $, % The increase in Specific Service Charges is due to the increase in collection charges which grew by $,0 due to an increase in the number of charges from to. Late payment charges fluctuated significantly upward for no reason other than customer behavior. Other Distribution
48 Page of Revenue grew by Deferred Revenue of $k which is the amortization of contributed capital under IFRS. Other Income and Expenses had the following significant variations: Table.: Variance Analysis of Other Income and Expenses 0 to 0 Variation (000 s) Cause $0 Increase in job revenue with close of Outlet Mall job -$ Increase in CGAAP adjustment for change in depreciation -$ Lower net CDM revenue in 0 vs 0 $ Higher mark-to-market valuation on interest rate swaps $ No regulatory debit in 0 $ Other $ Total Variation Table.: Variance Analysis of Other Operating Revenues 0 to 0 Actual Actual CGAAP CGAAP 0 0 $ Variance % Variance Specific Service Charges $ 0,0 $, $, % Late Payment Charges $, $, $ (,) -0% Other Distribution Revenue $, $,0 $,0 % Other Income and Expenses $, $ (,) $ (,) -0% 0 Total $, $, $ (,) -% No significant change in Specific Service Charges. Late payment charges fluctuated significantly downward for no reason other than customer behavior. Other Distribution Revenue grew due to growth in Deferred Revenue of $k. Other Income and Expenses had the following significant variations: Table.0: Variance Analysis of Other Income and Expenses 0 to 0 Variation (000 s) Cause -$0 Job revenues returned to normal annual levels $ Increase in CDM revenue -$ Increase in CGAAP adjustment for change in depreciation -$ Lower mark-to-market valuation increase on interest rate swaps -$ Loss on disposal of load transfer assets -$ Other $- Total Variation
49 Page of Table.: Variance Analysis of Other Operating Revenues 0 to 0 Bridge Year Actual Forecast CGAAP CGAAP 0 0 $ Variance % Variance Specific Service Charges $, $, $ (,0) -% Late Payment Charges $, $, $, 0% Other Distribution Revenue $,0 $ 0, $, % Other Income and Expenses $ (,) $ (,0) $ (,0) % Total $, $, $ (,0) -% Specific Service Charges are lower due to an expected drop in connection charges of $k based on average connection charges since 0. Late payment Charges are expected to increase by $K based on average connection charges since 0. Other Distribution Revenue is expected to remain largely unchanged with the exception of continued growth in Deferred Revenue. Other Income and Expenses had the following significant variations: 0 Table.: Variance Analysis of Other Income and Expenses 0 to 0 Variation (000 s) Cause -$ Lower net CDM revenue as none assumed for 0 -$ Increase in CGAAP adjustment for change in depreciation -$ No gains or losses on assets sales or swap mark-to-market assumed $ Other $- Total Variation Table.: Variance Analysis of Other Operating Revenues 0 Bridge Year to 0 Test Year Forecast Forecast CGAAP CGAAP 0 0 $ Variance % Variance Specific Service Charges $, $, $,0 % Late Payment Charges $, $, $ - 0% Other Distribution Revenue $ 0, $ 0,0 $ 0, % Other Income and Expenses $ (,0) $ 0, $, -% Total $, $ 0, $ 0,0 % Specific Service Charges are higher due to a proposed increase in the monthly charge for MicroFIT contracts from $.0 to $0.00. Late payment Charges are expected to remain constant. Other Distribution Revenue is $0k higher due to the OEB approved increase in pole connection costs to $. per pole and $k higher due to continued growth in Deferred Revenue. Other Income and Expenses is $k higher as the CGAAP Accounting Change has been removed as
50 Page 0 of 0 this rate rider and accounting adjustment will no longer be necessary after this cost of service application.... Proposed Specific Service Charges NOTL Hydro proposes to change the current monthly Service Charge for the utility s MicroFIT customer class to $0.00 per month. NOTL Hydro incurs a $.00 monthly fee per MicroFIT meter point from the utility s settlement provider, UtiliSmart. This $.00 per month per MicroFIT meter point settlement fee pays for the collation of daily interval -minute data and calculating the total kwh generated that needs to be deducted from IESO kwh purchases. As the settlement cost is a recoverable expense, in NOTL Hydro s opinion, the cost for this specific charge associated with MicroFIT data should be recovered directly from the MicroFIT rate class. The remaining $.00 is required to pay for the labour required to prepare and send the monthly statements, prepare and remit the monthly payments and make changes to the MicroFIT accounts as requested from time to time. A number of LDCs have received approval for a $0.00 or higher monthly MicroFIT fee including St. Thomas Energy Inc., Wellington North Power Inc. and Centre Wellington Hydro Ltd. 0 NOTL Hydro proposes that this charge should be passed onto the utility s MicroFIT customers effective from May, 0. NOTL Hydro is also proposing to amend the following current Specific Service Charges: Table.: Proposed Specific Service Charges Specific Service Charge Current Charge Proposed Meter dispute charge plus meter testing fees (if meter found correct) $0.00 $0.00 Disconnect/Reconnect at meter during regular hours $.00 $.00 Disconnect/Reconnect at meter after regular hours $.00 $.00 Disconnect/Reconnect at pole after regular hours $.00 $0.00 Install / remove load control device during regular hours $.00 $.00 Install / remove load control device after regular hours $.00 $.00 Service call after regular hours $.00 $.00
51 Page of It should be noted that other than the charge for Disconnect/Reconnect at meter during regular hours, for which the incremental revenue from the change is $,0, these charges are almost never incurred by our customers. NOTL Hydro does not currently use load control devices and in the period from 0-0 did not charges any customers for meter disputes, after hours service calls or after hour disconnects/reconnects at the pole. Nevertheless, NOTL Hydro believes it is important that posted charges fairly reflect the costs to be incurred by NOTL Hydro should these services be requested in the future. Table.: Determination of Proposed Specific Service Charges Staff / Truck Rate # Hours Calculation Proposed Fee Meter dispute charge plus meter testing fees (if meter found correct) Sr. Technologist $. Service Truck $. $. $0.00 Disconnect/Reconnect at meter during regular hours Sr. Technologist $. Service Truck $. $. $.00 Disconnect/Reconnect at meter after regular hours Journeyman Lineman $. Service Truck $. $. $.00 Disconnect/Reconnect at pole after regular hours Lead hand $. Journeyman Lineman $. Line Truck $. $.0 $0.00 Install / remove load control device during regular hours Sr. Technologist $. Service Truck $. $. $.00 Install / remove load control device after regular hours Journeyman Lineman $. Service Truck $. $. $.00 0 Service call after regular hours Journeyman Lineman $. Service Truck $. $. $.00 NOTL Hydro proposes that these updated Specific Service Charges come into effect May, 0. There are no discrete customer groups that will be materially affected by these changes.
52 Page of... Affiliate Service Charges NOTL Hydro has two affiliates; Energy Inc. (NOTL Energy) and Energy Services Niagara Inc. (ESNI). NOTL Energy is a holding company that has no active operations or revenue. Its only expenses are those it directly incurs as a corporate entity: corporate insurance and auditor charges for the preparation of the annual tax return. 0 ESNI is a subsidiary of NOTL Energy and a sister company to NOTL Hydro. The non-regulated activities of NOTL Energy are conducted within ESNI. During the period from 0-0 these have included: a water heater rental business, water billing services on behalf of the Town of and solar generation. ESNI has no direct employees so all services supplied by NOTL Hydro staff are billed to ESNI on a cost plus basis. The following is a breakdown of the services supplied to ESNI by year: Table.: Services to ESNI (0-0) Year: 0 Shared Services Name of Company Price for the Cost for the % Allocation Pricing Service Offered Service Service Methodology From To $ $ Hydro Inc Energy Services Inc Water Billing- Customer Service- Billing/collecting/Account Inquiries/Reports/Water reads Cost-Base $,. Service Cost is marked up as follows: Labour 0%, Truck 0%, Material 0%, Contractor 0% Accounts $,. Paybale Misc 0% Hydro Inc Energy Services Inc Gas Water Heaters- Finance-Accounts Payable/Receivable,Account Reconcilations, Payroll Cost-Base $,. Service Cost is marked up as follows: Labour 0%, Truck 0%, Material 0%, Contractor 0% Accounts $,0. Paybale Misc 0% Hydro Inc Energy Services Inc Electric Water Heaters- Finance-Accounts Payable/Receivable, Account Reconcilations, Payroll Cost-Base $,. Service Cost is marked up as follows: Labour 0%, Truck 0%, Material 0%, Contractor 0% Accounts $,. Paybale Misc 0% Hydro Inc Energy Services Inc Water Bills- Printed/Cancelled bills Cost-Base $,. # of bills printed/cancelled * proportion related to $,0.0 water bills* cost of bill print plus 0% mark-up Hydro Inc Energy Services Inc Adminstrative Expenses- Mtce General Plant, Property Taxes, Property Insurance Cost-Base $,. 0.0% on mtce of building, property taxes, property $,. insurance plus 0% mark-up Hydro Inc Energy Services Inc Board Of Directors-Payroll Cost-Base $,00.00 $,00.00 members x $0 $00 per meeting
53 Page of Year: 0 Shared Services Name of Company Price for the Cost for the Allocation Pricing Service Offered Service Service Methodology From To $ $ Hydro Inc Energy Services Inc Water Billing- Customer Service- Billing/collecting/Account Inquiries/Reports/Water reads Cost-Base $,. Service Cost is marked up as follows: Labour 0%, Truck 0%, Material 0%, Contractor 0% Accounts $,.0 Paybale Misc 0% Hydro Inc Energy Services Inc Gas Water Heaters- Finance-Accounts Payable/Receivable,Account Reconcilations, Payroll Cost-Base $. Service Cost is marked up as follows: Labour 0%, Truck 0%, Material 0%, Contractor 0% Accounts $. Paybale Misc 0% Hydro Inc Energy Services Inc Electric Water Heaters- Finance-Accounts Payable/Receivable,Account Reconcilations, Payroll Cost-Base $. Service Cost is marked up as follows: Labour 0%, Truck 0%, Material 0%, Contractor 0% Accounts $. Paybale Misc 0% Hydro Inc Energy Services Inc Water Bills- Printed/Cancelled bills Cost-Base $,0. # of bills printed/cancelled * proportion related to $,. water bills* cost of bill print plus 0% mark-up Hydro Inc Energy Services Inc Water Meter Installs- Verifying meter installs, water reads/billing for water # meters installs Cost-Base $,. Service Cost is marked up as follows: Labour 0%, Truck 0%, Material 0%, Contractor 0% Accounts $,0.0 Paybale Misc 0% Hydro Inc Energy Services Inc Adminstrative Expenses- Mtce General Plant, Property Taxes, Property Insurance, Audit Fees, Office Supplies Cost-Base $,.0 0.0% on mtce of building, property taxes, property $,.0 insurance plus 0% mark-up Hydro Inc Energy Services Inc Board Of Directors-Payroll Cost-Base $,00.00 $,00.00 members x $0 $00 per meeting Year: 0 Shared Services Name of Company Price for the Cost for the Allocation Pricing Service Offered Service Service Methodology From To $ $ Hydro Inc Energy Services Inc Water Billing- Customer Service- Billing/collecting/Account Inquiries/Reports/Water reads Cost-Base $,.0 Service Cost is marked up as follows: Labour 0%, Truck 0%, Material 0%, Contractor 0% Accounts $,.0 Paybale Misc 0% Hydro Inc Energy Services Inc Gas Water Heaters- Finance-Accounts Payable/Receivable,Account Reconcilations, Payroll Cost-Base $. Service Cost is marked up as follows: Labour 0%, Truck 0%, Material 0%, Contractor 0% Accounts $. Paybale Misc 0% Hydro Inc Energy Services Inc Electric Water Heaters- Finance-Accounts Payable/Receivable,Account Reconcilations, Payroll Cost-Base $. Service Cost is marked up as follows: Labour 0%, Truck 0%, Material 0%, Contractor 0% Accounts $. Paybale Misc 0% Hydro Inc Energy Services Inc Water Bills- Printed/Cancelled bills Cost-Base $,. # of bills printed/cancelled * proportion related to $,00. water bills* cost of bill print plus 0% mark-up Hydro Inc Energy Services Inc Water Meter Installs- Verifying meter installs, water reads/contractor charges # meters installs Cost-Base $,0.00 Service Cost is marked up as follows: Labour 0%, Truck 0%, Material 0%, Contractor 0% Accounts $,. Paybale Misc 0% Hydro Inc Energy Services Inc Adminstrative Expenses- Mtce General Plant, Property Taxes, Property Insurance, Audit Fees, Office Supplies Cost-Base $,. 0.0% on mtce of building, property taxes, property $,0. insurance plus 0% mark-up Hydro Inc Energy Services Inc Board Of Directors-Payroll Cost-Base $,00.00 $,00.00 members x $0 $00 per meeting Year: 0 Shared Services Name of Company Price for the Cost for the Allocation Pricing Service Offered Service Service Methodology From To $ $ Hydro Inc Energy Services Inc Water Billing- Customer Service- Billing/collecting/Account Inquiries/Reports/Water reads Cost-Base $,. Service Cost is marked up as follows: Labour 0%, Truck 0%, Material 0%, Contractor 0% Accounts $,0. Payable Misc 0% Hydro Inc Energy Services Inc Gas Water Heaters- Finance-Accounts Payable/Receivable,Account Reconcilations, Payroll Cost-Base $. Service Cost is marked up as follows: Labour 0%, Truck 0%, Material 0%, Contractor 0% Accounts $. Paybale Misc 0% Hydro Inc Energy Services Inc Electric Water Heaters- Finance-Accounts Payable/Receivable,Account Reconcilations, Payroll/Solar Panel- Engineering Consulting Cost-Base $,. Service Cost is marked up as follows: Labour 0%, Truck 0%, Material 0%, Contractor 0% Accounts $,. Paybale Misc 0% Hydro Inc Energy Services Inc Water Bills- Printed/Cancelled bills Cost-Base $,0. # of bills printed/cancelled * proportion related to $,. water bills* cost of bill print plus 0% mark-up Hydro Inc Energy Services Inc Water Meter Installs- Contractor charges for #Meter Installed Cost-Base $,.0 Service Cost is marked up as follows: Labour 0%, Truck 0%, Material 0%, Contractor 0% Accounts $,0. Paybale Misc 0% Hydro Inc Energy Services Inc Adminstrative Expenses- Mtce General Plant, Property Taxes, Property Insurance, Audit Fees, Office Supplies Cost-Base $,. 0.0% on mtce of building, property taxes, property $,. insurance plus 0% mark-up Hydro Inc Energy Services Inc Board Of Directors-Payroll Cost-Base $,00.00 $,00.00 members x $0 $00 per meeting
54 Page of From Hydro Inc Hydro Inc Name of Company To Energy Services Inc Energy Services Inc Year: 0 Shared Services Service Offered Pricing Methodology Price for the Cost for the Service Service $ $ Water Billing- Customer Service- Billing/collecting/Account Inquiries/Reports/Water reads Cost-Base $,. $,. Gas Water Heaters- Finance-Accounts Payable/Receivable,Account Reconcilations, Payroll Cost-Base $0.00 $0.00 Electric Water Heaters- Finance-Accounts Payable/Receivable,Account Reconcilations, Payroll/Solar Panel- Engineering Consulting Cost-Base $,. $,. Hydro Inc Energy Services Inc Hydro Inc Energy Services Inc Water Bills- Printed/Cancelled bills Cost-Base $,.0 $,. Hydro Inc Energy Services Inc Water Meter Installs- Contractor charges for #Meter Installed Cost-Base $,0.00 $0,0.00 Hydro Inc Energy Services Inc Adminstrative Expenses- Mtce General Plant, Property Taxes, Property Insurance, Audit Fees, Office Supplies Cost-Base $,. $,. Hydro Inc Energy Services Inc Board Of Directors-Payroll Cost-Base $,00.00 $,00.00 From Hydro Inc Hydro Inc Name of Company To Energy Services Inc Energy Services Inc Year: 0 Shared Services Service Offered Pricing Methodology Price for the Cost for the Service Service $ $ Water Billing- Customer Service- Billing/collecting/Account Inquiries/Reports/Water reads Cost-Base $,. $0,.0 Gas Water Heaters- Finance-Accounts Payable/Receivable,Account Reconcilations, Payroll Cost-Base $0.00 $0.00 Electric Water Heaters- Finance-Accounts Payable/Receivable,Account Reconcilations, Payroll/Solar Panel- Engineering Consulting Cost-Base $,. $,.0 Hydro Inc Energy Services Inc Hydro Inc Energy Services Inc Water Bills- Printed/Cancelled bills Cost-Base $,0. $0,0. Hydro Inc Energy Services Inc Water Meter Installs- Contractor charges for #Meter Installed Cost-Base $,0.00 $0,0.00 Hydro Inc Energy Services Inc Adminstrative Expenses- Mtce General Plant, Property Taxes, Property Insurance, Audit Fees, Office Supplies Cost-Base $,. $,. Hydro Inc Energy Services Inc Board Of Directors-Payroll Cost-Base $,00.00 $,00.00
55 Page of The following table provides a comparison of shared services between the OEB approved 0, the actual 0 and the test year 0: Table.: Services to ESNI Comparisons Service 0 OEB Approved 0 Actual 0 Proposed Water heaters rental support $,00 $,0 $,0 Water and waste water billing $0,00 $,0 $, Administration $,00 $, $, Board of Directors - $,00 $,00 Total $0,00 $,0 $, The water heater support business was sold in 0. Some administrative services are still being provided to the purchaser but these are declining over time. 0 The water and wastewater billing services have increased over time with the growth in the number of customers. Beginning in 0, the Town of began installing transmitters to remotely read the water readers in a manner similar to electric smart meters. This initially increased the costs being charged for this service but as the transition problems are being resolved and the benefits of the remote reading realized the costs are expected to decline. Administration is an allocation of overhead including premises, insurance and other similar charges. Two of the Board members are on the Board of ESNI. Technically they are paid by ESNI but as ESNI has no employees and no payroll system the costs flow through NOTL Hydro.
56 Appendix List of Appendices Hydro Inc. Page of Appendix A IESO Final Results Report for NOTL Hydro (CDM) for 0 to 0
57 APPENDIX A COST OF SERVICE RATE APPLICATION

58

59
60

61

62
63

64

65

66

67

68

69

70

71

72

73

74

75