How to Utilize Your Data to Provide Information to Decision Makers in Traffic Safety ATSIP August 2nd
|
|
|
- Horace Perry
- 5 years ago
- Views:
Transcription
1 How to Utilize Your Data to Provide Information to Decision Makers in Traffic Safety 2011 ATSIP August 2nd
2 Presentations Building Data Warehouses and Using Cubes and Dimensions to Aggregate Data for Fast Web Delivery Cory Hutchinson and Chas. Cavalier Using Microsoft Analysis Services, Power Pivot and Sharepoint 2010 to Create Ad Hoc Analysis of Crash Data Max Kelly and Dr Helmut Schneider
3 Presentations Building Intelligence Tools to Better Understand and Display Crash Data to Assist Decision Makers Mark Verret and Cory Hutchinson Using Safety Performance Functions to Provide a Black Spot Analysis Dr Helmut Schneider and Christian Raschke
4 What is the Highway Safety Research Group (HSRG)? Grant funded by the LA DOTD Responsible for collecting, maintaining, storing, and analyzing crash data captured from law enforcement agencies throughout the state of Louisiana Analyzing crash data for LA since 1994
5 What is the Highway Safety Research Group (HSRG)? A division of the Information Systems and Decision Sciences Department (ISDS) within the E. J. Ourso College of Business at Louisiana State University Website:

6 Building Data Warehouses and Using Cubes and Dimensions to Aggregate Data for Fast Web Delivery
7 What is Business Intelligence (BI)? Refers to applications and technology, which is used to gather, provide access to, and analyze data and information. A broad category of applications and technologies for gathering, storing, analyzing, and providing access to data to help enterprise users make better business decisions. A process of transforming data into information and making it available to users in time to make effective decisions.
8 BI Projects within HSRG Data quality Performance Measures Data Analysis Statistics Data Reporting

9 Pre BI Project Infrastructure
10 Challenge Goals of BI Project: Focus shift on data delivery/analytics Provide information to decision makers Separate transactional and reporting operations Provide single version of the truth Leverage new technology and provide platform standardization in-line with our current competencies


11 BI Using Microsoft SQL 2008R2
12 Post BI Project Infrastructure
13 On-Line Analytic Processing (OLAP) Methodology for optimizing data for analysis and reporting Pre-Aggregates some data Enables faster, more flexible analysis


14 Cubes OLAP databases are called Cubes The Multi-Dimensional Expression (MDX) language accesses cube data MDX Analyst Aggregated Data OLAP Cube Database


15 Cube Structure Measures are Aggregated by Dimensions

16 Cube Structure Fatal Crashes in the Acadiana Region in January Acadiana Baton Rouge New Orleans March Region Month Severity Fatal Severe Moderate January February
17 Developing Cubes SQL Server Business Intelligence Development Studio (BIDS) used for developing cubes
18 Cubes in Development Louisiana Strategic Highway Safety Plan Central source for analysis and reporting Emphasis Areas Alcohol Impairment Young Drivers Seatbelt Use Roadway Departure
19 Interacting with the Cubes Client Programs BIDS Cube Browser SharePoint Dashboards Websites Users need not know MDX

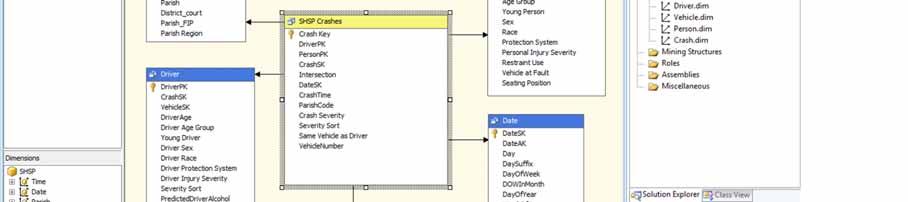
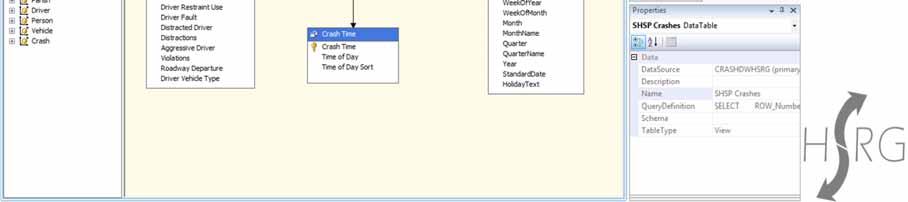
20 SHSP Cube Structure


21 BIDS Cube Browser

22 Microsoft Excel Uses Pivot Table interface Not demanding on less technical users Dashboards can be created using Excel Easy to integrate Excel based solutions Let s answer a few SHSP questions

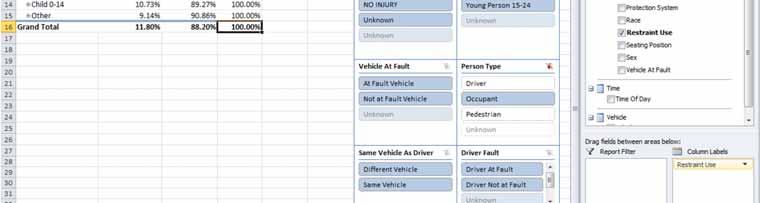

23 Excel as Cube Browser

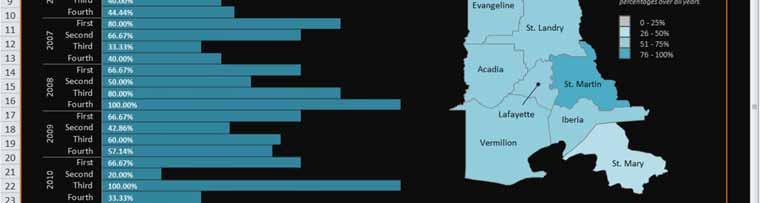
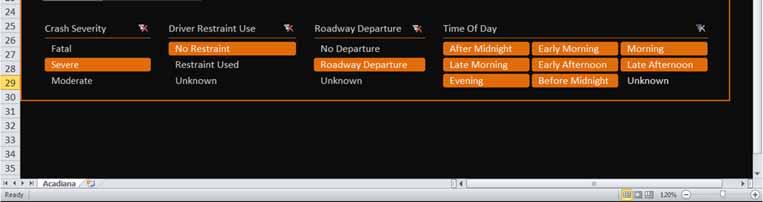
24 Excel Dashboard


25 Using Microsoft Analysis Services, Power Pivot and Sharepoint 2010 to Create Ad Hoc Analysis of Crash Data
26 Excel 2010 Advantages New features in Excel 2010 Overcome Excel s Row Limit of earlier version Most people are used to using Excel User-Friendly and Intuitive New PowerPivot Tool Import from any data source Access to Excel s PivotTable Tool SharePoint 2010 Easy sharing of Excel and PowerPivot Secure and refreshable

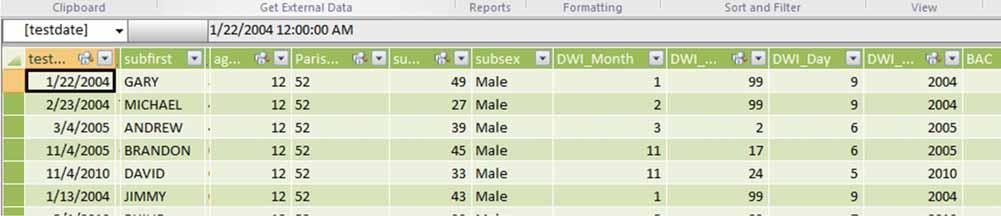
27 What is PowerPivot? PowerPivot is a free Excel Data Analysis Add-In Allows to import large data sets over 1 million rows Create Pivot Tables and graphs for cross tabulation

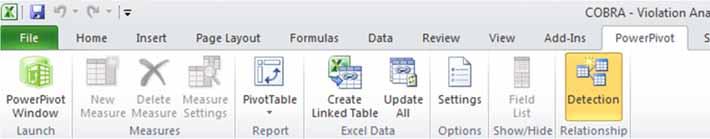
28 PowerPivot Power Pivot Tab PowerPivot Window
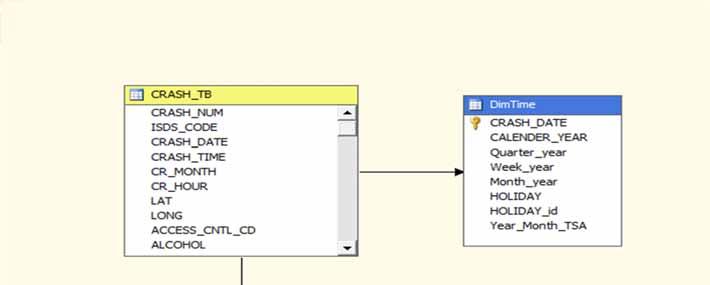
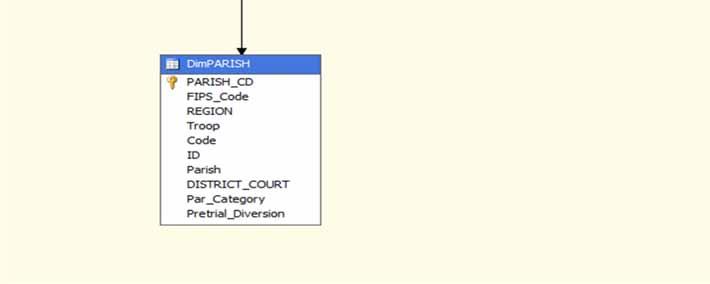
29 Dimensions

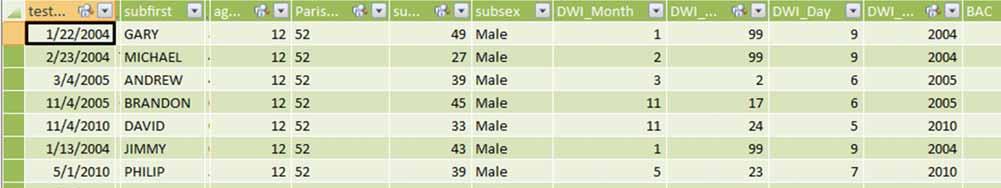
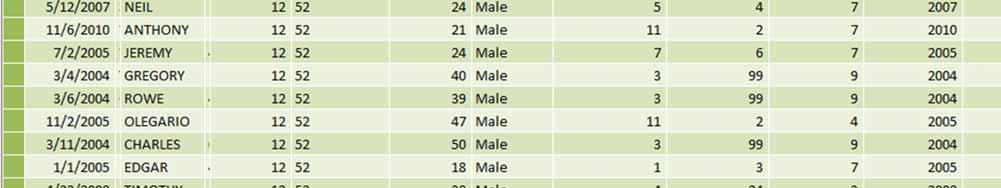
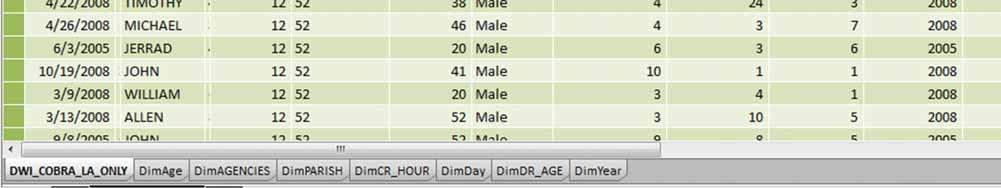
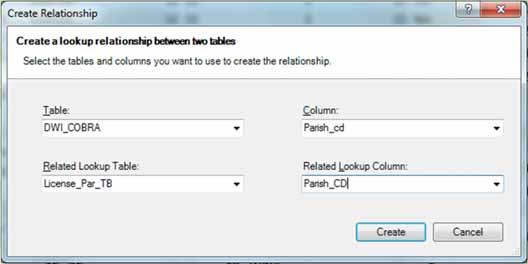
30 PowerPivot

31 PowerPivot - PivotTables Rows Columns Filter Horizontal and Vertical slicers
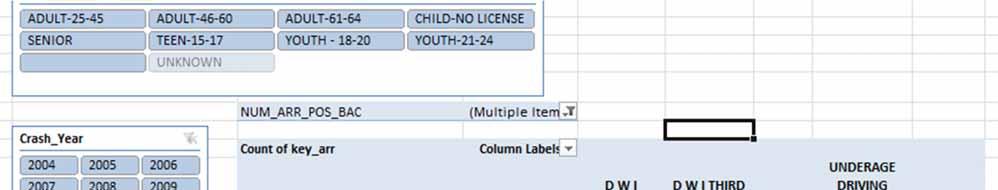
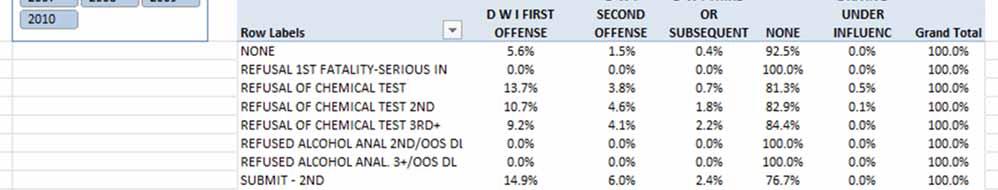
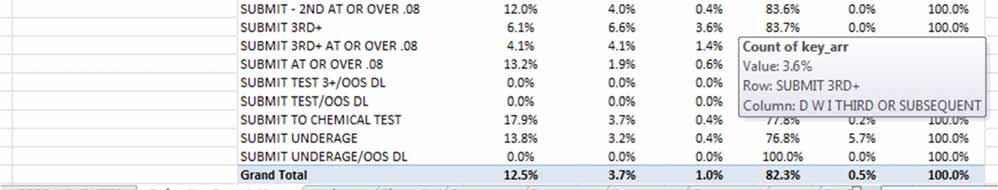
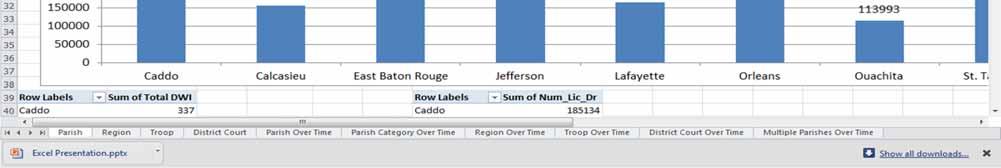
32 PowerPivot - PivotTables
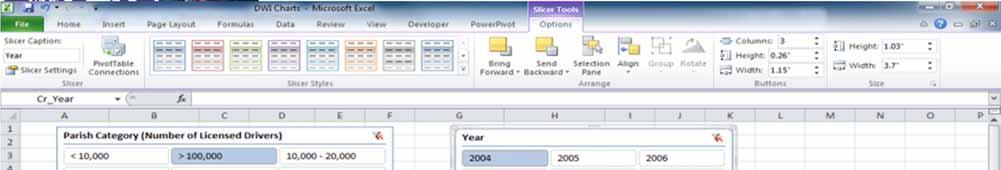
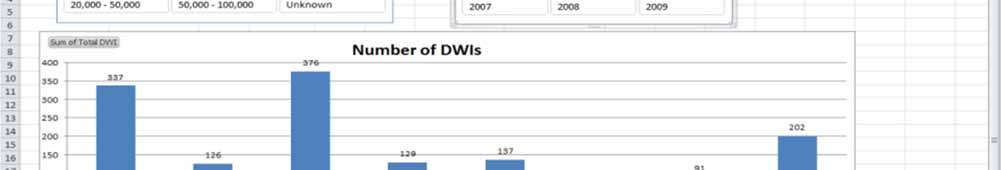


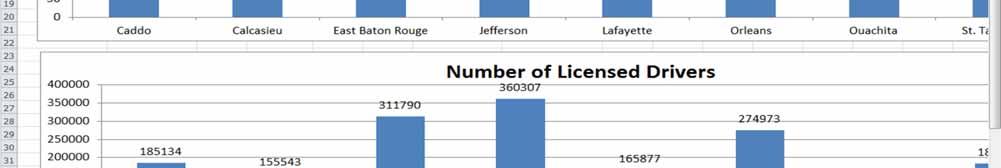
33 PowerPivot - PivotCharts
34 Example PowerPivot.xlsx
35 How do you share your tables and graphs? SharePoint is like an intranet with controlled access protected by passwords SharePoint 2010 allows to share information from PowerPivot Easy to save spreadsheet to SharePoint


36 Saving to Sharepoint


37 Sharepoint
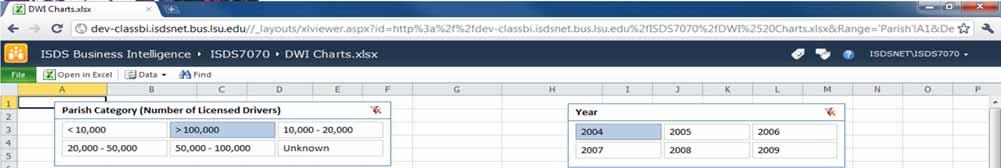
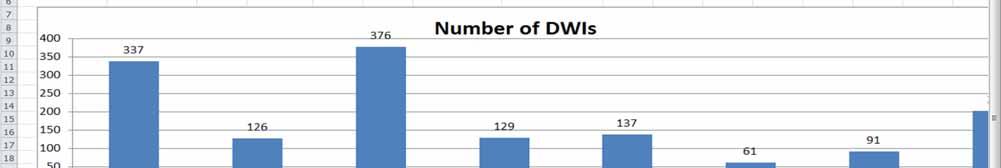
38 Sharepoint
39 Example of SharePoint SharePoint

40 Building Intelligence Tools to Better Understand and Display Crash Data to Assist Decision Makers

41 Effective Decision Making Key ingredients necessary for making effective decisions Must be a set of goals to work towards Must be a way to measure whether a chosen course is moving towards or away from those goals Information based on goals must be provided to the decision maker in a timely manner
42 Business Intelligence Facts and figures are not BI until They can be put in a format that can be easily understood by decision makers who use them. They can be delivered in a time to meaningfully affect daily decision making.

43 Effective Decision Making It would be nice to have a warning signal to help identify potential problems.
44 Reporting Services TRCC Performance Measures Location Reporting Report

45

46
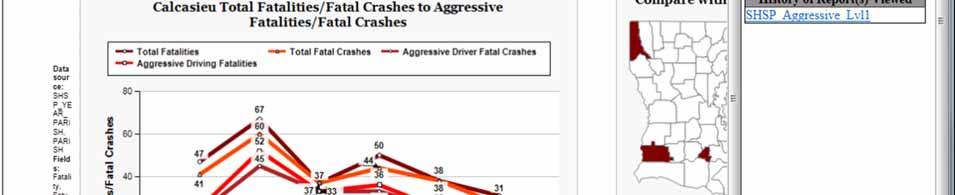
47 Problem Identification-HSRG 47
48 Reporting Services TRCC Performance Measures Timeliness Report

49

50
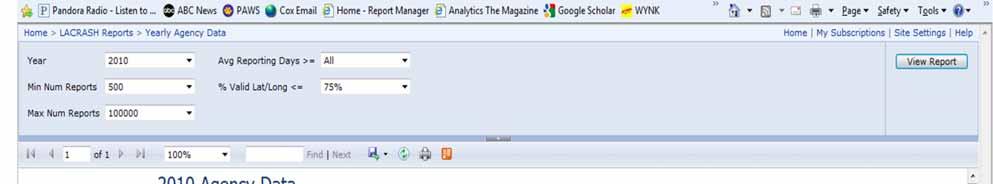
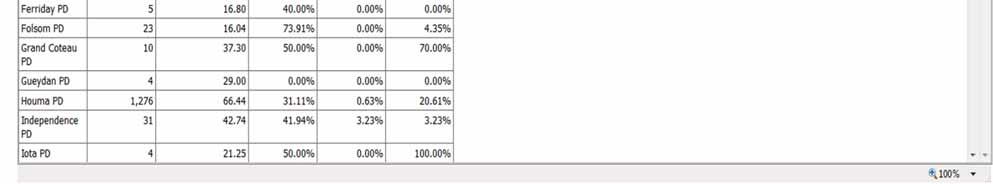
51 Reporting Services Allow Agencies to see their crash data Agency Crash Data Report

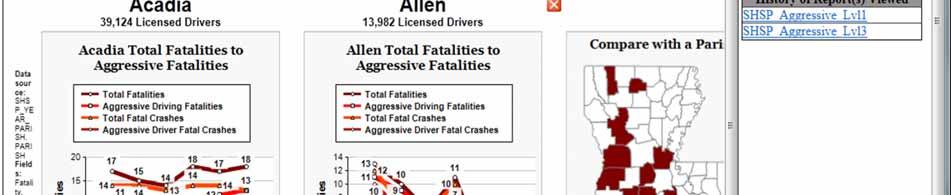
52 Problem Identification-HSRG 52


53 Problem Identification-HSRG 53
54 Next Steps Data Portals GIS Integration
55 BI Website LA Strategic Highway Safety Plan Data

56 OLD SHSP Website

57 SHSP Data Website
58 SHSP Data Website
59 SHSP Data Website

60 SHSP Data Website
61 SHSP Data Website

62 SHSP Data Website

63 SHSP Data Website

64 SHSP Data Website


65 SHSP Data Website
66 Using Safety Performance Functions to Provide a Black Spot Analysis Number of Crashes per year AADT
67 Black Spots or Abnormal Locations What are black spots or abnormal locations? How are they defined? How are they selected? How does the Empirical Bayes Model relate to black spots analysis? How does section length complicate the issue
68 Factors Affecting Crash Counts Road Segment Length Longer roads segments are expected to have more crashes Average Daily Traffic (ADT) Roads with larger ADT are expected to have higher crash counts Road Segment Width Narrower roads are expected to have more crashes Shoulder Width Road with narrower shoulders are expected to have more crashes Hazard Rating And others 68
69 Example: HSM SPF for Rural Two-way Roadway Segments Roadway Segment Base Condition N = AADT L e SPF 6 ( 0.312) Symbol N SPF L AADT Description Predicted total number of crashes per year Length of roadway segment in miles Average annual daily traffic volume 69
70 SPF and Average Number of Crashes per Mile per Year Number of Crashes per year per mile Dividing by miles standardizes the mean but not the variance SFP Beware: Different length will result in different variation AADT 70
71 Predicted Number of Crashes is loglinear predicted SPFx ( CMF ) 1x CMF2 x CMFyx Cx N = N... Symbol N predicted N SPFx CMF yx C x Description Predicted average crash frequency for a specific year of site type x Predicted average crash frequency determined for base conditions of the SPF developed for site type x Crash Modification Factors specific to SPF for site type x Calibration factor to adjust SPF for local conditions for site type x
72 Modeling Issues Interactions are only modeled with AADT. What about other interactions Lane width and shoulder width etc. 72
73 Average Number of Crashes for SPF & CMF for Lane Width, Shoulder Width Crashes per mile and year SPF LNCR MEDCR UNCR AADT 73
74 Predicted Crash Counts for Non-Base Condition Including CMFs Predicted Crash Counts for Two-Way Rural Roads (N predict ) 10 Crash Count per mile and year AADT Observation: Not a straight line because of the other factors (namely shoulder and pavement width, etc.) Beware: Need to look at more than just AADT! 74
75 Plotting Crash Data Don t forget the Variation Number of Crashes per year per mile N Observed AADT N predict with CMFs SPF 75
76 Issues relating to Computing the Top p% 1. Compare all locations or compare within a class? 1. Negative Binomial Regression Model with covariates 2. Use class 2. How to rank locations 1. Use crashes per mile 2. Use Empirical Bayes 3. How to account for length of road segment 76
77 Distribution for the Slice at ADT=10,000 Number of Crashes per year per mile SFP AADT 77
78 The Distribution of Mean Crash Counts for fixed Covariates and Specified Length of Road Segment N Predict (Overall Mean)
79 Is a Road Segment in the Top p% of the Distribution? Top p%? N Predicted X 79


80 The Empirical Bayes A Bayesian is one who, vaguely expecting a horse, and catching a glimpse of a donkey, strongly believes he has seen a mule. (Author Unknown) 80
81 Empirical Bayes for Negative Binomial Empirical Bayes Weight Within Sample Variance x = ω μ + (1 ω ) y Bi i i i i Mule Horse σ 2 i ωi = σ ζ i i σ = λl ϒ 2 i i i Donkey Between Sample Variance ζ = ( λ L ϒ) 2 2 i i i θ Li ϒ 81
82 Is a Road Segment in the Top p% of the Distribution? Top p% of Posterior Distribution? N Predicted X-EB 82
83 There is a Need for a Simple Robust Method for Selecting Top p% Parametric NegBin Regression Model 1. Negative Binomial Regression Model with covariates (SPF&CMF) 2. Empirical Bayes 3. Length of road segment affects variation Non-Parametric Model using Classes 1. Create categories for all covariates 2. Use N Observed instead of Empirical Bayes for ranking 3. Use smallest (e.g. 0.1 miles) standard length of road segment Assumes accurate information about the covariates are known. Requires computation of posterior distribution. No model assumptions. Requires equal length of segments. No EB necessary. 83
84 Example Local Road Project Create road segments of 500 feet between intersections (intersections not included) AADT categorized Road width Shoulder width Driveway Density categorized Curve or no curve Passing lane Number of lanes Shoulder Type Two Way left-turn lanes 84
85 References C.N. Morris, Parametric Empirical Bayes Inference, Journal of the American Statistical Association, Vol. 78, No. 381 (Mar., 1983), pp An Introduction to empirical Bayes Data Analysis, G. Caselle,,The American Statistician, Vol. 39, No. 2 (May, 1985), pp Karim El-Basyouny and Tarek Sayed, Comparison of Two Negative Binomial Regression Techniques in Developing Accident Prediction Models, Transportation Research Record: Journal of the Transportation Research Board, No. 1950, Transportation Research Board of the National Academies, Washington, D.C., 2006, pp
86 Contact Information DrHelmut Schneider Director (225) Mark Verret Network/Server Administrator (225) Cory Hutchinson Associate Director (225) Chas. Cavalier Graduate Student Max Kelly Graduate Student