Data Innovation for Utility Financial Survival
|
|
|
- Stephen Bradley
- 5 years ago
- Views:
Transcription

1 Data Innovation for Utility Financial Survival June 2017
2 Presenters Jason Bethke, President, FATHOM Joe Komisarz, Manager, Utility Services Department, City of Cedar Hill, Texas 2
3 Objectives Understand the value of Smart Grid for Water; Understand how to use data to offset revenue destruction from voluntary and regulated conservation mandates, and extend the life of existing assets through analytics; and Understand the intricacies of data and analytics to maximize collectible revenue and improve customer satisfaction. 3


4 Water Sector Challenges Resource Volatility Infrastructure Survivability Financial Viability Customer Centricity 4

5 Resource Volatility 5

6 Resource Volatility Source: 6


7 Infrastructure Survivability Source: 2011 EPA Infrastructure Needs Assessment (published 2013) 7

8 Today + Tomorrow Infrastructure Finance Requirements Source: AWWA, Buried No Longer: Confronting America s Water Infrastructure Challenge,

9 Financial Volatility Structural Conservation Voluntary Conservation Mandated Conservation USGS report for Florida stated that freshwater use in the state decreased 22 percent from 2000 to 2010, while the state's population increased 18 percent. California State Water Resources Control Board: water utility net revenues to decrease between $500 and $600 million Sources: S. Eskaf, Even Total Water Demand is on the Decline at Many Utilities, April 15, 2014 S. Moss, et al., Executive Order B State of Emergency Due to Severe Drought Conditions Economic Impact Analysis, May2015 A. Reid, K. Spear, Water demand shrinks even as state, U.S. grow, South Florida Sun-Sentinel, 7 Nov
10 Rates can t Keep Up Source: Jeff Hughes, UNC Environmental Finance Center ( 10
11 Show Me The Money Investment Needed Annual Shortfall = $18.3B Cumulative Shortfall = $459B Trump $1T Infrastructure Plan WIFIA SRF 11


12 Customer Centricity Customers expectations are being driven not by comparisons to other water utilities, but by their experiences in other sectors: on-line retail, banking, data, airlines, etc. Consumers want highly personalized information and they want it at any time on any device Web, TV, print, smart phone. Source: Jesse Berst, The six things utilities still don't get about consumers (but better learn fast!), Smart Grid News, Apr 5,

13 Customer Centricity Understanding the role of information and the household consumer is integral for transforming a Water Supply City where the focus is on infrastructure alone to a Water Sensitive City where infrastructure, users and the environment are integrated. Source: Damien P. Giurco, Stuart B. White and Rodney A. Stewart, Smart Metering and Water End-Use Data: Conservation Benefits and Privacy Risks Water 2010, 2,

14 Resource Volatility Infrastructure Survivability Financial Viability Customer Centricity Transforming Our Utilities DATA Incentivize Conservation Find Capacity in Existing Infrastructure Find Revenue in the Data Engage the Customer in the Business of the Utility 14


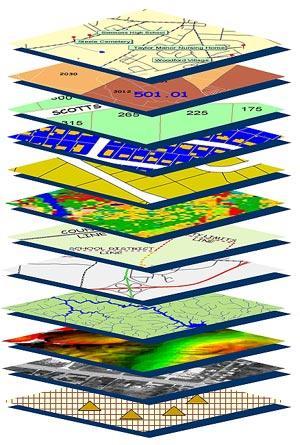

15 Putting Data to Work Tax Parcel Data Aerial Photographs Infrastructure Data Asset Data Census Data Customer Engagement Geospatial Data Meter Data CIS Data 15


16 Locating Water in Time & Space 16

17 Dollars and Drops in the Data $1.0M/yr $2.0M/yr $1.6M/yr $2.0M/yr $0.840M/yr $0.393M/yr 17
18 Capacity in the Data Source: CERES, Water Ripples: EXPANDING RISKS FOR U.S. WATER PROVIDERS, December
19 Speaker Transition Joe Komisarz, Manager, Utility Services Department, City of Cedar Hill, Texas 19


20 Cedar Hill, Texas Land Area: 35.5 mi² Incorporated: 1938 Population(2015): 49,650 Water/Sewer services only Water Connections: 16,250 Initiatives in: - Sustainability - Conservation - Green facilities 20
21 Local Environment (2011/12) Customer Service Service consistency issues City centric, reactive operations Outdated infrastructure Most meters 15 to 20 years old Reliability and accuracy issues Needed recapitalization Lost Revenue Billed water at approximately 60% of purchased water 21
22 Desired Project Outcomes Enhance Customer Service Recover Lost Revenue Reduce Expenditures Be Fiscally Prudent Facilitate Conservation and Green Initiatives 22
 FATHOM Meter Accuracy & Warranty Management FATHOM")
 FATHOM Customer Care (Managed Service) FATHOM U 2 You Customer Portal FATHOM U 2 You Consumption Presentment FATHOM U 2 You Financial Presentment")
23 Single Contact Contractor METERS & MEASUREMENT AMR / AMI & SENSORS DATA HOSTING & DATA MANAGEMENT ANALYTICS BILLING CUSTOMER SERVICE TELEPHONY, IVR & REMITTANCE MANAGEMENT E- BILL, TEXT BILL & 6 WAYS TO PAY CUSTOMER WEB TOOLS & MOBILE APPLICATIONS FATHOM MDM FATHOM Prime (including FATHOM Store) FATHOM Meter Accuracy & Warranty Management FATHOM Water Balancing & Reporting FATHOM Meter Verification & Data Collection Tool FATHOM Revenue Assurance FATHOM CIS FATHOM Traditional CIS FATHOM Smart Grid CIS FATHOM Revenue Management (Managed Service) FATHOM Customer Care (Managed Service) FATHOM U 2 You Customer Portal FATHOM U 2 You Consumption Presentment FATHOM U 2 You Financial Presentment 23
24 Project Components Agreement Signed November, 2013 Billing and Service Component Billing transferred to Fathom CCH retained a walk-up service counter Portal and phone app added Went live October 2014 AMI Component 16,200 meters replaced; started Dec 2014 Radio transmitters & data collectors added Full MDM Accepted August,

25 Utility Services Team City/Contractor Partnership Partnership Goal: Finance, acquire, install and operate a wholly new meter population, along with modernized billing and customer engagement platforms within existing costs. 25


26 Meter Infrastructure MasterMeter 1 meters Acculinx Encoder/Register paired with Aclara radio transmitter Residential and light commercial Approximately 15,500 in use Neptune T-10 2 meters Neptune ecoder/register paired with Aclara radio transmitter Commercial use Approximately 610 in use 26

27 Data Collector Locations Each w/ two transmitters 1. Meter data from 2. Timing signals to Each MTU can hit at least 6 DCU s for redundancy. Pole mounted and powered by battery charged via solar panels. Fathom is responsible for M&R. 27
28 Enhanced Customer Service Project added new tools for personal, real time management of monthly consumption and utility bills Ability to set consumption alerts or text notifications to account holder Immediate awareness of leaks or other unintended consumption Helps reduce careless water use Reduces negative customer contacts, frustration and account adjustments 28
29 Enhanced Customer Service 29


30 Enhanced Customer Service Monthly and daily detailed consumption data Analyses provided to customers with billing questions 30

31 Recover Lost Revenue Step 1: Complete data audit & complete field audit - 2,800 problem accounts identified Water theft from bypassed meters Unauthorized connections Meter degradation Meter programming errors Missing meters from billing inventory Meter installation errors Improperly sized or specified meters Data transcription errors Incorrect billing codes Human errors 31
32 Recover Lost Revenue 45% 40% 35% 30% 25% 20% 15% 10% 5% 0% 10% Goal Unbilled/Unmetered (Lost) Water Note: 2016 is year-to-date data 32
33 Reduce Expenditures Reduced staff and tasks Eliminated 6 full & part time positions since 2014 Saved billing and printing costs by contracting out billing functions Eliminated meter reading as a primary task Deferred meter purchases for 10 to 15 years 33
34 Be Fiscally Prudent Cost of service improvement In-house Cost: $6.51/meter/month Fathom Cost: $4.49/meter/month Net Savings: $2.02/meter/month $2.02/meter/month: $393,756/year Paying down the investment in AMI infrastructure 34

35 Be Fiscally Prudent Projected Payback Schedule Fiscal Year 35
36 Facilitate Conservation & Green Initiatives Eliminated meter reading routes covering 210 miles monthly Reduced emissions; saved fuel costs Provide 6 ways to pay without leaving home Pay by mail Pay by phone (Voice-IVR) Pay by phone (Data-App) Pay via web through customer portal Automatic monthly charge to credit card Automatic deduction from bank account 36

37 Facilitate Conservation & Green Initiatives 37
38 Additional Project Benefits Make real time, data driven decisions Budget and planning Rate structure decisions Resource allocation Training Improve service, responsiveness and performance Incentivize conservation 38
39 Current Challenges Large amounts of new data available Change management Internal and external resistance to change Public outreach and education workload Repurposed workforce & modified duties Before: Routine, simple, repetitive, reactive tasks After: Diagnostic, investigative, complex and proactive tasks New maintenance priorities Benefits depend on fully operational system; rapid maintenance responses are critical 39


40 Analyzing rate structure to consider shaping customer behavior in response to water consumption data Future Opportunities Incorporating consumption and system data into our operations models to reduce cost and increase efficiency 40

41 Questions?