Company XYZ X Y Z. Peer Group Service Desk Benchmark. Company
|
|
|
- Elfrieda Waters
- 5 years ago
- Views:
Transcription
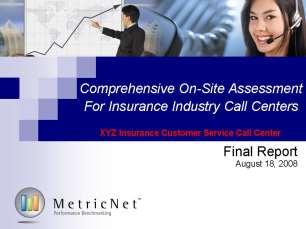
1 Company XYZ Peer Group Service Desk Benchmark Company X Y Z
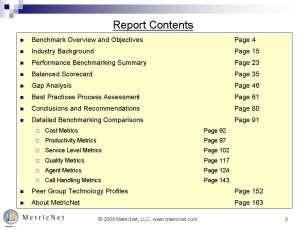
2 Report Contents Project Overview and Objectives Page 2 Industry Background Page 34 Performance Benchmarking Summary Page 43 Best Practices Process Assessment Page 67 ROI Calculations Page 81 Interview Themes and Quotes Page 86 Conclusions and Recommendations Page 98 Detailed Benchmarking Comparisons Page 122 Cost Metrics Page 123 Productivity Metrics Page 130 Service Level Metrics Page 141 Quality Metrics Page 148 Agent Metrics Page 155 Contact Handling Metrics Page 172 Workload Metric Page 181 About MetricNet Page 184
3 Project Overview and Objectives 2
4 Project Objectives Review and assess the performance of the Company XYZ Service Desk in St. Louis, MO Benchmark the performance of the Company XYZ Service Desk against a peer group of comparable service desks Conduct a best-practices process assessment Recommend strategies for improved performance Achieve world-class levels of support Maximize customer satisfaction
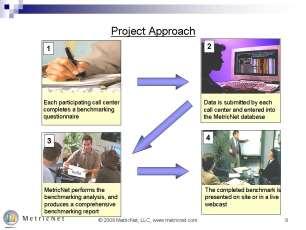
5 Project Approach Module 1: Company XYZ Baselining / Data Collection Module 2: Benchmarking and Gap Analysis Module 3: Balanced Scorecard Module 4: Best Practices Process Assessment Module 5: Strategies for Improved Performance Module 6: Report Development and Presentation of Results 4
6 Module 1: Company XYZ Baselining/Data Collection Core Topics Project Kickoff Data Collection Personnel Interviews 5
7 Project Kickoff Meeting Key Objectives: Project Kickoff Meeting Introduce the MetricNet and Company XYZ project teams Discuss the project schedule Discuss the data collection process Answer questions about the project Company XYZ 6
8 Data Collection
9 Interviews Agents, team leads, supervisors QA/QC, workforce schedulers, trainers Personnel Interviews Company XYZ 8
10 Module 2: Benchmarking and Gap Analysis Core Topics Peer Group Selection Benchmarking Comparison Gap Analysis 9


11 Benchmarking Peer Group Selection Scope Scale Complexity IDEAL PEER GROUP Geography Read MetricNet s whitepaper on Benchmarking Peer Group Selection. Go to to get your copy! 10
12 Dynamic Peer Group Selection Scope Scale Complexity Geography Scope refers to the services offered by the Service Desk. The broader the scope of services offered, the broader the skill set required by the agents. As scope increases, so too does the cost of providing support. The Service Desks selected for benchmarking comparison must be comparable in the scope of services offered. Volume refers to the number of contacts handled by the Service Desk. Virtually everything in the Service Desk is subject to scale economies. This is particularly true when it comes to the volume of contacts handled. The approximate scale effect for volume is 5%. What this means is that every time the number of transactions doubles, you should expect to see the cost per contact decline by 5%. For this reason, it is important to select benchmarking peer groups that are similar in scale. The complexity of transactions handled will influence the handle time, and hence the cost per transaction. For example, a password reset is a simple transaction that takes very little time, and costs very little to resolve. By contrast, an inquiry for a complex application like SAP takes much longer and costs much more to resolve. MetricNet uses a proprietary algorithm to determine a weighted complexity index based upon the mix of transactions handled by a Service Desk. The companies chosen for a benchmarking peer group will have similar complexity factors. The main factor that is affected by geography is cost, specifically labor cost. Since labor accounts for 65% of Service Desk operating expense, it is important to benchmark Service Desks that have a common geography. Even within a particular geography, wage rates can differ significantly, so MetricNet makes adjustments to ensure that each Service Desk in a benchmarking peer group is normalized to the same wage rate. 11


13 Service Desk Benchmark: Key Questions Answered Key Questions How is your Service Desk performing? How does your Service Desk compare to other comparable Service Desks? MetricNet s Database of Process and Performance Indicators Company XYZ Service Desk Data What are the strengths and weaknesses of your Service Desk? What are the areas of improvement for your Service Desk? How can you enhance Service Desk performance and achieve world-class status? Service Desk Benchmark Gap Analysis Improvement Recommendations Realized Performance Gains 12

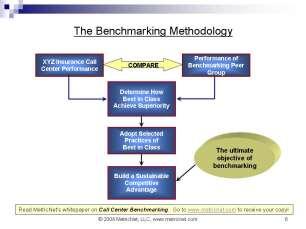
14 The Benchmarking Methodology Company XYZ Service Desk Performance COMPARE Performance of Benchmarking Peer Group Determine How Best in Class Achieve Superiority Adopt Selected Practices of Best in Class Build a Sustainable Competitive Advantage The ultimate objective of benchmarking Read MetricNet s whitepaper on Benchmarking Defined. Go to to receive your copy! 13
15 Summary of Included Benchmarking Metrics Cost Productivity Service Level Cost per Inbound Contact Cost per Minute of Inbound Handle Time Net First Level Resolution Rate Quality Call Quality Inbound Contacts per Agent per Month Outbound Contacts per Agent per Month Agent Utilization Agent as a % of Total Headcount Agent Average Speed of Answer (ASA) % of Calls Answered in 30 Seconds Call Abandonment Rate Contact Handling Net First Contact Resolution Rate Customer Satisfaction Workload Inbound Contacts per End User per Month Annual Agent Turnover Daily Agent Absenteeism Agent Occupancy Schedule Adherence New Agent Training Hours Annual Agent Training Hours Agent Tenure (months) Agent Job Satisfaction Inbound Contact Handle Time (minutes) Outbound Contact Handle Time (minutes) Outbound Contacts as a % of Total Contacts User Self-Service Completion Rate 14
16 Metric Type Cost Productivity Service Level Quality Agent Benchmarking KPI Performance Summary Key Performance Indicator (KPI) Company XYZ Peer Group Statistics Average Min Median Max Cost per Inbound Contact $15.61 $21.10 $11.27 $20.68 $32.69 Cost per Minute of Inbound Handle Time $1.52 $2.00 $1.33 $1.99 $2.93 Net First Level Resolution Rate 81.9% 84.0% 68.9% 83.9% 91.1% Inbound Contacts per Agent per Month Outbound Contacts per Agent per Month Agent Utilization 49.3% 44.1% 32.1% 42.6% 59.6% Agents as a % of Total Headcount 83.4% 75.0% 66.4% 74.9% 83.4% Average Speed of Answer (seconds) % of Calls Answered in 30 Seconds 84.0% 47.2% 11.9% 53.0% 84.0% Call Abandonment Rate 3.5% 4.3% 1.6% 3.1% 14.6% Call Quality 87.4% 85.2% 68.7% 85.2% 96.8% Net First Contact Resolution Rate 70.7% 72.1% 64.8% 71.1% 88.8% Customer Satisfaction 85.8% 79.0% 68.4% 77.5% 95.1% Annual Agent Turnover 32.9% 41.6% 14.3% 39.4% 68.2% Daily Agent Absenteeism 3.6% 8.4% 3.6% 7.3% 15.5% Agent Occupancy 88.4% 74.0% 55.1% 71.9% 94.6% Schedule Adherence 60.6% 81.6% 60.6% 83.5% 91.5% New Agent Training Hours Annual Agent Training Hours Agent Tenure (months) Agent Job Satisfaction 78.2% 83.4% 67.8% 84.5% 98.9% Inbound Contact Handle Time (minutes) Outbound Contact Handle Time (minutes) Contact Handling Outbound Contacts as a % of Total Contacts 7.4% 21.4% 2.7% 21.8% 36.6% User Self-Service Completion Rate 1.9% 12.6% 0.0% 15.0% 29.7% Workload Inbound Contacts per End User per Month
17 Quality (Effectiveness) Sample report only. Data is not accurate. Cost vs. Quality for Company XYZ Service Desk Higher Quality Middle Quartiles Effective but not Efficient Top Quartile Efficient and Effective Company XYZ Global Database Lower Quality Lower Quartile Middle Quartiles Efficient but not Effective Higher Cost Cost (Efficiency) Lower Cost 16
18 Module 3: Balanced Scorecard Core Topics Metrics Selection Metric Weightings Scorecard Construction 17
19 Company XYZ Service Desk Balanced Scorecard Performance Metric Metric Weighting Performance Range Worst Case Best Case Your Actual Performance Metric Score Balanced Score Cost per Inbound Contact 25.0% $32.69 $11.27 $ % 19.9% Customer Satisfaction 25.0% 68.4% 95.1% 85.8% 65.3% 16.3% Agent Utilization 15.0% 32.1% 59.6% 49.3% 62.5% 9.4% Net First Contact Resolution Rate 15.0% 64.8% 88.8% 70.7% 24.6% 3.7% Agent Job Satisfaction 10.0% 67.8% 98.9% 78.2% 33.4% 3.3% Average Speed of Answer (seconds) 10.0% % 8.2% Total 100.0% N/A N/A N/A N/A 60.9% Step 1 Six critical performance metrics have been selected for the scorecard. Step 2 Each metric has been weighted according to its relative importance. Step 3 For each performance metric, the highest and lowest performance levels in the benchmark are recorded. Step 4 Your actual performance for each metric is recorded in this column. Step 5 Your score for each metric is then calculated: (worst case - actual performance) (worst case best case) 100 Step 6 Your balanced score for each metric is calculated: metric score weighting 18
20 Balanced Scores Sample report only. Data is not accurate. Balanced Scorecard Summary 85.0% 80.0% 75.0% 70.0% 65.0% 60.0% 55.0% 50.0% 45.0% 40.0% 35.0% 30.0% 25.0% 20.0% 15.0% 10.0% 5.0% 0.0% Key Statistics Service Desk Scores High 78.3% Average 47.2% Median 46.3% Low 24.8% Company XYZ 60.9% Service Desk *The scores shown in the chart are based upon the performance metrics, weightings, and data ranges shown on the previous page. 19
21 Balanced Score Sample report only. Data is not accurate. The Scorecard Can be Updated Monthly 85% 80% 75% 70% 65% 60% 55% 50% 45% 40% Jan Feb Mar Apr May Jun Jul Aug Sep Oct Nov Dec 12 Month Average Monthly Score * Sample Only 20
22 Module 4: Best Practices Process Assessment Core Components Company XYZ Self- Assessment MetricNet Maturity Ranking Process Assessment Rollup 21
23 Six-Part Model for Service Desk Best Practices Model Component Definition Strategy Strategy Defining Your Charter and Mission Stakeholder Communication Customer Enthusiasm Human Resources Human Resources Proactive, Life-Cycle Management of Personnel Process Expeditious Delivery of Customer Service Performance Measurement Technology Process Technology Leveraging People and Processes Performance Measurement A Holistic Approach to Performance Measurement Stakeholder Communication Proactively Managing Stakeholder Expectations 22
24 Best Practices Evaluation Criteria Ranking Explanation 1 No Knowledge of the Best Practice. 2 Aware of the Best Practice, but not applying it. 3 Aware of the Best Practice, and applying at a rudimentary level. 4 Best Practice is being effectively applied. 5 Best Practice is being applied in a world-class fashion. 23
25 Best Practice Sample report only. Data is not accurate. Company XYZ Process Self-Assessment Strategy Best Practices Defined Company XYZ's Score Peer Group Average The Service Desk has a well-defined mission, vision, and strategy. The vision and strategy are welldocumented, and communicated to key stakeholders in the organization. The Service Desk has a published Service Catalog, including a Supported Products List, that is 2 distributed and communicated to key stakeholders including end users. The Service Catalog is available online. The Service Desk has an action plan for continuous improvement. The plan is documented and 3 distributed to key stakeholders in the organization, and specific individuals are held accountable for implementing the action plan. The Service Desk is well integrated into the information technology function. The service desk acts 4 as the "voice of the user" in IT, and is involved in major IT decisions and deliberations that affect end users. The Service Desk is alerted ahead of time so that they can prepare for major rollouts, or other changes in the IT environment. The Service Desk has SLA's that define the level of service to be delivered to users. The SLA's are documented, published, and communicated to key stakeholders in the organization. The Service Desk has OLA's (Operating Level Agreements) with other support groups in the 6 organization (e.g., level 2 support, desktop support, field support, etc.). The OLA's clearly define the roles and responsibilities of each support group, and the different support groups abide by the terms of the OLA's. The Service Desk actively seeks to improve Level 1 Resolution Rates, First Contact Resolution 7 Rates, Level 0 Resolution Rates (User Self-Help), and Level -1 (Problem Prevention) Resolution Rates by implementing processes, technologies, and training that facilitate these objectives. Summary Statistics Total Score Average Score
26 Average Score Sample report only. Data is not accurate. Best Practices Process Self-Assessment Summary Company XYZ Peer Group 25
27 World-Class = 75.0% Balanced Score Average = 48.2% Sample report only. Data is not accurate. Process Maturity vs. Scorecard Performance 100% Company XYZ Performance 90% Process Assessment Score 62.0% Balanced Score 60.9% 80% 70% 60% 50% Average = 47.2% 40% 30% 20% 10% Company XYZ Global Database 0% 0% 10% 20% 30% 40% 50% 60% 70% 80% 90% 100% Process Assessment Score 26
28 Module 5: Strategies for Improved Performance Core Components Conclusions and Recommendations Roadmap for World- Class Performance 27
29 Conclusions and Recommendations Conclusions and Recommendations fall into six categories 1. Strategy 2. Human Resource Management 3. Call Handling Processes and Procedures 4. Technology 5. Performance Measurement and Management 6. Stakeholder Communication 28
30 Service Desk KPI Correlations Drive Conclusions Cost per Contact Customer Satisfaction Agent Utilization First Contact Resolution Scheduling Efficiency Service Levels: ASA and AR Agents/ Total FTE s Absenteeism/ Turnover First Level Resolution Handle Time Call Quality Agent Satisfaction Coaching Career Path Training Hours 29
31 Performance Targets Will be Established Performance Metric Current Company XYZ Performance Target Performance Net First Level Resolution Rate 81.9% 85.0% Net First Contact Resolution Rate 70.7% 75.0% Annual Agent Training Hours 7 16 User Self-Service Completion Rate 1.9% 12.0% Agent Job Satisfaction 78.2% 85.0% Balanced Score 60.9% 65.8% Achieving the performance targets recommended above would increase the Company XYZ Service Desk Balanced Score from 60.9% to 65.8%. 30
32 Module 6: Report Development and Presentation of Results Core Topics Conclusions and Recommendations Report Development Presentation of Benchmarking Results 31
33 Write Benchmarking Report 32
34 MetricNet will present the results of the benchmark in a live GoToMeeting. Presentation of Results Company XYZ 33
35 Industry Background 34
36 The Paradox of IT Support 4% End-User Support Less than 5% of all IT spending is allocated to end-user support. Service desk, desktop support, field support 96%: Non-support functions Application Development Application Maintenance Network Operations Mainframe and midrange Computing Desktop Computing Contract Services (e.g., disaster recovery) Corporate IT Spending Breakdown This leads many to erroneously assume that there is little upside opportunity in IT support. The result is that most support organizations are managed with the goal of minimizing costs. But the most effective support strategies focus on maximizing value. 35
37 Creating Economic Value in Service and Support World-Class Service and support organizations recognize and exploit four unique sources of leverage: 1. Minimizing Total Cost of Ownership (TCO) 2. Driving Contacts into Lower-Cost Channels 3. Improving End-User Productivity 4. Driving a Positive View of Corporate IT 36


 Level 2:")

38 A Primer on User Support TCO Support Level Cost per Ticket Vendor $599 Field Support $221 Level 3 IT (apps, networking, NOC, etc.) Level 2: Desktop Support $104 $69 Level 1: Service Desk $22 37
39 Shift-Left Cost Reduction Strategies 38
40 Contact Deflection into Lower-Cost Channels 39
41 Productive Hours Lost per Employee per Year Sample report only. Data is not accurate. 70 Returning Productivity to End Users Support Function Service Desk Desktop Support Performance Quartile n = 60 Key Performance Indicator Performance Quartile 1 (top) (bottom) Customer Satisfaction 93.5% 84.5% 76.1% 69.3% First Contact Resolution Rate 90.1% 83.0% 72.7% 66.4% Mean Time to Resolve (hours) Customer Satisfaction 94.4% 89.2% 79.0% 71.7% First Contact Resolution Rate 89.3% 85.6% 80.9% 74.5% Mean Time to Resolve (hours) Average Productive Hours Lost per Employee per Year
42 % Saying Very Important Sample report only. Data is not accurate. Support Drives Customer Satisfaction for All of IT 90% 84% 80% 70% 60% n = 1,044 Global large cap companies Survey type: multiple choice 3 responses allowed per survey 50% 47% 40% 30% 20% 31% 29% 22% 19% 10% 8% 0% Service Desk Desktop Support Network Outages VPN Training Enterprise Applications Desktop Software Factors Contributing to IT Customer Satisfaction 84% cited the Service Desk as a very important factor in their overall satisfaction with corporate IT 47% cited desktop support as a very important factor in their overall satisfaction with corporate IT 41
43 We Exploit This Leverage Through Benchmarking Higher AFTER Benchmarking BEST-IN-CLASS PERFORMANCE CURVE BELOW-AVERAGE PERFORMANCE CURVE STARTING POINT: Before Benchmarking Lower Cost per Contact Higher 42
44 Performance Benchmarking Summary 43
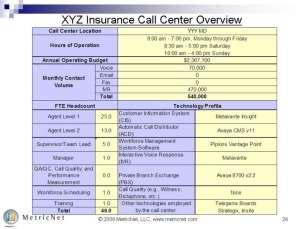
45 Company XYZ Service Desk Overview Service Desk Location(s) St. Louis, MO Hours of Operation 24 x 7 Number of End Users Supported 45,000 Data Time Period January 2017 December 2017 Annual Operating Expense $9,894,357 Voice 37,204 17,501 Monthly Inbound Contact Volume Web Portal Walk-Up Other Total ,233 Monthly Outbound Contact Volume 4,402 Approx. Monthly Self-Service Resolution Volume 1,008 FTE Personnel Headcount Technology Profile Agent Level Trouble Ticket System ServiceNow Geneva Agent Level Automatic Call Distributor (ACD) Avaya Aura Contact Center Agent Level Interactive Voice Response (IVR) Avaya Aura Contact Center Supervisor/Team Lead 6.0 Workforce Management/Scheduling cc-modeler Professional Manager 1.0 Knowledge Management System ServiceNow Geneva QA/QC 4.0 Automated Password Reset Courion Trainer 2.0 Remote Control Software Bomgar Workforce Scheduler 1.0 Call Quality Software Verint Administrative 2.0 Total
46 Summary of Included Benchmarking Metrics Cost Productivity Service Level Cost per Inbound Contact Cost per Minute of Inbound Handle Time Net First Level Resolution Rate Quality Call Quality Inbound Contacts per Agent per Month Outbound Contacts per Agent per Month Agent Utilization Agents as a % of Total Headcount Agent Average Speed of Answer (ASA) % of Calls Answered in 30 Seconds Call Abandonment Rate Contact Handling Net First Contact Resolution Rate Customer Satisfaction Workload Annual Agent Turnover Daily Agent Absenteeism Agent Occupancy Schedule Adherence New Agent Training Hours Annual Agent Training Hours Agent Tenure (months) Agent Job Satisfaction Inbound Contact Handle Time (minutes) Outbound Contact Handle Time (minutes) Outbound Contacts as a % of Total Contacts User Self-Service Completion Rate 45
47 Metric Type Cost Productivity Service Level Quality Agent Benchmarking KPI Performance Summary Key Performance Indicator (KPI) Company XYZ Peer Group Statistics Average Min Median Max Cost per Inbound Contact $15.61 $21.10 $11.27 $20.68 $32.69 Cost per Minute of Inbound Handle Time $1.52 $2.00 $1.33 $1.99 $2.93 Net First Level Resolution Rate 81.9% 84.0% 68.9% 83.9% 91.1% Inbound Contacts per Agent per Month Outbound Contacts per Agent per Month Agent Utilization 49.3% 44.1% 32.1% 42.6% 59.6% Agents as a % of Total Headcount 83.4% 75.0% 66.4% 74.9% 83.4% Average Speed of Answer (seconds) % of Calls Answered in 30 Seconds 84.0% 47.2% 11.9% 53.0% 84.0% Call Abandonment Rate 3.5% 4.3% 1.6% 3.1% 14.6% Call Quality 87.4% 85.2% 68.7% 85.2% 96.8% Net First Contact Resolution Rate 70.7% 72.1% 64.8% 71.1% 88.8% Customer Satisfaction 85.8% 79.0% 68.4% 77.5% 95.1% Annual Agent Turnover 32.9% 41.6% 14.3% 39.4% 68.2% Daily Agent Absenteeism 3.6% 8.4% 3.6% 7.3% 15.5% Agent Occupancy 88.4% 74.0% 55.1% 71.9% 94.6% Schedule Adherence 60.6% 81.6% 60.6% 83.5% 91.5% New Agent Training Hours Annual Agent Training Hours Agent Tenure (months) Agent Job Satisfaction 78.2% 83.4% 67.8% 84.5% 98.9% Inbound Contact Handle Time (minutes) Outbound Contact Handle Time (minutes) Contact Handling Outbound Contacts as a % of Total Contacts 7.4% 21.4% 2.7% 21.8% 36.6% User Self-Service Completion Rate 1.9% 12.6% 0.0% 15.0% 29.7% Workload Inbound Contacts per End User per Month
48 KPI Gap Summary Metric Type Key Performance Indicator (KPI) Company XYZ Peer Average Performance Gap Cost per Inbound Contact $15.61 $ % Cost Cost per Minute of Inbound Handle Time $1.52 $ % Net First Level Resolution Rate 81.9% 84.0% -2.5% Inbound Contacts per Agent per Month % Productivity Outbound Contacts per Agent per Month % Agent Utilization 49.3% 44.1% 11.8% Agents as a % of Total Headcount 83.4% 75.0% 11.1% Average Speed of Answer (seconds) % Service Level % of Calls Answered in 30 Seconds 84.0% 47.2% 78.0% Call Abandonment Rate 3.5% 4.3% 18.0% Call Quality 87.4% 85.2% 2.5% Quality Net First Contact Resolution Rate 70.7% 72.1% -2.0% Customer Satisfaction 85.8% 79.0% 8.7% Annual Agent Turnover 32.9% 41.6% 21.0% Daily Agent Absenteeism 3.6% 8.4% 57.4% Agent Occupancy 88.4% 74.0% 19.4% Agent Schedule Adherence 60.6% 81.6% -25.6% New Agent Training Hours % Annual Agent Training Hours % Agent Tenure (months) % Agent Job Satisfaction 78.2% 83.4% -6.3% Inbound Contact Handle Time (minutes) % Outbound Contact Handle Time (minutes) % Contact Handling Outbound Contacts as a % of Total Contacts 7.4% 21.4% 65.4% User Self-Service Completion Rate 1.9% 12.6% -84.9% Workload Inbound Contacts per End User per Month % 47
49 KPI Gap Ranking Key Performance Indicator (KPI) Company XYZ Peer Average Performance Gap % of Calls Answered in 30 Seconds 84.0% 47.2% 78.0% Outbound Contacts as a % of Total Contacts 7.4% 21.4% 65.4% Outbound Contacts per Agent per Month % Daily Agent Absenteeism 3.6% 8.4% 57.4% Cost per Inbound Contact $15.61 $ % Cost per Minute of Inbound Handle Time $1.52 $ % Annual Agent Turnover 32.9% 41.6% 21.0% Agent Occupancy 88.4% 74.0% 19.4% New Agent Training Hours % Call Abandonment Rate 3.5% 4.3% 18.0% Average Speed of Answer (seconds) % Inbound Contact Handle Time (minutes) % Inbound Contacts per Agent per Month % Agent Utilization 49.3% 44.1% 11.8% Agents as a % of Total Headcount 83.4% 75.0% 11.1% Customer Satisfaction 85.8% 79.0% 8.7% Inbound Contacts per End User per Month % Outbound Contact Handle Time (minutes) % Call Quality 87.4% 85.2% 2.5% Net First Level Resolution Rate 81.9% 84.0% -2.5% Net First Contact Resolution Rate 70.7% 72.1% -2.0% Agent Job Satisfaction 78.2% 83.4% -6.3% Schedule Adherence 60.6% 81.6% -25.6% Agent Tenure (months) % Annual Agent Training Hours % User Self-Service Completion Rate 1.9% 12.6% -84.9% 48
50 Quartile Rankings: Cost and Productivity Metrics Cost Metric Cost per Inbound Contact Cost per Minute of Inbound Handle Time Net First Level Resolution Rate 1 (Top) Quartile 2 3 $11.27 $18.56 $20.68 $23.56 (Bottom) $18.56 $20.68 $23.56 $32.69 $1.33 $1.67 $1.99 $2.20 $1.67 $1.99 $2.20 $ % 88.7% 83.9% 81.2% 88.7% 83.9% 81.2% 68.9% 4 Company XYZ Performance $15.61 $ % Productivity Metric Inbound Contacts per Agent per Month Outbound Contacts per Agent per Month Agent Utilization Agents as a % of Total Headcount 1 (Top) Quartile % 49.3% 42.6% 40.9% 49.3% 42.6% 40.9% 32.1% 83.4% 78.4% 74.9% 72.0% (Bottom) % 74.9% 72.0% 66.4% 4 Company XYZ Performance % 83.4% 49
51 Quartile Rankings: Service Level and Quality Metrics Service Level Metric Average Speed of Answer (seconds) % of Calls Answered in 30 Seconds Call Abandonment Rate 1 (Top) 2 Quartile % 59.9% 53.0% 32.9% 59.9% 53.0% 32.9% 11.9% 1.6% 2.1% 3.1% 5.2% 2.1% 3.1% 5.2% 14.6% 3 4 (Bottom) Company XYZ Performance % 3.5% Quality Metric Call Quality Net First Contact Resolution Rate Customer Satisfaction 1 (Top) 2 Quartile 96.8% 89.5% 85.2% 82.3% 89.5% 85.2% 82.3% 68.7% 88.8% 74.0% 71.1% 68.1% 74.0% 71.1% 68.1% 64.8% 95.1% 85.5% 77.5% 73.9% 85.5% 77.5% 73.9% 68.4% 3 4 (Bottom) Company XYZ Performance 87.4% 70.7% 85.8% 50
52 Quartile Rankings: Agent Metrics Agent Metric Annual Agent Turnover Daily Agent Absenteeism Agent Occupancy Schedule Adherence New Agent Training Hours Annual Agent Training Hours Agent Tenure (months) Agent Job Satisfaction 1 (Top) Quartile % 32.9% 39.4% 55.4% (Bottom) 32.9% 39.4% 55.4% 68.2% 3.6% 6.1% 7.3% 10.4% 6.1% 7.3% 10.4% 15.5% 94.6% 82.2% 71.9% 66.6% 82.2% 71.9% 66.6% 55.1% 91.5% 87.3% 83.5% 76.4% 87.3% 83.5% 76.4% 60.6% % 89.9% 84.5% 77.4% 89.9% 84.5% 77.4% 67.8% 4 Company XYZ Performance 32.9% 3.6% 88.4% 60.6% % 51
53 Quartile Rankings: Contact Handling and Workload Metrics Contact Handling Metric Inbound Contact Handle Time (minutes) Outbound Contact Handle Time (minutes) Outbound Contacts as a % of Total Contacts User Self-Service Completion Rate 1 (Top) Quartile % 16.8% 21.8% 26.9% 16.8% 21.8% 26.9% 36.6% 29.7% 20.4% 15.0% 4.2% (Bottom) % 15.0% 4.2% 0.0% 4 Company XYZ Performance % 1.9% Workload Metric Inbound Contacts per End User per Month 1 (Top) 2 Quartile (Bottom) Company XYZ Performance
54 The Service Desk Scorecard: An Overview The Service Desk scorecard employs a methodology that provides you with a single, all-inclusive measure of your Service Desk performance. It combines cost, quality, productivity, agent, and service-level metrics into an overall performance indicator for your Service Desk. Your Service Desk score will range between 0 and 100%, and can be compared directly to the scores of other data records in the benchmark. By computing your overall score on a monthly or quarterly basis, you can track and trend your performance over time. Charting and tracking your Service Desk score is an ideal way to ensure continuous improvement in your Service Desk! 53
55 Company XYZ Service Desk Balanced Scorecard Performance Metric Metric Weighting Performance Range Worst Case Best Case Your Actual Performance Metric Score Balanced Score Cost per Inbound Contact 25.0% $32.69 $11.27 $ % 19.9% Customer Satisfaction 25.0% 68.4% 95.1% 85.8% 65.3% 16.3% Agent Utilization 15.0% 32.1% 59.6% 49.3% 62.5% 9.4% Net First Contact Resolution Rate 15.0% 64.8% 88.8% 70.7% 24.6% 3.7% Agent Job Satisfaction 10.0% 67.8% 98.9% 78.2% 33.4% 3.3% Average Speed of Answer (seconds) 10.0% % 8.2% Total 100.0% N/A N/A N/A N/A 60.9% Step 1 Six critical performance metrics have been selected for the scorecard. Step 2 Each metric has been weighted according to its relative importance. Step 3 For each performance metric, the highest and lowest performance levels in the benchmark are recorded. Step 4 Your actual performance for each metric is recorded in this column. Step 5 Your score for each metric is then calculated: (worst case - actual performance) (worst case best case) 100 Step 6 Your balanced score for each metric is calculated: metric score weighting 54
56 Scorecard KPI Performance Spectrum Worst KPI Performance Best KPI Performance Cost/Contact 79.7% Customer Sat. 65.3% Agent Utilization 62.5% Net FCR 24.6% Agent Job Sat. 33.4% ASA 82.4% Balanced Score 60.9% 0% 10% 20% 30% 40% 50% 60% 70% 80% 90% 100% 55
57 Balanced Scores Sample report only. Data is not accurate. Balanced Scorecard Summary 85.0% 80.0% 75.0% 70.0% 65.0% 60.0% 55.0% 50.0% 45.0% 40.0% 35.0% 30.0% 25.0% 20.0% 15.0% 10.0% 5.0% 0.0% Key Statistics Service Desk Scores High 78.3% Average 47.2% Median 46.3% Low 24.8% Company XYZ 60.9% Service Desk *The scores shown in the chart are based upon the performance metrics, weightings, and data ranges shown on the previous page. 56
58 Peer Group Scorecard Summary Data The next two pages illustrate the benchmarking peer group performance for each KPI in the scorecard. Page 58 ranks each Service Desk from best performer (Service Desk #28) to worst performer (Service Desk #17) based upon their balanced scores. Page 59 ranks each KPI in the scorecard from best (top row) to worst (bottom row). 57
59 Overall Ranking Sample report only. Data is not accurate. Scorecard Performance Rankings Average Speed of Answer (seconds) Service Desk Number Cost per Inbound Contact Customer Satisfaction Agent Utilization Net First Contact Resolution Rate Agent Job Satisfaction 1 28 $ % 41.9% 88.8% 98.9% % 2 25 $ % 41.1% 83.5% 98.3% % 3 18 $ % 42.6% 79.8% 92.4% % 4 10 $ % 52.0% 78.2% 97.1% % 5 14 $ % 41.6% 72.7% 91.7% % 6 Company XYZ $ % 49.3% 70.7% 78.2% % 7 20 $ % 59.6% 72.3% 88.1% % 8 3 $ % 45.9% 76.1% 87.7% % 9 16 $ % 54.2% 67.9% 73.1% % 10 1 $ % 51.6% 70.4% 84.5% % $ % 49.5% 70.3% 74.5% % 12 7 $ % 48.7% 70.1% 85.8% % $ % 41.8% 68.3% 80.2% % $ % 48.8% 66.8% 85.4% % $ % 43.6% 69.8% 80.9% % $ % 37.9% 76.7% 90.0% % 17 6 $ % 51.3% 71.2% 80.0% % 18 4 $ % 44.6% 73.5% 91.9% % 19 5 $ % 42.6% 71.1% 81.5% % $ % 41.6% 74.0% 89.9% % 21 2 $ % 39.9% 72.8% 84.8% % $ % 35.6% 75.0% 88.0% % 23 9 $ % 42.2% 65.6% 77.9% % $ % 40.9% 67.1% 74.8% % $ % 33.9% 64.8% 71.1% % $ % 32.8% 67.8% 75.7% % 27 8 $ % 50.4% 66.3% 67.8% % $ % 32.1% 72.7% 77.4% % $ % 40.2% 68.1% 71.7% % Average $ % 44.1% 72.1% 83.4% % Key Statistics Scorecard Metrics Total Balanced Score Max $ % 59.6% 88.8% 98.9% % Min $ % 32.1% 64.8% 67.8% % Median $ % 42.6% 71.1% 84.5% % 58
60 KPI Data in Rank Order Scorecard Metrics Cost per Inbound Customer Net First Contact Agent Job Average Speed of Total Balanced Contact Satisfaction Agent Utilization Resolution Rate Satisfaction Answer (seconds) Score Company XYZ $ % 49.3% 70.7% 78.2% % Ranking Quartile $ % 59.6% 88.8% 98.9% % 2 $ % 54.2% 83.5% 98.3% % 3 $ % 52.0% 79.8% 97.1% % 4 $ % 51.6% 78.2% 92.4% % 5 $ % 51.3% 76.7% 91.9% % 6 $ % 50.4% 76.1% 91.7% % 7 $ % 49.5% 75.0% 90.0% % 8 $ % 49.3% 74.0% 89.9% % 9 $ % 48.8% 73.5% 88.1% % 10 $ % 48.7% 72.8% 88.0% % 11 $ % 45.9% 72.7% 87.7% % 12 $ % 44.6% 72.7% 85.8% % 13 $ % 43.6% 72.3% 85.4% % 14 $ % 42.6% 71.2% 84.8% % 15 $ % 42.6% 71.1% 84.5% % 16 $ % 42.2% 70.7% 81.5% % 17 $ % 41.9% 70.4% 80.9% % 18 $ % 41.8% 70.3% 80.2% % 19 $ % 41.6% 70.1% 80.0% % 20 $ % 41.6% 69.8% 78.2% % 21 $ % 41.1% 68.3% 77.9% % 22 $ % 40.9% 68.1% 77.4% % 23 $ % 40.2% 67.9% 75.7% % 24 $ % 39.9% 67.8% 74.8% % 25 $ % 37.9% 67.1% 74.5% % 26 $ % 35.6% 66.8% 73.1% % 27 $ % 33.9% 66.3% 71.7% % 28 $ % 32.8% 65.6% 71.1% % 29 $ % 32.1% 64.8% 67.8% % Average $ % 44.1% 72.1% 83.4% % Max $ % 59.6% 88.8% 98.9% % Min $ % 32.1% 64.8% 67.8% % Median $ % 42.6% 71.1% 84.5% % 59
61 Cost per Inbound Contact Sample report only. Data is not accurate. Scorecard Metrics: Cost per Inbound Contact $35.00 $30.00 $25.00 Key Statistics Cost per Inbound Contact High $32.69 Average $21.10 Median $20.68 Low $11.27 Company XYZ $15.61 $20.00 $15.00 $10.00 $5.00 $0.00 Service Desk 60
62 Customer Satisfaction Sample report only. Data is not accurate. Scorecard Metrics: Customer Satisfaction 100.0% 90.0% 80.0% Key Statistics Customer Satisfaction High 95.1% Average 79.0% Median 77.5% Low 68.4% Company XYZ 85.8% 70.0% 60.0% 50.0% 40.0% Service Desk 61
63 Agent Utilization Sample report only. Data is not accurate. Scorecard Metrics: Agent Utilization 65.0% 60.0% 55.0% 50.0% 45.0% 40.0% Key Statistics Agent Utilization High 59.6% Average 44.1% Median 42.6% Low 32.1% Company XYZ 49.3% 35.0% 30.0% 25.0% 20.0% 15.0% 10.0% 5.0% 0.0% Service Desk 62
64 Net First Contact Resolution Rate Sample report only. Data is not accurate. Scorecard Metrics: Net First Contact Resolution Rate 90.0% 85.0% 80.0% 75.0% Key Statistics Net First Contact Resolution Rate High 88.8% Average 72.1% Median 71.1% Low 64.8% Company XYZ 70.7% 70.0% 65.0% 60.0% 55.0% 50.0% 45.0% 40.0% Service Desk 63
65 Agent Job Satisfaction Sample report only. Data is not accurate. Scorecard Metrics: Agent Job Satisfaction 100.0% 95.0% 90.0% 85.0% 80.0% Key Statistics Agent Job Satisfaction High 98.9% Average 83.4% Median 84.5% Low 67.8% Company XYZ 78.2% 75.0% 70.0% 65.0% 60.0% 55.0% 50.0% 45.0% 40.0% Service Desk 64
66 Average Speed of Answer (seconds) 160 Sample report only. Data is not accurate. Scorecard Metrics: Average Speed of Answer Key Statistics Average Speed of Answer (seconds) High 134 Average 45 Median 27 Low 18 Company XYZ Service Desk 65
67 Quality (Effectiveness) Sample report only. Data is not accurate. Cost vs. Quality for Company XYZ Service Desk Higher Quality Middle Quartiles Effective but not Efficient Top Quartile Efficient and Effective Company XYZ Global Database Lower Quality Lower Quartile Middle Quartiles Efficient but not Effective Higher Cost Cost (Efficiency) Lower Cost 66
68 Best Practices Process Assessment 67
69 Six-Part Model for Service Desk Best Practices Model Component Definition Strategy Strategy Defining Your Charter and Mission Stakeholder Communication Customer Enthusiasm Human Resources Human Resources Proactive, Life-Cycle Management of Personnel Process Expeditious Delivery of Customer Service Performance Measurement Technology Process Technology Leveraging People and Processes Performance Measurement A Holistic Approach to Performance Measurement Stakeholder Communication Proactively Managing Stakeholder Expectations 68
70 Best Practices Evaluation Criteria Ranking Explanation 1 No Knowledge of the Best Practice. 2 Aware of the Best Practice, but not applying it. 3 Aware of the Best Practice, and applying at a rudimentary level. 4 Best Practice is being effectively applied. 5 Best Practice is being applied in a world-class fashion. 69
71 MetricNet Has Defined 72 Service Desk Best Practices Strategy 7 Best Practices Human Resources 13 Best Practices Process 16 Best Practices Technology Performance Measurement 14 Best Practices Communication 10 Best Practices 12 Best Practices Total Score from 72 to 360 (converted to scale of 0 to 100%) The lowest score possible on the Best Practices Process Assessment is 72: Maturity Level 1 X 72 Best Practices = 72 (0%) The highest score possible on the Best Practices Process Assessment is 360: Maturity Level 5 X 72 Best Practices = 360 (100%) 70
72 Best Practice Sample report only. Data is not accurate. Strategy: 7 Best Practices Strategy Best Practices Defined Company XYZ's Score Peer Group Average The Service Desk has a well-defined mission, vision, and strategy. The vision and strategy are welldocumented, and communicated to key stakeholders in the organization. The Service Desk has a published Service Catalog, including a Supported Products List, that is 2 distributed and communicated to key stakeholders including end users. The Service Catalog is available online. The Service Desk has an action plan for continuous improvement. The plan is documented and 3 distributed to key stakeholders in the organization, and specific individuals are held accountable for implementing the action plan. The Service Desk is well integrated into the information technology function. The service desk acts 4 as the "voice of the user" in IT, and is involved in major IT decisions and deliberations that affect end users. The Service Desk is alerted ahead of time so that they can prepare for major rollouts, or other changes in the IT environment. The Service Desk has SLA's that define the level of service to be delivered to users. The SLA's are documented, published, and communicated to key stakeholders in the organization. The Service Desk has OLA's (Operating Level Agreements) with other support groups in the 6 organization (e.g., level 2 support, desktop support, field support, etc.). The OLA's clearly define the roles and responsibilities of each support group, and the different support groups abide by the terms of the OLA's. The Service Desk actively seeks to improve Level 1 Resolution Rates, First Contact Resolution 7 Rates, Level 0 Resolution Rates (User Self-Help), and Level -1 (Problem Prevention) Resolution Rates by implementing processes, technologies, and training that facilitate these objectives. Summary Statistics Total Score Average Score
73 Best Practice Sample report only. Data is not accurate. Human Resources: 13 Best Practices Human Resources Best Practices Defined Company XYZ's Score Peer Group Average The Service Desk has a formalized and documented recruiting process for filling vacancies. Job requirements are well defined, and candidates are tested for both technical skills, and customer service soft skills. New hires go through a formal training curriculum, including technical and customer service skills, and are required to pass a proficiency exam before independently handling customer contacts. Veteran agents (more than 6 months of experience) have access to training opportunities to improve their skill set, job performance, 3 and the overall performance of the service desk. Veteran agents are required to complete a minimum number of refresher training hours each year. Agent training classes and curricula are specifically designed to maximize customer satisfaction, the number of user inquiries resolved at Level 1, and the number of inquiries resolved on First Contact. 5 Individual agent training plans are clearly defined, documented and regularly updated The service desk has a formalized, documented agent career path. Agents are made aware of their career advancement opportunities, 6 and are encouraged to proactively manage their careers. Agents are coached at least once yearly on their career path and careeradvancement options. Agents have the opportunity to advance their careers in at least two ways: by improving their technical and customer service skills, and by improving their management and supervisory skills. Agents are coached by their supervisor in one-on-one sessions on a monthly basis. Recorded calls are reviewed, and the supervisor provides specific suggestions to each agent on how to improve performance. Agents have quantifiable performance goals (e.g., for call quality, customer satisfaction, number of calls handled per month, etc.), and are held accountable for achieving their goals on a monthly basis. Agents are eligible for incentives and rewards based upon performance. These could include monetary incentives such as annual bonuses, or other incentives such as time off work, gift certificates, etc. 11 Agent performance goals are linked to and aligned with the overall Service Desk goals and performance targets Agent Satisfaction surveys are conducted at least once per year, and the results of the survey are used to manage and improve agent morale. 13 Formal Performance reviews are scheduled and completed for all personnel at least once annually Summary Statistics Total Score Average Score
74 Best Practice Sample report only. Data is not accurate. Process: 16 Best Practices Process Best Practices Defined Company XYZ's Score Peer Group Average 1 The Service Desk is designed as a Single Point of Contact (SPOC) for all IT related problems, issues, and service requests Customers are offered a range of access options to the Service Desk, including live voice, voice mail, , web chat, self-service, fax, and walk-in. Contact handling processes are standardized, documented, and available online. With few exceptions, the standards are followed by the service desk agents. Escalation points are well defined and documented. These include other support groups (e.g., Level 2 support, Deskside Support, etc.), and individuals to whom calls may be escalated. Rules for escalation and call transfer are well defined and documented. Agents know when and where to transfer or route a call if they are unable to assist the user. Indirect contact channels, including , Voice Mail, and Faxes are treated with the same priority as live phone calls and chat sessions. The work queues from these channels are integrated, or worked in parallel. 7 Incoming contacts are assigned a severity code based upon the number of users impacted, and the urgency of the incident System alarms notify the service desk when a service level has been breached, whether at Level 1, or at another support level within the organization. The Service Desk has a formal, rapid notification and correction process that is activated when a service level has been breached, whether at Level 1, or at some other support level. The Service Desk has contingency plans to handle sudden, unexpected spikes in contact volume. These could include having supervisors and other indirect personnel handle incoming calls during a call spike. 11 The Service Desk has contingency plans to handle both short and long term interruptions in service delivery The Service Desk has a well defined service planning and readiness process that works closely with both internal engineering groups 12 and vendors, and continues through product field testing and pre-release. This process enables the Service Desk to train for and prepare for supporting new products and services in the IT environment. The Service Desk has a formal Knowledge Management Process that facilitates the acquisition, qualification, review, approval, and distribution of knowledge into a Knowledgebase. The Service Desk has a mature workforce scheduling process that achieves high agent utilization, while maintaining reasonable service levels. 15 The Service Desk has an effective, ongoing process for projecting future workload and staffing requirements The Service Desk conducts periodic Root Cause Analysis (RCA) on the user contact profile to eliminate problems at their source Summary Statistics Total Score Average Score
75 Best Practice Sample report only. Data is not accurate. Technology: 10 Best Practices Technology Best Practices Defined Company XYZ's Score Peer Group Average The Service Desk has a full-featured incident management system that facilitates effective incident tracking, service level compliance, reporting, and root cause analysis. The Service Desk has a comprehensive knowledge management tool that facilitates effective knowledge capture 2 and re-use. Service desk agents are able to quickly find solutions to user problems by searching the knowledge base. Solutions for the vast majority of user problems and questions can be found in the knowledgebase. The Service Desk knowledgebase is used continuously by all Service Desk agents, and results in higher First Contact and First Level Resolution Rates, and lower contact handle times. The Service Desk has an effective tool that allows agents to proxy into a user's computer, take control of the 4 computer, and remotely perform diagnostics and problem solving (e.g., Tivoli, Bomgar, GoTo Assist, etc.). The tool increases both first contact and first level resolution rates, and reduces contact handle times. The Service Desk has an Automated Password Reset (APR) capability that dramatically reduces the number of password resets that must be performed manually by the Service Desk agents. The Service Desk has an effective, integrated self-service portal that is available to all users. The self-service portal 6 provides information, FAQ's, and solutions to problems that are more complex than simple password resets. The tool includes a direct link to service desk technicians. Users are aware of the self-service portal, and usage rates are continuously increasing. The incident management system can track and monitor the skill levels of Service Desk agents based on closed tickets by product and/or service code. The Service Desk uses technology alerts/alarms to notify the Service Desk or perform self healing scripts when a customer or system issue is proactively identified. 9 The Service Desk has a multi-year plan for an integrated technology strategy The Service Desk utilizes a capital investment justification process based on ROI, and reports on post installation ROI as part of this process. Summary Statistics Total Score Average Score
76 Best Practice Sample report only. Data is not accurate. Performance Measurement: 14 Best Practices Performance Measurement Best Practices Defined Company XYZ's Score Peer Group Average 1 Cost per Contact is measured, recorded, and tracked on an ongoing basis Customer Satisfaction is measured, recorded, and tracked on an ongoing basis First Contact Resolution is measured, recorded, and tracked on an ongoing basis First Level Resolution is measured, recorded, and tracked on an ongoing basis Agent Utilization is measured, recorded, and tracked on an ongoing basis Agent Satisfaction is measured, recorded, and tracked The Service Desk maintains a balanced scorecard that provides a single, all-inclusive measure of service desk performance. The Service Desk tracks the number of incidents that are resolved outside of the Level 1 Service desk (e.g., at Level 2, Desktop Support, etc.) that could have been resolved by the service desk at Level 1. The Service Desk conducts event driven customer surveys whereby the results of customer satisfaction surveys can be linked back to a specific incident, and to a specific agent handling the contact at the service desk. Service Desk measures are used holistically, and diagnostically to identify performance gaps in Service Desk performance, and to prescribe actions that will improve performance. 11 The Service Desk conducts benchmarking at least once per year Service Desk KPI's are used to establish "stretch" goals The Service Desk understands key correlations and cause/effect relationships between the various KPI's. This enables the Service Desk to achieve desired performance goals by leveraging and driving the underlying "causal" metrics. The Service Desk tracks the Mean Time to Resolve (MTR), and the Percentage of tickets resolved within 24, 48, and hours. Summary Statistics Total Score Average Score
77 Best Practice Sample report only. Data is not accurate. Communication: 12 Best Practices Communication Best Practices Defined Company XYZ's Score Peer Group Average The Service Desk maintains active communication with all stakeholder groups, including service desk employees, IT managers, company managers outside of IT, and customers. 2 The Service Desk has a formal communications schedule, and provides customized content for each stakeholder group The Service Desk has established User Group Liaisons who represent different groups within the user community. The Service 3 Desk meets periodically with the liaisons to learn about user concerns and questions, and to communicate Service Desk services, plans, and initiatives. The Service Desk meets frequently with user groups, and holds "informational briefings" to educate users on supported products and services, hours of operation, training opportunities, tips for getting the most benefit from the service desk, etc. The Service Desk meets frequently with other IT managers, and is an integral part of key decisions made within IT. The Service Desk plays the role of "voice of the user" within IT. IT is required to deliver a "turnover package" to the service desk for all changes that will impact the user environment. This could 6 include application updates, new desktop software, etc. The turnover package is designed to prepare the service desk to provide support to users in the affected areas. 7 Customers are told what to expect on resolution time when their ticket is escalated or if a call-back is required The Service Desk monitors all tickets, including those that are escalated, until ticket closure The value added by the service desk is communicated to key managers in IT, and expectations are formally established regarding service desk roles and responsibilities. The Service Desk tracks the number of training related contacts it receives, and provides feedback to user groups within the organization on training areas that could help to reduce service desk contact volumes. The Service Desk provides training aids to users that enable them use the service desk more effectively. These could include login 11 screens with the service desk phone number, chat windows that can be clicked to initiate a real-time chat session, mouse pads imprinted with the service desk IVR menu, etc. The Service Desk transmits outbound messages to users announcing major system and network outages, thereby alerting users 12 about potential problems in the IT environment. These proactive messages help to reduce contact volumes during incidents that impact a large number of users. Summary Statistics Total Score Average Score
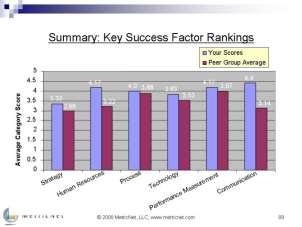
78 Best Practices Process Assessment Summary Best Practices Component Number of Relevant Success Factors Company XYZ's Average Score Average Peer Group Score Strategy Human Resources Process Technology Performance Measurement Communication Total Score Percentage Score 62.0% 48.2% * An average score of 4.0 or above is required in each component of the Best Practices Model to achieve Best Practices Certification. 77
79 Average Score Sample report only. Data is not accurate. 5.0 Best Practices Process Assessment Summary Company XYZ Peer Group 78
80 Total Process Assessment Scores Sample report only. Data is not accurate. Overall Process Assessment Scores 100% 90% 80% 70% 60% 62.0% Key Statistics Total Process Assessment Score High 94.6% Average 48.2% Median 48.5% Low 3.8% Company XYZ 62.0% World-Class 75.0% 50% 40% 30% 20% 10% 0% 79
81 World-Class = 75.0% Balanced Score Average = 48.2% Sample report only. Data is not accurate. Process Maturity vs. Scorecard Performance 100% Company XYZ Performance 90% Process Assessment Score 62.0% Balanced Score 60.9% 80% 70% 60% 50% Average = 47.2% 40% 30% 20% 10% Company XYZ Global Database 0% 0% 10% 20% 30% 40% 50% 60% 70% 80% 90% 100% Process Assessment Score 80
82 ROI Calculations 81
83 ROI from Channel Mix Contact Channel Avg. Monthly Contact Volume Cost per Contact Voice 37,204 $ ,501 $12.49 Web 303 $12.49 Chat 0 $11.86 Walk-Up 18 $23.42 Other 207 $15.61 Self Service 1,008 $2.00 Monthly Total 56,241 $808,760 Annual Total $9,705,114 Estimated Annual Savings vs. Voice Only $829,950 82
84 ROI from Shift Left Average Monthly Contact Volume 55,233 Peer Group 84.0% Net First Level Resolution Rate Company XYZ 81.9% Monthly FLR Ticket Volume vs. Peer Group -1,141 FLR Savings per Ticket $47 Estimated Annual Shift Left Savings -$643,771 83
85 ROI from User Productivity Gains Balanced Scorecard Quartile Performance 1 Industry Average 25.9 Annual Productive Hours Lost per End User Company XYZ 17.1 Productive Hours Returned per End User per Year 8.8 Number of End Users Supported 45,000 Total Productive Hours Returned to End Users 396,000 Annual Working Hours per FTE 1,800 Estimated FTE Savings 220 Estimated Annual Fully Loaded FTE Cost $120,000 Estimated End-User Productivity ROI $26,400,000 84
86 Total Estimated Service Desk ROI is 267% Channel-Mix ROI $829,950 Shift-Left ROI -$643,771 End-User Productivity ROI $26,400,000 Annual Operating Expense $9,894,357 Annual ROI 267% 85
87 Interview Themes and Quotes 86
88 MetricNet Conducted 10 Interviews Company XYZ Interviewees Aaron Bender Christopher Drummond Eric Fletcher Georgia Hansen Irma Jasper Kermit Lefkin Marvin Noonan Oliver Palmer Quentin Rose Shirley Thompson Roles Service Desk Manager Supervisor Supervisor Knowledge Administrator Quality Assurance Analyst Service Desk Agent Service Desk Agent Service Desk Agent Service Desk Agent Service Desk Agent 87
89 Key Themes from the Service Desk Interviews Most interviewees felt that the Service Desk needs more agents to handle the increasing contact volume. Some interviewees expressed the need to have more in-depth training on the applications and programs that are supported. A majority of the interviewees said that overall morale is low. Most interviewees would like to see improved communication between the Service Desk and the other IT groups. The interviewees agreed that finding information within the knowledgebase is difficult, and that this increases the time spent on calls. The interviewees agreed that the service desk s technology is adequate, but several mentioned frustrations with the remote-access tool. The lack of space in the Service Desk department was a concern to many interviewees. 88
90 Representative Comments from the Interviews GENERAL COMMENTS One big strength for our service desk is that we have a good mix of technical expertise and soft skills. Also, a lot of the agents have been with Company XYZ a long time and understand the end-user environment really well. We re very good at building rapport with the users who call in. STAFFING We are understaffed. We are hiring on people as we can, but our call queue is overwhelmed. We re definitely short on agents. There is not a cushion there. If the call volume was manageable, agents would want to stay with Company XYZ longer. Some agents have left the Service Desk due to the overwhelming workload. My biggest concern is staffing. I m concerned that the agents will get burned out. A staffing increase would be helpful. Turnover is probably one of the biggest issues we have, keeping good people. 89
91 Representative Comments from the Interviews STAFFING (continued) The customers would not be waiting in queue for minutes if there were enough agents. The agents on the day shift are completely overwhelmed with the volume of calls. The agents are constantly stressed, tired and exhausted at the end of the day. I feel like having five more agents or so would cover all bases; it would give us a little more time between calls. MORALE Morale is rather low right now; there s been an understaffing problem, the agents feel overworked a lot of the time. Morale is relatively low. It puts a lot of stress on the staff and management to deal with calls waiting all the time, breaks and things have to get shifted around. It s not extremely low, but it s still strained. The Service Desk is not taken seriously as a department. It is hard to prove the worth of the Service Desk in the organization. 90
92 Representative Comments from the Interviews MORALE (continued) On some days where there are outages, and you re on the phone without a break, it can get pretty negative. One or two days are not a big deal, but when it s constant, and when the agents have pressure not to move, some get upset or disgruntled because they can t take their break. The morale feels like the management doesn t understand what the work is like for what they re asking us to do. The request for more staff has been turned down several times. The morale is low because management is sending more work without providing sufficient resources or tools. Overall, on a scale of one to 10, I d probably give morale a three. Mainly it s the demand in productivity. When the call volume is high, the morale goes down and the stress level goes up. I think that there needs to be more acknowledgement of people that are going above and beyond, to bring up morale on the floor. I think morale is kind of down. 91
93 Representative Comments from the Interviews TRAINING I think the training is pretty good. I think we probably need to have more trainers available so we can train more people at the same time, but we recently got another one. The initial training has kind of improved; I m glad they were willing to listen to suggestions. I think the current training process is fantastic; it s definitely improved. We get agents that are efficient before they are set loose on the phones. The length of time we have the agents trained is a good solid amount, and gives them the ability to handle issues on their own better. It s hard to get refresher training. I feel like it should be a little more often, especially with all the changes we ve had. It would be good to have team meetings, just to get some refresher training. More in-depth training in certain applications would help the agents troubleshoot more issues and would result in higher First Call Resolution. 92
94 Representative Comments from the Interviews TRAINING (continued) No one has ever reached out to us and offered to train us more, or assist us with things that I can think of. Training to improve our skillsets, we have no opportunity in that. I think some refresher training every once in a while would be beneficial. There are some ongoing training sessions for the veteran agents, but these are not formalized. There is not a lot of time to pull the agents into any kind of training. Company XYZ does have some online training classes you can choose and do yourself on your own time. When new technologies are introduced, the IT group responsible should train the Service Desk, so that the agents will know what to do when the customers call in with issues. The Service Desk can t afford to have ongoing training for the agents because there are not enough agents on the phones. 93
95 Representative Comments from the Interviews CAREER ADVANCEMENT There are some opportunities that come up depending on when people leave or get promoted. The opportunities are out there. There s not much opportunity for advancement; it s very limited in scope. It s really limited how you can advance here. There s not a lot of opportunities for advancement within the service desk itself. But as far as within the organization, there have been plenty of people who have moved from the service desk to desktop support, for example. MANAGEMENT Many of the averages the management is trying to pass down to the agents, saying it needs to be done in this time, it s unrealistic. People are being rushed too much and do not have time to properly document the incidents. I feel like also the micromanagement is not good. I know they are trying to speed everyone along, keep everyone running as efficiently as possible, but what I ve heard from others is that it s counterproductive. I know that it aggravates a lot of people. 94
96 Representative Comments from the Interviews COMMUNICATION Communication is pretty good. They utilize the system to do correspondence, so as long as you re watching your s you re fine. We can send an or IM to the agents, but they may not see it while they re on the phone. A better dashboard or bulletin-board system would be something helpful, to show common problems. One challenge is not getting information from other teams about changes that will affect us with call volumes. When it comes to planned maintenance, we should be made aware at least the day before. You have some people that communicate well, such as about a patch coming out, etc., but some departments are terrible about communicating. Some groups are great about sending information to our management about changes coming up, but others are more last minute, or we don t get updates until something is down and we re getting calls. 95
97 Representative Comments from the Interviews PROCESSES I would have to say process workflow and documentation are our biggest challenges at the moment. I see a lot of things that are not documented well enough. I d say that our knowledgebase is not the best I ve ever seen out there, but it gives the basics of what we need to do. The knowledgebase is built up to where people can come in and pick up the work after less training than we used to need. Searching the knowledgebase can be a struggle. When solutions are hard to find, it affects the agents ability to have First Call Resolution and it affects the amount of time it takes to resolve issues. This is frustrating for both the agent and the caller. It is difficult to find information in the knowledgebase because those creating the articles call the same thing by different names. A lot of the Service Desk processes are five or six years old. These need to be reviewed and improved upon. 96
98 Representative Comments from the Interviews TECHNOLOGY The tools we have are definitely adequate. I think there is still some room for improvement with the ticketing system. I would say that for the most part all the tools that we have will help us get the job done. I don t think there is any tool out there that would help us a lot. The password reset tool needs to be improved, so that the call can be resolved quickly and agents can accept additional calls. The remote-access tool is a little clunky and slow. Otherwise, most of our tools work well. We often have problems with our remote-access tool. It s usually pretty slow, and it crashes fairly often. WORK ENVIRONMENT Having more space would help reduce the agents stress level. It would be nice to have a bigger and more ventilated workspace. 97
99 Conclusions and Recommendations 98
100 Notable Strengths The Company XYZ Service Desk has a number of notable strengths. Cost per Inbound Contact is lower than the peer-group average (top quartile) Customer Satisfaction is in the top quartile Productivity metrics are well above the peer-group averages Agent Utilization, in particular, is a primary driver of low Cost per Contact Service levels are better than the peer-group averages Company XYZ s Annual Agent Turnover and Daily Agent Absenteeism are lower than the peer-group average The Company XYZ Service Desk scored well above average on the Best Practices Process Assessment Company XYZ scored 6 th out of 29 Service Desks on the Balanced Scorecard Top quartile performance overall! 99
101 But Opportunities for Improvement Remain Company XYZ s Net First Contact Resolution Rate is slightly below average compared to the benchmarking peer group First Contact Resolution is the primary driver of Customer Satisfaction Net First Level Resolution Rate is below the peer-group average A high First Level Resolution Rate helps to minimize total cost of ownership in service and support Annual Agent Training Hours are lower than the peer group average Agent Job Satisfaction is in the third quartile Job Satisfaction is an important secondary driver of many other metrics in the Service Desk, including Cost per Contact and Customer Satisfaction User Self-Service Completion Rate is in the bottom quartile Self-service can represent a significant opportunity for cost savings Interviewees expressed concerns in the following additional areas: Inadequate communication from other groups about upcoming changes Some problems with the remote-access tool 100
102 Summary of Benchmarking Recommendations 1. Take steps to improve Net First Contact Resolution and Net First Level Resolution rates. 2. Consider opportunities to deflect contacts into lower-cost channels, especially self-service. 3. Consider offering additional agent training and documenting a formal career path for the agents. This will help improve Agent Job Satisfaction. 4. Consider adopting the MetricNet Service Desk Balanced Scorecard, and update the scorecard monthly. 5. Establish stretch goals in key areas to improve performance. 6. Refine process maturity in compliance with industry best practices. 101
103 First Level Resolution Impacts TCO Through Shift Left 102
104 Net First Level Resolution Sample report only. Data is not accurate. The Effect of Remote Diagnostic Software on FLR 100.0% 90.0% 80.0% Average = 77.8% FLR 70.0% 60.0% 50.0% Average = 61.4% FLR 40.0% 30.0% 20.0% 10.0% 0.0% Remote Diagnostic Software No Remote Diagnostic Software 103
105 Net First Level Resolution Sample report only. Data is not accurate. The Effect of a Mature Knowledgebase on FLR 100.0% 90.0% 80.0% 70.0% 60.0% 50.0% 40.0% 30.0% 20.0% 10.0% 0.0% KBase Maturity 104
106 First Contact Resolution Rate Sample report only. Data is not accurate. 100% 90% 80% Training Can Improve FCR 70% 60% 50% 40% 30% 20% 10% 0% New Agent Training Hours 105
107 First Contact Resolution Rate Sample report only. Data is not accurate. 100% 90% Training Can Improve FCR (continued) 80% 70% 60% 50% 40% 30% 20% 10% 0% Annual Agent Training Hours 106
108 Develop a Plan to Increase Chat and Self-Help Volumes 107
109 Managing Agent Morale and Job Satisfaction Cost per Contact Customer Satisfaction Agent Utilization First Contact Resolution Scheduling Efficiency Service Levels: ASA and AR Agents/ Total FTE s Absenteeism/ Turnover First Level Resolution Handle Time Call Quality Agent Satisfaction Coaching Career Path Training Hours 108
110 Agent Job Satisfaction Sample report only. Data is not accurate. 100% Career Path is One Driver of Agent Job Satisfaction 90% 80% Average = 80.7% 70% Average = 72.3% 60% 50% 40% Agent Satisfaction with Career Path Agent Satisfaction without Career Path 109
111 Agent Satisfaction Sample report only. Data is not accurate. Training Hours Drive Agent Job Satisfaction 100% 90% 80% 70% 60% 50% 40% Annual Agent Training Hours 110
112 Consider Adopting the Service Desk Balanced Scorecard Performance Metric Metric Weighting Performance Range Worst Case Best Case Your Actual Performance Metric Score Balanced Score Cost per Inbound Contact 25.0% $32.69 $11.27 $ % 19.9% Customer Satisfaction 25.0% 68.4% 95.1% 85.8% 65.3% 16.3% Agent Utilization 15.0% 32.1% 59.6% 49.3% 62.5% 9.4% Net First Contact Resolution Rate 15.0% 64.8% 88.8% 70.7% 24.6% 3.7% Agent Job Satisfaction 10.0% 67.8% 98.9% 78.2% 33.4% 3.3% Average Speed of Answer (seconds) 10.0% % 8.2% Total 100.0% N/A N/A N/A N/A 60.9% Step 1 Six critical performance metrics have been selected for the scorecard. Step 2 Each metric has been weighted according to its relative importance. Step 3 For each performance metric, the highest and lowest performance levels in the benchmark are recorded. Step 4 Your actual performance for each metric is recorded in this column. Step 5 Your score for each metric is then calculated: (worst case - actual performance) (worst case best case) 100 Step 6 Your balanced score for each metric is calculated: metric score weighting 111
113 Balanced Score Sample report only. Data is not accurate. And Updating the Scorecard Monthly 85% 80% 75% 70% 65% 60% 55% 50% 45% 40% Jan Feb Mar Apr May Jun Jul Aug Sep Oct Nov Dec 12 Month Average Monthly Score * Sample Only 112
114 Some Suggested Performance Targets Performance Metric Current Company XYZ Performance Target Performance Net First Level Resolution Rate 81.9% 85.0% Net First Contact Resolution Rate 70.7% 75.0% Annual Agent Training Hours 7 16 User Self-Service Completion Rate 1.9% 12.0% Agent Job Satisfaction 78.2% 85.0% Balanced Score 60.9% 65.8% 113
115 Cause-and-Effect for Service Desk KPI s Cost per Contact Customer Satisfaction Agent Utilization First Contact Resolution Scheduling Efficiency Service Levels: ASA and AR Agents/ Total FTE s Absenteeism/ Turnover First Level Resolution Handle Time Call Quality Agent Satisfaction Coaching Career Path Training Hours 114
116 World-Class = 75.0% Balanced Score Average = 48.2% Sample report only. Data is not accurate. Company XYZ Can Improve Process Maturity Over Time 100% Company XYZ Performance 90% Process Assessment Score 62.0% Balanced Score 60.9% 80% 70% 60% 50% Average = 47.2% 40% 30% 20% 10% Company XYZ Global Database 0% 0% 10% 20% 30% 40% 50% 60% 70% 80% 90% 100% Process Assessment Score 115
117 Process Maturity Focus Area: Strategy Strategy Best Practices Defined The Service Desk has a well-defined mission, vision, and strategy. The vision and strategy are well-documented, and communicated to key stakeholders in the organization. The Service Desk has an action plan for continuous improvement. The plan is documented and distributed to key stakeholders in the organization, and specific individuals are held accountable for implementing the action plan. The Service Desk is well integrated into the information technology function. The service desk acts as the "voice of the user" in IT, and is involved in major IT decisions and deliberations that affect end users. The Service Desk is alerted ahead of time so that they can prepare for major rollouts, or other changes in the IT environment. The Service Desk has a published Service Catalog, including a Supported Products List, that is distributed and communicated to key stakeholders including end users. The Service Catalog is available online. The Service Desk actively seeks to improve Level 1 Resolution Rates, First Contact Resolution Rates, Level 0 Resolution Rates (User Self-Help), and Level -1 (Problem Prevention) Resolution Rates by implementing processes, technologies, and training that facilitate these objectives. The Service Desk has OLA's (Operating Level Agreements) with other support groups in the organization (e.g., level 2 support, desktop support, field support, etc.). The OLA's clearly define the roles and responsibilities of each support group, and the different support groups abide by the terms of the OLA's. The Service Desk has SLA's that define the level of service to be delivered to users. The SLA's are documented, published, and communicated to key stakeholders in the organization. Company XYZ's Score
118 Process Maturity Focus Area: Human Resources Human Resources Best Practices Defined Individual agent training plans are clearly defined, documented and regularly updated. Veteran agents (more than 6 months of experience) have access to training opportunities to improve their skill set, job performance, and the overall performance of the service desk. Veteran agents are required to complete a minimum number of refresher training hours each year. The service desk has a formalized, documented agent career path. Agents are made aware of their career advancement opportunities, and are encouraged to proactively manage their careers. Agents are coached at least once yearly on their career path and career-advancement options. Agent Satisfaction surveys are conducted at least once per year, and the results of the survey are used to manage and improve agent morale. Agents have the opportunity to advance their careers in at least two ways: by improving their technical and customer service skills, and by improving their management and supervisory skills. The Service Desk has a formalized and documented recruiting process for filling vacancies. Job requirements are well defined, and candidates are tested for both technical skills, and customer service soft skills. Agent training classes and curricula are specifically designed to maximize customer satisfaction, the number of user inquiries resolved at Level 1, and the number of inquiries resolved on First Contact. Agents are eligible for incentives and rewards based upon performance. These could include monetary incentives such as annual bonuses, or other incentives such as time off work, gift certificates, etc. Agent performance goals are linked to and aligned with the overall Service Desk goals and performance targets. New hires go through a formal training curriculum, including technical and customer service skills, and are required to pass a proficiency exam before independently handling customer contacts. Agents are coached by their supervisor in one-on-one sessions on a monthly basis. Recorded calls are reviewed, and the supervisor provides specific suggestions to each agent on how to improve performance. Agents have quantifiable performance goals (e.g., for call quality, customer satisfaction, number of calls handled per month, etc.), and are held accountable for achieving their goals on a monthly basis. Formal Performance reviews are scheduled and completed for all personnel at least once annually. Company XYZ's Score
119 Process Maturity Focus Area: Process Process Best Practices Defined The Service Desk has a formal Knowledge Management Process that facilitates the acquisition, qualification, review, approval, and distribution of knowledge into a Knowledgebase. The Service Desk conducts periodic Root Cause Analysis (RCA) on the user contact profile to eliminate problems at their source. The Service Desk has a formal, rapid notification and correction process that is activated when a service level has been breached, whether at Level 1, or at some other support level. The Service Desk has a well defined service planning and readiness process that works closely with both internal engineering groups and vendors, and continues through product field testing and pre-release. This process enables the Service Desk to train for and prepare for supporting new products and services in the IT environment. System alarms notify the service desk when a service level has been breached, whether at Level 1, or at another support level within the organization. The Service Desk has an effective, ongoing process for projecting future workload and staffing requirements. Customers are offered a range of access options to the Service Desk, including live voice, voice mail, , web chat, self-service, fax, and walk-in. Contact handling processes are standardized, documented, and available online. With few exceptions, the standards are followed by the service desk agents. Escalation points are well defined and documented. These include other support groups (e.g., Level 2 support, Deskside Support, etc.), and individuals to whom calls may be escalated. Rules for escalation and call transfer are well defined and documented. Agents know when and where to transfer or route a call if they are unable to assist the user. Indirect contact channels, including , Voice Mail, and Faxes are treated with the same priority as live phone calls and chat sessions. The work queues from these channels are integrated, or worked in parallel. The Service Desk has contingency plans to handle sudden, unexpected spikes in contact volume. These could include having supervisors and other indirect personnel handle incoming calls during a call spike. The Service Desk has contingency plans to handle both short and long term interruptions in service delivery. The Service Desk has a mature workforce scheduling process that achieves high agent utilization, while maintaining reasonable service levels. The Service Desk is designed as a Single Point of Contact (SPOC) for all IT related problems, issues, and service requests. Incoming contacts are assigned a severity code based upon the number of users impacted, and the urgency of the incident. Company XYZ's Score
120 Process Maturity Focus Area: Technology Technology Best Practices Defined The Service Desk utilizes a capital investment justification process based on ROI, and reports on post installation ROI as part of this process. The Service Desk has an Automated Password Reset (APR) capability that dramatically reduces the number of password resets that must be performed manually by the Service Desk agents. The Service Desk has an effective, integrated self-service portal that is available to all users. The self-service portal provides information, FAQ's, and solutions to problems that are more complex than simple password resets. The tool includes a direct link to service desk technicians. Users are aware of the self-service portal, and usage rates are continuously increasing. The Service Desk uses technology alerts/alarms to notify the Service Desk or perform self healing scripts when a customer or system issue is proactively identified. The Service Desk has a comprehensive knowledge management tool that facilitates effective knowledge capture and reuse. Service desk agents are able to quickly find solutions to user problems by searching the knowledge base. Solutions for the vast majority of user problems and questions can be found in the knowledgebase. The Service Desk knowledgebase is used continuously by all Service Desk agents, and results in higher First Contact and First Level Resolution Rates, and lower contact handle times. The Service Desk has an effective tool that allows agents to proxy into a user's computer, take control of the computer, and remotely perform diagnostics and problem solving (e.g., Tivoli, Bomgar, GoTo Assist, etc.). The tool increases both first contact and first level resolution rates, and reduces contact handle times. The incident management system can track and monitor the skill levels of Service Desk agents based on closed tickets by product and/or service code. The Service Desk has a multi-year plan for an integrated technology strategy. The Service Desk has a full-featured incident management system that facilitates effective incident tracking, service level compliance, reporting, and root cause analysis. Company XYZ's Score
121 Process Maturity Focus Area: Performance Measurement Agent Satisfaction is measured, recorded, and tracked. Performance Measurement Best Practices Defined Company XYZ's Score 2.0 The Service Desk maintains a balanced scorecard that provides a single, all-inclusive measure of service desk performance. Cost per Contact is measured, recorded, and tracked on an ongoing basis. Agent Utilization is measured, recorded, and tracked on an ongoing basis. The Service Desk understands key correlations and cause/effect relationships between the various KPI's. This enables the Service Desk to achieve desired performance goals by leveraging and driving the underlying "causal" metrics. The Service Desk tracks the Mean Time to Resolve (MTR), and the Percentage of tickets resolved within 24, 48, and 72 hours. First Contact Resolution is measured, recorded, and tracked on an ongoing basis. First Level Resolution is measured, recorded, and tracked on an ongoing basis. The Service Desk tracks the number of incidents that are resolved outside of the Level 1 Service desk (e.g., at Level 2, Desktop Support, etc.) that could have been resolved by the service desk at Level 1. The Service Desk conducts benchmarking at least once per year. Service Desk KPI's are used to establish "stretch" goals. Customer Satisfaction is measured, recorded, and tracked on an ongoing basis. The Service Desk conducts event driven customer surveys whereby the results of customer satisfaction surveys can be linked back to a specific incident, and to a specific agent handling the contact at the service desk. Service Desk measures are used holistically, and diagnostically to identify performance gaps in Service Desk performance, and to prescribe actions that will improve performance
122 Process Maturity Focus Area: Communication Communication Best Practices Defined The Service Desk maintains active communication with all stakeholder groups, including service desk employees, IT managers, company managers outside of IT, and customers. Company XYZ's Score 2.0 The Service Desk has a formal communications schedule, and provides customized content for each stakeholder group. The Service Desk tracks the number of training related contacts it receives, and provides feedback to user groups within the organization on training areas that could help to reduce service desk contact volumes. The Service Desk has established User Group Liaisons who represent different groups within the user community. The Service Desk meets periodically with the liaisons to learn about user concerns and questions, and to communicate Service Desk services, plans, and initiatives. The Service Desk meets frequently with user groups, and holds "informational briefings" to educate users on supported products and services, hours of operation, training opportunities, tips for getting the most benefit from the service desk, etc. The Service Desk meets frequently with other IT managers, and is an integral part of key decisions made within IT. The Service Desk plays the role of "voice of the user" within IT. IT is required to deliver a "turnover package" to the service desk for all changes that will impact the user environment. This could include application updates, new desktop software, etc. The turnover package is designed to prepare the service desk to provide support to users in the affected areas. Customers are told what to expect on resolution time when their ticket is escalated or if a call-back is required. The value added by the service desk is communicated to key managers in IT, and expectations are formally established regarding service desk roles and responsibilities. The Service Desk provides training aids to users that enable them use the service desk more effectively. These could include login screens with the service desk phone number, chat windows that can be clicked to initiate a real-time chat session, mouse pads imprinted with the service desk IVR menu, etc. The Service Desk monitors all tickets, including those that are escalated, until ticket closure. The Service Desk transmits outbound messages to users announcing major system and network outages, thereby alerting users about potential problems in the IT environment. These proactive messages help to reduce contact volumes during incidents that impact a large number of users
123 Detailed Benchmarking Comparisons 122
124 Cost Metrics 123
125 Definition Cost Metrics: Cost per Inbound Contact Cost per Inbound Contact is the total annual operating expense of the Service Desk divided by the annual inbound contact volume of the Service Desk. Operating expense includes all employee salaries, overtime pay, benefits, and incentive compensation, plus all contractor, facilities, telecom, desktop computing, software licensing, training, travel, office supplies, and miscellaneous expenses. Contact volume includes inbound contacts from all sources: live voice, voic , , web chat, fax, walk-in, etc. Why it s Important Cost per Inbound Contact is one of the most important Service Desk metrics. It is a measure of how efficiently your Service Desk conducts its business. A higher-than-average Cost per Contact is not necessarily a bad thing, particularly if accompanied by higher-than-average quality levels. Conversely, a low Cost per Contact is not necessarily good, particularly if the low cost is achieved by sacrificing Call Quality or service levels. Every Service Desk should track and trend Cost per Inbound Contact on a monthly basis. Key Correlations Cost per Inbound Contact is strongly correlated with the following metrics: Agent Utilization Net First Contact Resolution Rate Inbound Contact Handle Time User Self-Service Completion Rate Average Speed of Answer 124
126 Cost per Inbound Contact Sample report only. Data is not accurate. Cost Metrics: Cost per Inbound Contact $35.00 $30.00 $25.00 Key Statistics Cost per Inbound Contact High $32.69 Average $21.10 Median $20.68 Low $11.27 Company XYZ $15.61 $20.00 $15.00 $10.00 $5.00 $0.00 Service Desk 125
127 Cost Metrics: Cost per Minute of Inbound Handle Time Definition Cost per Minute of Inbound Handle Time is simply the Cost per Contact divided by the average Inbound Contact Handle Time. The average Inbound Contact Handle Time includes all inbound contacts: live voice, voic , , web chat, fax, walk-in, etc. Why it s Important Unlike Cost per Inbound Contact, which does not take into account the Contact Handle Time or call complexity, Cost per Minute of Inbound Handle Time measures the per-minute cost of providing customer support. It enables a more direct comparison of costs between Service Desks because it is independent of the types of contacts that come into the Service Desk and the complexity of those contacts. Key Correlations Cost per Minute of Inbound Handle Time is strongly correlated with the following metrics: Agent Utilization Net First Contact Resolution Rate User Self-Service Completion Rate Average Speed of Answer Outbound Contacts as a % of Total Contacts 126
128 Cost per Minute of Inbound Handle Time Sample report only. Data is not accurate. Cost Metrics: Cost per Minute of Inbound Handle Time $3.50 $3.00 $2.50 $2.00 Key Statistics Cost per Minute of Inbound Handle Time High $2.93 Average $2.00 Median $1.99 Low $1.33 Company XYZ $1.52 $1.50 $1.00 $0.50 $0.00 Service Desk 127
129 Cost Metrics: Net First Level Resolution Rate Definition Net First Level Resolution Rate is the number of incidents actually resolved at the Service Desk, divided by the number of incidents that could potentially be resolved at the Service Desk. Any incident that is pushed out to another support level (Desktop Support, Level 2 IT support, Vendor Support, etc.) is, by definition, not resolved at Level 1. Incidents than cannot be resolved at Level 1, such as hardware failures, do not count in the denominator of the Net First Level Resolution Rate. MetricNet groups this with the cost metrics since it has a strong impact on Total Cost of Ownership for end-user support. Why it s Important Net First Level Resolution is a measure of the Service Desk s overall competency, and is a proxy for Total Cost of Ownership (TCO). A high First Level Resolution Rate helps to minimize TCO because each contact that is resolved at Level 1 avoids a higher cost of resolution at Level n (IT, Desktop Support, Vendor Support, etc.). Service Desks can improve their Net First Level Resolution Rates through training and through investments in technologies such as remote diagnostic tools and knowledge-management systems. Key Correlations Net First Level Resolution Rate is strongly correlated with the following metrics: Net First Contact Resolution Rate New Agent Training Hours Annual Agent Training Hours Cost per Inbound Contact Total Cost of Ownership 128
130 Net First Level Resolution Rate Sample report only. Data is not accurate. Cost Metrics: Net First Level Resolution Rate 95.0% 90.0% 85.0% Key Statistics Net First Level Resolution Rate High 91.1% Average 84.0% Median 83.9% Low 68.9% Company XYZ 81.9% 80.0% 75.0% 70.0% 65.0% 60.0% Service Desk 129
131 Productivity Metrics 130
132 Productivity Metrics: Inbound Contacts per Agent per Month Definition Inbound Contacts per Agent per Month is the average monthly inbound contact volume divided by the average Full Time Equivalent (FTE) agent headcount. Contact volume includes contacts from all sources: live voice, voic , , web chat, fax, walk-in, etc. Agent headcount is the average FTE number of employees and contractors handling customer contacts. Why it s Important Inbound Contacts per Agent per Month is an important indicator of agent productivity. A low number could indicate low Agent Utilization, poor scheduling efficiency or schedule adherence, or a higherthan-average Contact Handle Time. Conversely, a high number of inbound contacts per agent may indicate high Agent Utilization, good scheduling efficiency and schedule adherence, or a lower-thanaverage Contact Handle Time. Every Service Desk should track and trend this metric on a monthly basis. Key Correlations Inbound Contacts per Agent per Month is strongly correlated with the following metrics: Agent Utilization Inbound Contact Handle Time Cost per Inbound Contact Cost per Minute of Inbound Handle Time Agent Occupancy Average Speed of Answer 131
133 Inbound Contacts per Agent per Month Sample report only. Data is not accurate. Productivity Metrics: Inbound Contacts per Agent per Month Key Statistics Inbound Contacts per Agent per Month High 631 Average 399 Median 384 Low 267 Company XYZ Service Desk 132
134 Productivity Metrics: Outbound Contacts per Agent per Month Definition Outbound Contacts per Agent per Month is the average monthly outbound contact volume divided by the average Full Time Equivalent (FTE) agent headcount. Outbound contacts can include callbacks to customers who have left voice messages or sent s, or callbacks to deliver information and solutions to customers who had previously called in. Agent headcount is the average FTE number of employees and contractors handling customer contacts. Why it s Important While Outbound Contacts per Agent per Month is technically a productivity metric, it s most important as an indicator of Service Desk effectiveness (quality of performance). The most effective Service Desks have high Net First Contact Resolution Rates and therefore have low outbound call volumes. Key Correlations Outbound Contacts per Agent per Month is strongly correlated with the following metrics: Net First Contact Resolution Rate Customer Satisfaction Cost per Inbound Contact Cost per Minute of Inbound Handle Time Agent Utilization 133
135 Outbound Contacts per Agent per Month Sample report only. Data is not accurate. Productivity Metrics: Outbound Contacts per Agent per Month Key Statistics Outbound Contacts per Agent per Month High 211 Average 104 Median 95 Low 10 Company XYZ Service Desk 134
136 Definition Productivity Metrics: Agent Utilization Agent Utilization is the average time that an agent spends handling both inbound and outbound contacts per month, divided by the number of work hours in a given month. The calculation for Agent Utilization is shown on the next page. Why it s Important Agent Utilization is the single most important indicator of agent productivity. It measures the percentage of time that the average agent is in work mode, and is independent of Contact Handle Time or call complexity. Key Correlations Agent Utilization is strongly correlated with the following metrics: Inbound Contacts per Agent per Month Cost per Inbound Contact Cost per Minute of Inbound Handle Time Agent Occupancy Average Speed of Answer 135
137 Agent Utilization Defined Agent Utilization = ((Average number of inbound calls handled by an agent in a month) X (Average inbound handle time in minutes) + (Average number of outbound calls handled by an agent in a month) X (Average outbound handle time in minutes)) (Average number of days worked in a month) X (Number of work hours in a day) X (60 minutes/hr) Agent Utilization is a measure of the actual time that agents spend providing direct customer support in a month, divided by total time at work during the month. It takes into account both inbound and outbound contacts of all types handled by the agents. But it does not make adjustments for sick days, holidays, training time, project time, or idle time. By calculating Agent Utilization in this way, all Service Desks worldwide are measured in exactly the same way, and can therefore be directly compared for benchmarking purposes. 136
138 Example: Service Desk Agent Utilization Inbound Contacts per Agent per Month = 375 Outbound Contacts per Agent per Month = 225 Average Inbound Contact Handle Time = 10 minutes Average Outbound Contact Handle Time = 5 minutes Agent Utilization = ((Average number of inbound calls handled by an agent in a month) X (Average inbound handle time in minutes) + (Average number of outbound calls handled by an agent in a month) X (Average outbound handle time in minutes)) (Average number of days worked in a month) X (Number of work hours in a day) X (60 minutes/hr) Agent Utilization ((375 Inbound Contacts per Month) X (10 minutes) + (225 Outbound Contacts per Month) X (5 minutes) = = (21.5 work days per month) X (7.5 work hours per day) X (60 minutes/hr) 50.4% Agent Utilization 137
139 Agent Utilization Sample report only. Data is not accurate. Productivity Metrics: Agent Utilization 65.0% 60.0% 55.0% 50.0% 45.0% 40.0% Key Statistics Agent Utilization High 59.6% Average 44.1% Median 42.6% Low 32.1% Company XYZ 49.3% 35.0% 30.0% 25.0% 20.0% 15.0% 10.0% 5.0% 0.0% Service Desk 138
140 Productivity Metrics: Agents as a % of Total Headcount Definition This metric is the average Full Time Equivalent (FTE) agent headcount divided by the average total Service Desk headcount. It is expressed as a percentage, and represents the percentage of total Service Desk personnel who are engaged in direct customer service activities. Headcount includes both employees and contractors. Why it s Important The agent headcount as a percentage of total Service Desk headcount is an important measure of management and overhead efficiency. Since non-agents include both management and nonmanagement personnel (such as supervisors and team leads, QA/QC, trainers, etc.), this metric is not a pure measure of management span of control. But it is a more useful metric than management span of control because the denominator of this ratio takes into account all personnel that are not directly engaged in customer service activities. Key Correlations Agents as a % of Total Headcount is strongly correlated with the following metrics: Cost per Inbound Contact Cost per Minute of Inbound Handle Time 139
141 Agents as a % of Total Headcount Sample report only. Data is not accurate. Productivity Metrics: Agents as a % of Total Headcount 85.0% 80.0% Key Statistics Agents as a % of Total Headcount High 83.4% Average 75.0% Median 74.9% Low 66.4% Company XYZ 83.4% 75.0% 70.0% 65.0% 60.0% Service Desk 140
142 Service Level Metrics 141
143 Service Level Metrics: Average Speed of Answer Definition Average Speed of Answer (ASA) is the total wait time that callers are in queue, divided by the number of calls handled. This includes calls handled by an Interactive Voice Response (IVR) system, as well as calls handled by live agents. Most Automatic Call Distributor (ACD) systems measure this number. Why it s Important ASA is a common service-level metric in the Service Desk industry. It indicates how responsive a Service Desk is to incoming calls. Since most Service Desks have an ASA service-level target, the ASA is tracked to ensure service-level compliance. Key Correlations Average Speed of Answer is strongly correlated with the following metrics: Call Abandonment Rate % of Calls Answered in 30 Seconds Agent Utilization 142
144 Average Speed of Answer (seconds) Sample report only. Data is not accurate. Service Level Metrics: Average Speed of Answer Key Statistics Average Speed of Answer (seconds) High 134 Average 45 Median 27 Low 18 Company XYZ Service Desk 143
145 Service Level Metrics: % of Calls Answered in 30 Seconds Definition This metric is fairly self-explanatory. It is the percentage of all inbound calls that are answered by a live agent within 30 seconds. For those who don t track this exact metric, but track a similar metric such as % of Calls Answered in 60 Seconds, MetricNet uses a conversion formula to calculate the equivalent percentage of calls answered within 30 seconds. Why it s Important % of Calls Answered in 30 Seconds is a common service-level metric in the Service Desk industry. It indicates how responsive a Service Desk is to incoming calls. Many Service Desks have a servicelevel target for % of Calls Answered in 30 Seconds, so the metric is tracked to ensure service-level compliance. Key Correlations The Percentage of Calls Answered Within 30 Seconds is strongly correlated with the following metrics: Average Speed of Answer Call Abandonment Rate Agent Utilization 144
146 % of Calls Answered in 30 Seconds Sample report only. Data is not accurate. Service Level Metrics: % of Calls Answered in 30 Seconds 90.0% 80.0% 70.0% 60.0% Key Statistics % of Calls Answered in 30 Seconds High 84.0% Average 47.2% Median 53.0% Low 11.9% Company XYZ 84.0% 50.0% 40.0% 30.0% 20.0% 10.0% 0.0% Service Desk 145
147 Service Level Metrics: Call Abandonment Rate Definition Call Abandonment Rate is the percentage of calls that were connected to the ACD, but were disconnected by the caller before reaching an agent or before completing a process within the IVR. Why it s Important Call Abandonment Rate is a common service-level metric in the Service Desk industry. An abandoned call indicates that a caller gave up and hung up the phone before receiving service from a live agent or from the IVR. Since most Service Desks have an abandonment-rate service-level target, the Call Abandonment Rate is tracked to ensure service-level compliance. Key Correlations Call Abandonment Rate is strongly correlated with the following metrics: Average Speed of Answer % of Calls Answered in 30 Seconds Agent Utilization 146
148 Call Abandonment Rate Sample report only. Data is not accurate. Service Level Metrics: Call Abandonment Rate 16.0% 14.0% 12.0% 10.0% Key Statistics Call Abandonment Rate High 14.6% Average 4.3% Median 3.1% Low 1.6% Company XYZ 3.5% 8.0% 6.0% 4.0% 2.0% 0.0% Service Desk 147
149 Quality Metrics 148
150 Quality Metrics: Call Quality Definition Although there is no consistent methodology for measuring Call Quality in the Service Desk industry, most Service Desks have developed their own scoring system for grading the quality of a call. Most will measure call quality on a scale of zero to 100%, and evaluate such things as agent courtesy, professionalism, empathy, timeliness of resolution, quality of resolution, adherence to the script, etc. Why it s Important Call Quality is the foundation of Customer Satisfaction. Good Call Quality takes into account agent knowledge and expertise, call efficiency (i.e., call handle time), and agent courtesy and professionalism. Unless Call Quality is consistently high, it is difficult to achieve consistently high levels of Customer Satisfaction. When measured properly, Call Quality and Customer Satisfaction should track fairly closely. Key Correlations Call Quality is strongly correlated with the following metrics: Customer Satisfaction Net First Contact Resolution Rate New Agent Training Hours Annual Agent Training Hours 149
151 Call Quality Sample report only. Data is not accurate. Quality Metrics: Call Quality 100.0% 95.0% 90.0% 85.0% Key Statistics Call Quality High 96.8% Average 85.2% Median 85.2% Low 68.7% Company XYZ 87.4% 80.0% 75.0% 70.0% 65.0% 60.0% Service Desk 150
152 Quality Metrics: Net First Contact Resolution Rate Definition Net First Contact Resolution (FCR) applies only to live (telephone) contacts. It is a percentage, equal to the number of inbound calls that are resolved on the first interaction with the customer, divided by all calls that are potentially resolvable on first contact. Calls that involve a customer callback, or are otherwise unresolved on the first contact for any reason, do not qualify for Net First Contact Resolution. Calls that cannot be resolved on first contact, such as a hardware break/fix, are not included in the denominator of Net First Contact Resolution Rate. Some Service Desks include in their FCR Rate by considering an resolved on first contact if the customer receives a resolution within one hour of submitting the . Why it s Important Net First Contact Resolution is the single biggest driver of Customer Satisfaction. A high Net FCR Rate is almost always associated with high levels of Customer Satisfaction. Service Desks that emphasize training (i.e., high training hours for new and veteran agents) and have good technology tools, such as remote diagnostic capability and knowledge management, generally enjoy a higher-than-average Net FCR Rate. Key Correlations Net First Contact Resolution is strongly correlated with the following metrics: Customer Satisfaction Net First Level Resolution Rate New Agent Training Hours Annual Agent Training Hours Inbound Contact Handle Time 151
153 Net First Contact Resolution Rate Sample report only. Data is not accurate. Quality Metrics: Net First Contact Resolution Rate 90.0% 85.0% 80.0% 75.0% Key Statistics Net First Contact Resolution Rate High 88.8% Average 72.1% Median 71.1% Low 64.8% Company XYZ 70.7% 70.0% 65.0% 60.0% 55.0% 50.0% 45.0% 40.0% Service Desk 152
154 Quality Metrics: Customer Satisfaction Definition Customer Satisfaction is the percentage of customers who are either satisfied or very satisfied with their Service Desk experience. This metric can be captured in a numbers of ways, including automatic after-call IVR surveys, follow-up outbound (live-agent) calls, surveys, postal surveys, etc. Why it s Important Customer Satisfaction is the single most important measure of Service Desk quality. Any successful Service Desk will have consistently high Customer Satisfaction ratings. Some are under the impression that a low Cost per Contact may justify a lower level of Customer Satisfaction. But this is not true. MetricNet s research shows that even Service Desks with a very low Cost per Contact can achieve consistently high Customer Satisfaction ratings. Key Correlations Customer Satisfaction is strongly correlated with the following metrics: Net First Contact Resolution Rate Call Quality 153
155 Customer Satisfaction Sample report only. Data is not accurate. Quality Metrics: Customer Satisfaction 100.0% 90.0% 80.0% Key Statistics Customer Satisfaction High 95.1% Average 79.0% Median 77.5% Low 68.4% Company XYZ 85.8% 70.0% 60.0% 50.0% 40.0% Service Desk 154
156 Agent Metrics 155
157 Definition Agent Metrics: Annual Agent Turnover Annual Agent Turnover is the average percentage of agents that leave the Service Desk, for any reason (voluntarily or involuntarily), in a year. Why it s Important Agent turnover is costly. Each time an agent leaves the Service Desk, a new agent needs to be hired to replace the outgoing agent. This results in costly recruiting, hiring, and training expenses. Additionally, it is typically several weeks or even months before an agent is fully productive, so there is lost productivity associated with agent turnover as well. High agent turnover is generally associated with low agent morale in a Service Desk. Key Correlations Annual Agent Turnover is strongly correlated with the following metrics: Daily Agent Absenteeism Annual Agent Training Hours Customer Satisfaction Net First Contact Resolution Rate Cost per Inbound Contact Agent Job Satisfaction 156
158 Annual Agent Turnover Sample report only. Data is not accurate. Agent Metrics: Annual Agent Turnover 80.0% 70.0% 60.0% 50.0% Key Statistics Annual Agent Turnover High 68.2% Average 41.6% Median 39.4% Low 14.3% Company XYZ 32.9% 40.0% 30.0% 20.0% 10.0% 0.0% Service Desk 157
159 Definition Agent Metrics: Daily Agent Absenteeism Daily Agent Absenteeism is the average percentage of agents with an unexcused absence on any given day. It is calculated by dividing the average number of unexcused absent agents per day by the average total number of agents per day that are scheduled to be at work. Why it s Important High Agent Absenteeism is problematic because it makes it difficult for a Service Desk to schedule resources efficiently. High absenteeism can severely harm a Service Desk s operating performance and increase the likelihood that service-level targets will be missed. A Service Desk s Average Speed of Answer and Call Abandonment Rate typically suffer when absenteeism is high. Also, chronically high absenteeism is often a sign of low agent morale. Key Correlations Daily Agent Absenteeism is strongly correlated with the following metrics: Annual Agent Turnover Agent Job Satisfaction Agent Utilization Cost per Inbound Contact Inbound Contacts per Agent per Month 158
160 Daily Agent Absenteeism Sample report only. Data is not accurate. Agent Metrics: Daily Agent Absenteeism 18.0% 16.0% 14.0% 12.0% Key Statistics Daily Agent Absenteeism High 15.5% Average 8.4% Median 7.3% Low 3.6% Company XYZ 3.6% 10.0% 8.0% 6.0% 4.0% 2.0% 0.0% Service Desk 159
161 Agent Metrics: Agent Occupancy Definition Agent Occupancy is a percentage, equal to the amount of time that an agent is in his or her seat and connected to the ACD and either engaged in a call or ready to answer a call, divided by the agent s total number of hours at work (excluding break time and lunch time). Why it s Important Agent Occupancy is an indirect measure of agent productivity and Agent Schedule Adherence. High levels of Agent Occupancy indicate an orderly, disciplined work environment. Conversely, low levels of Agent Occupancy are often accompanied by a chaotic, undisciplined work environment. Agent Occupancy and Agent Utilization are sometimes confused. Although Agent Occupancy and Agent Utilization are correlated, they are very different metrics. It is possible to have a high occupancy (when agents are logged into the ACD a large percentage of the time) but a low Agent Utilization (when few calls are coming in). Key Correlations Agent Occupancy is strongly correlated with the following metrics: Agent Utilization Inbound Contacts per Agent per Month Agent Schedule Adherence Cost per Inbound Contact 160
162 Agent Occupancy Sample report only. Data is not accurate. Agent Metrics: Agent Occupancy 100.0% 90.0% 80.0% 70.0% Key Statistics Agent Occupancy High 94.6% Average 74.0% Median 71.9% Low 55.1% Company XYZ 88.4% 60.0% 50.0% 40.0% 30.0% 20.0% 10.0% 0.0% Service Desk 161
163 Definition Agent Metrics: Agent Schedule Adherence Agent Schedule Adherence measures whether agents are in their seats ready to accept calls as scheduled. That is, it measures how well a Service Desk s agents are adhering to the schedule. Agent Schedule Adherence is equal to the actual time that an agent is logged in to the system ready to accept calls, divided by the total time the agent is scheduled to be available to accept calls. Why it s Important Effective agent scheduling is critical to achieving a Service Desk s service-level goals and maximizing Agent Utilization. But a work schedule, no matter how well constructed, is only as good as the adherence to the schedule. It is therefore important for agents to adhere to the schedule as closely as possible to ensure that these productivity and service-level goals are met. Key Correlations Agent Schedule Adherence is strongly correlated with the following metrics: Agent Utilization Inbound Contacts per Agent per Month Agent Occupancy Average Speed of Answer 162
164 Schedule Adherence Sample report only. Data is not accurate. Agent Metrics: Agent Schedule Adherence 95.0% 90.0% 85.0% 80.0% Key Statistics Schedule Adherence High 91.5% Average 81.6% Median 83.5% Low 60.6% Company XYZ 60.6% 75.0% 70.0% 65.0% 60.0% 55.0% 50.0% Service Desk 163
165 Definition Agent Metrics: New Agent Training Hours The name of this metric is somewhat self-explanatory. New Agent Training Hours is the number of training hours (including classroom, computer-based training, self-study, shadowing, being coached, and on-the-job training) that a new agent receives before he or she is allowed to handle customer contacts independently. Why it s Important New Agent Training Hours are strongly correlated with Call Quality and Net First Contact Resolution Rate, especially during an agent s first few months on the job. The more training that new agents receive, the higher that Call Quality and Net FCR will typically be. This, in turn, has a positive effect on many other performance metrics including Customer Satisfaction. Perhaps most importantly, training levels strongly impact agent morale agents who receive more training typically have higher levels of job satisfaction. Key Correlations New Agent Training Hours are strongly correlated with the following metrics: Call Quality Net First Contact Resolution Rate Customer Satisfaction Inbound Contact Handle Time Agent Job Satisfaction 164
166 New Agent Training Hours Sample report only. Data is not accurate. Agent Metrics: New Agent Training Hours Key Statistics New Agent Training Hours High 200 Average 128 Median 127 Low 94 Company XYZ Service Desk 165
167 Agent Metrics: Annual Agent Training Hours Definition Annual Agent Training Hours is the average number of training hours (including classroom, computerbased training, self-study, shadowing, etc.) that an agent receives on an annual basis. This number includes any training hours that an agent receives that are not part of the agent s initial (new-agent) training. But it does not include routine team meetings, shift handoffs, or other activities that do not involve formal training. Why it s Important Annual Agent Training Hours are strongly correlated with Call Quality, Net First Contact Resolution Rate, and Customer Satisfaction. Perhaps most importantly, training levels strongly impact agent morale agents who receive more training typically have higher levels of job satisfaction. Key Correlations Annual Agent Training Hours are strongly correlated with the following metrics: Call Quality Net First Contact Resolution Rate Customer Satisfaction Inbound Contact Handle Time Agent Job Satisfaction 166
168 Annual Agent Training Hours Sample report only. Data is not accurate. Agent Metrics: Annual Agent Training Hours Key Statistics Annual Agent Training Hours High 47 Average 16 Median 14 Low 0 Company XYZ Service Desk 167
169 Agent Metrics: Agent Tenure Definition Agent Tenure is the average number of months that each agent has worked on a particular Service Desk. Why it s Important Agent Tenure is a measure of agent experience. Almost every metric related to Service Desk cost and quality is impacted by the level of experience the agents have. Key Correlations Agent Tenure is strongly correlated with the following metrics: Cost per Inbound Contact Call Quality Customer Satisfaction Annual Agent Turnover Annual Agent Training Hours Agent Coaching Hours Inbound Contact Handle Time Net First Contact Resolution Rate Agent Job Satisfaction 168
170 Agent Tenure (months) Sample report only. Data is not accurate. Agent Metrics: Agent Tenure Key Statistics Agent Tenure (months) High 70.3 Average 30.1 Median 27.6 Low 13.2 Company XYZ Service Desk 169
171 Definition Agent Metrics: Agent Job Satisfaction Agent Job Satisfaction is the percent of agents in a Service Desk who are either satisfied or very satisfied with their jobs. Why it s Important Agent Job Satisfaction is a proxy for agent morale. And morale, while difficult to measure, affects performance on almost every metric in the Service Desk. High-performance Service Desks almost always have high levels of Agent Job Satisfaction. A Service Desk can control and improve its performance on this metric through training, coaching, and career pathing. Key Correlations Agent Job Satisfaction is strongly correlated with the following metrics: Annual Agent Turnover Customer Satisfaction Daily Agent Absenteeism Net First Contact Resolution Rate Agent Training Hours Agent Coaching Hours 170
172 Agent Job Satisfaction Sample report only. Data is not accurate. Agent Metrics: Agent Job Satisfaction 100.0% 95.0% 90.0% 85.0% 80.0% Key Statistics Agent Job Satisfaction High 98.9% Average 83.4% Median 84.5% Low 67.8% Company XYZ 78.2% 75.0% 70.0% 65.0% 60.0% 55.0% 50.0% 45.0% 40.0% Service Desk 171
173 Contact Handling Metrics 172
174 Contact Handling Metrics: Inbound Contact Handle Time Definition Inbound Contact Handle Time for live (telephone) contacts is the average time (in minutes) that an agent spends on each contact, including talk time, wrap time, and after-call work time. For non-live contacts, such as , voic , and faxes, the Inbound Contact Handle Time is the average time that an agent initially spends working on each inbound contact. Why it s Important A contact is the basic unit of work in a Service Desk. Contact Handle Time, therefore, represents the amount of labor required to complete one unit of work. Key Correlations Inbound Contact Handle Time is strongly correlated with the following metrics: Cost per Inbound Contact Inbound Contacts per Agent per Month Net First Contact Resolution Rate 173
175 Inbound Contact Handle Time (minutes) Sample report only. Data is not accurate. Contact Handling Metrics: Inbound Contact Handle Time Key Statistics Inbound Contact Handle Time (minutes) High Average Median Low 9.76 Company XYZ Service Desk 174
176 Contact Handling Metrics: Outbound Contact Handle Time Definition Outbound Contact Handle Time is the average time (in minutes) that an agent spends on each outbound contact, including talk time, wrap time, and after-call work time. Outbound contacts can include callbacks to customers who have left voice messages or sent s, or callbacks to deliver information and solutions to customers who had previously called in. Why it s Important A contact is the basic unit of work in a Service Desk. Contact Handle Time, therefore, represents the amount of labor required to complete one unit of work. Key Correlations Outbound Contact Handle Time is strongly correlated with the following metrics: Cost per Inbound Contact Outbound Contacts per Agent per Month 175
177 Outbound Contact Handle Time (minutes) Sample report only. Data is not accurate. Contact Handling Metrics: Outbound Contact Handle Time Key Statistics Outbound Contact Handle Time (minutes) High 5.17 Average 4.42 Median 4.44 Low 3.70 Company XYZ Service Desk 176
178 Contact Handling Metrics: Outbound Contacts as a % of Total Contacts Definition This metric is fairly self-explanatory. It is a measure of outbound contact volume divided by all contact volume, including inbound and outbound contacts from all sources (live voice, voic , , etc.). Some Service Desks make no outbound contacts. This sometimes happens when the Service Desk is required to escalate or transfer a call if it is not resolved on first contact. In these cases, the inbound contact volume is the same as the total contact volume (since no outbound contacts are made), and Outbound Contacts as a % of Total Contacts will be 0%. Why it s Important Effective Service Desks with a high Net First Contact Resolution Rate generally have fewer outbound contacts. By contrast, a low Net FCR generally results in a higher outbound contact volumes. Key Correlations Outbound Contacts as a % of Total Contacts is strongly correlated with the following metrics: Net First Contact Resolution Rate Cost per Inbound Contact Outbound Contacts per Agent per Month 177
179 Outbound Contacts as a % of Total Contacts 40.0% Sample report only. Data is not accurate. Contact Handling Metrics: Outbound Contacts as a % of Total Contacts Key Statistics 35.0% 30.0% 25.0% Outbound Contacts as a % of Total Contacts High 36.6% Average 21.4% Median 21.8% Low 2.7% Company XYZ 7.4% 20.0% 15.0% 10.0% 5.0% 0.0% Service Desk 178
180 Contact Handling Metrics: User Self-Service Completion Rate Definition User Self-Service Completion Rate is the percentage of inbound contacts that are resolved by the user without assistance from a live agent. These could include contacts that are resolved within the IVR (e.g., automated password resets), and issues that are resolved by the user through a self-help portal. A user who opts out of the IVR or self-help session to speak with a live agent does not count as a User Self-Service Completion because the user did not resolve the issue before speaking with a live agent. Why it s Important The Service Desk s cost for self-service contacts is significantly lower than it is for agent-assisted calls. Increasing the number of contacts resolved through self-service leads to a significantly reduced overall Cost per Contact. Many Service Desks, recognizing the potential to reduce their costs, constantly strive to increase their User Self-Service Completion Rates. Key Correlations User Self-Service Completion Rate is strongly correlated with the following metrics: Cost per Inbound Contact Inbound Contact Handle Time 179
181 User Self-Service Completion Rate Sample report only. Data is not accurate. Contact Handling Metrics: User Self-Service Completion Rate 35.0% 30.0% 25.0% Key Statistics User Self-Service Completion High 29.7% Average 12.6% Median 15.0% Low 0.0% Company XYZ 1.9% 20.0% 15.0% 10.0% 5.0% 0.0% Service Desk 180
182 Workload Metric 181
183 Workload Metric: Inbound Contacts per End User per Month Definition Inbound Contacts per End User per Month measures the volume of Service Desk work generated by a given user population. The number of Inbound Contacts per End User per Month can vary dramatically from one organization to another, driven by factors such as the number and types of devices being supported, the number and complexity of applications being supported, the self-service options available, how well users are trained, and myriad other factors. Why it s Important The number of Inbound Contacts per End User per Month will drive the workload, and hence the staffing for a Service Desk. Service Desk staffing decisions should be based on this metric, rather than on the number of users being supported. 182
184 Inbound Contacts per End User per Month Sample report only. Data is not accurate. Workload Metric: Inbound Contacts per End User per Month Key Statistics Inbound Contacts per End User per Month High 1.82 Average 1.15 Median 1.12 Low 0.76 Company XYZ Service Desk 183
185 About MetricNet: Your Benchmarking Partner 184

186 Your Project Manager: Jeff Rumburg Co Founder and Managing Partner, MetricNet, LLC Winner of the 2014 Ron Muns Lifetime Achievement Award Former CEO, The Verity Group Former Vice President, Gartner Founder of the IT Service and Support Benchmarking Consortium Author of A Hands-On Guide to Competitive Benchmarking Harvard MBA, Stanford MS 185


187 Benchmarking is MetricNet s Core Business Information Technology Call Centers Telecom Service Desk Desktop Support Field Services Technical Support Customer Service Telemarketing/Telesales Collections Price Benchmarking Satisfaction Customer Satisfaction Employee Satisfaction 186

188 28 Years of Service Desk Benchmarking Data Global Database More than 3,700 Benchmarks 30 Key Performance Indicators Nearly 80 Industry Best Practices 187


189 Meet a Sampling of Our Clients MetricNet Conducts benchmarking for Service Desks worldwide, and across virtually every industry sector. 188


190 You Can Reach MetricNet