PI System Roadmap Evolving the PI System
|
|
|
- Leo McDowell
- 5 years ago
- Views:
Transcription

1 PI System Roadmap Evolving the PI System Presented by Brian McMorrow Product Management
2 Agenda and Expectations This presentation assumes: You know the PI System basics What is coming to the PI System Now 18 months Few specific dates check PI System Roadmap (see example) All information is subject to change We want your feedback and suggestions! 2
3 Every day I wake up and ask, how can I flow data better, manage data better, analyze data better? Rollin Ford, CIO Wal-Mart 3


4 PI System Overview HA Security Health Monitor PI AF PI Clients PI ProcessBook PI DataLink PI WebParts PI Coresight PI Interfaces PI Data Archive PI Server PI Data Access 3rd Party PI Event Frames PI Notifications PI Analytics Custom 4


5 PI System Overview HA Security Health Monitor PI AF PI Clients PI ProcessBook PI DataLink PI WebParts PI Coresight PI Interfaces PI Data Archive PI Event Frames PI Server 2012 PI Notifications PI Analytics PI Data Access 3rd Party Custom 5
6 PI System Themes Scale Asset-Centric PI Event Frames Visualization More data Fast Performance More robust Manage data via Asset context Reuse many times Identify and use important events and related data Many roles Different formats Any device 6

7 PI System Themes Scale Asset-Centric PI Event Frames Visualization More data Fast Performance More robust Manage data via Asset context Reuse many times Identify and use important events and related data Many roles Different formats Any device 7

8 PI SERVER 2012 (SCALABILITY: 20+ MILLION PI TAGS) 8

9 Performance Parameters PI Tag Count File Reprocess PI Tag Creation Data Writes System Management Tag Search Data Reads PI Server 2012 PI Server 2010 Startup Speed 9
10 2012 vs. 2010: The Final Sheet Delta Max Point Count 20M+ 2-3M 5-10x Startup Time <30 sec/mpts >10 min/mpts 20x Point Creation 500-2K pt/sec <100 pt/sec 5-200x Tag Searching Linear Non-Linear N/D Max Update Signups 10M+ <200K 50x Update Signup Rate >100K/sec <2K/sec 50x Data Out (Archive) >10M ev/sec <1M ev/sec 10-20x Data In (Snapshot) >1M ev/sec <200K ev/sec 5-10x Data In (Archive) >500K ev/sec <100K ev/sec 5-10x Archive Shifts <10 sec/gb >1 min/gb 6-12x Online Archives >50K files <10K files 5-10x Backup Speed <1 min/gb >5 min/gb 5-10x Offline Reprocessing 30 sec/gb >15 min/gb 30x 10
11 Example of PI AF SDK Improvement We have been able to write 21,200 points in 0.1 seconds to the PI Server 2012 Clean environment New PI AF SDK Broker Old PI SDK Broker Startup 67 sec. 334 sec. Restful memory utilization 250 KB 411 KB Active memory utilization 281 KB 697 KB Read time per point 5 µsec. 40 µsec. Write time per point 50 µsec. (average) 830 µsec. RBC_SCC environment New PI AF SDK Broker Old PI SDK Broker Startup 109 sec. 310 sec. Restful memory utilization 365 KB 1116 KB Active memory utilization 450 KB KB Read time per point 5 µsec. 40 µsec. Write time per point 50 µsec. (average) 830 µsec. 11
12 PI System Themes Scale Asset-Centric PI Event Frames Visualization More data Fast Performance More robust Manage data via Asset context Reuse many times Identify and use important events and related data Many roles Different formats Any device 12
13 A Complete Picture of Your Asset Real-time values Inlet pressure Inlet flow Ambient temperature Real-time Values Exhaust temperature Exhaust flow Measured MW output Asset details Name Make Model Notifications Performance excursions Temperature difference High temperature External Databases Performance curves Last service date Design documents Inspection best practice Calculations Performance calculations KPI s Business Events Downtime Startup Excursions 13


14 A Common View for Similar Assets T 14


15 Asset-centric Visualization PI Coresight: Ad Hoc Analysis & Collaboration PI WebParts: Composite Apps, Shared broadly Explore Review PI Clients PI Clients Monitor Report PI DataLink: Reporting and analytics in Microsoft Excel PI ProcessBook: Display authoring and Process monitoring 15
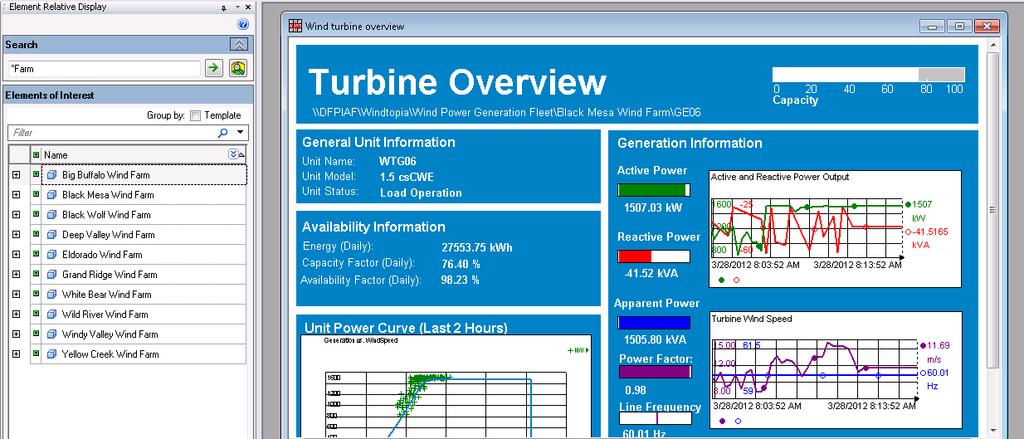

16 Asset-centric displays in PI ProcessBook

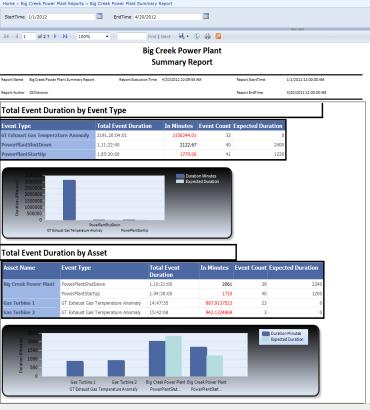
17 Asset-relative reports in PI DataLink

18 Consolidate and share with PI WebParts 18 18

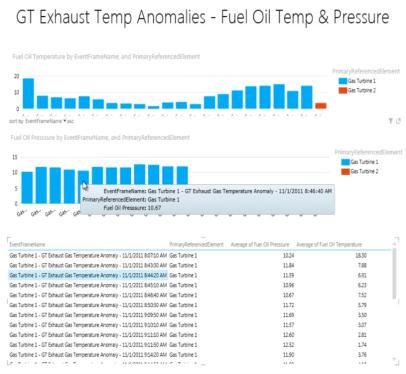
19 Explore assets with PI Coresight 19
20 PI System Themes Scale Asset-Centric PI Event Frames Visualization More data Fast Performance More robust Manage data via Asset context Reuse many times Identify and use important events and related data Many roles Different formats Any device 20

21 Simplify Data Analysis myevent Perform Asset Comparisons Event Overlay Trend (Temp) Perform Event Comparisons Name Temp.Max EF EF EF EF EF Downtime Events for Product XYZ Product XYZ (1) Downtime (2) Discover Event Interrelationships 21


22 PI Event Frames = events + related data Excursions (4) Downtime (3) Product XYZ (1) Event Attribute Value Name Ex Start End Duration Asset Excursion Type Fuel Gas Flow.Avg Fuel.Start mypikpi.max 15-Dec :35:02 15-Dec :47:26 12 min, 24 sec Boiler-459 High Violation k sft3/h k sft3/ton bbl/d 22

23 PI Coresight 2012 R2 Related Events The first PI Client to support PI Event Frames. Event Attributes Event Discovery Event Attributes Event Trending Event Discovery Event Trending 23


24 PI Data Access Integrate your events with other systems Time- Series Data SQL Family Assets OSIsoft s SDKs Events Web Services 24
25 What s Coming Next 25

26 PI AF to PI AF Scenarios Implement corporate standards Ensure commonality across enterprise Configuration changes, updates PI Event Frames and data to support analysis and KPIs Corporate HQ Templates 26


27 PI Information Exchange Services B2B Scenarios PI to PI AF to AF PI Information Exchange Service PI System Customer Portal Secure WAN/LAN Connection Secure WAN/LAN Connection Secure WAN/LAN Connection AD On-Premise Customer 1 AD Customer 2 AD Customer n 27

28 Project Abacus Configured and Programmed Calculations for PI AF 28
 Boiler1 Flow Out Fuel Flow Rate Efficiency = (Flow Out / Fuel Flow Rate *")

29 Project Abacus Use Case Extruding Process Boiler Efficiency = AVG(B1..Bn) Boiler1 Flow Out Fuel Flow Rate Efficiency = (Flow Out / Fuel Flow Rate * 3.14) Boiler2 Or myprogrammedcalc (Flow Out, Fuel Flow Rate) Flow Out Fuel Flow Rate Efficiency Boiler3 Flow Out Fuel Flow Rate Efficiency Efficiency Boiler Template 29
 Boiler KPI Excursion (4) PIUnitBatch (1) Name Start End Duration Element Category Template Reason Code Temp.")


30 EVENT FILTERS Duration Longer Than Category All Shorter Than 0 m 200 m None Excursions (4) Downtime (3) Product XYZ (1) Template All None Boiler Downtime (3) Boiler KPI Excursion (4) PIUnitBatch (1) Name Start End Duration Element Category Template Reason Code Temp.Max Ex01 16-Dec :05:48 17-Dec :25:24 01:19:36 B-459 Excursions Boiler KPI Excursion High Temp 91.2 Ex02 17-Dec :37:19 17-Dec :12:07 01:34:48 B-459 Excursions Boiler KPI Excursion Low Pressure 54.1 DT45 17-Dec :31:22 17-Dec :20:34 00:49:12 B-459 Downtime Boiler Downtime Broken Thermo 32.4 DT46 17-Dec :56:58 17-Dec :19:46 00:22:48 B-459 Downtime Boiler Downtime Broken Thermo 31.7 DT47 17-Dec :41:22 17-Dec :52:58 01:11:36 B-459 Downtime Boiler Downtime Safety Shutdown 87.2 XYZ Dec :12:34 17-Dec :29:22 03:16:48 B-459 Product XYZ PIUnitBatch n/a 48.9 Ex03 17-Dec :28:58 17-Dec :41:22 01:12:24 B-459 Excursions Boiler KPI Excursion High Temp 95.3 Ex04 17-Dec :44:58 17-Dec :45:46 01:00:48 B-459 Excursions Boiler KPI Excursion Low Temp 20.4 Highlight Events Temp.Max Greater Than Less Than 0 C 100 C Ex01 Ex02 XYZ146 DT45 DT46 DT47 Ex03 Ex04 30
 myef.start = (Efficiency > LIMIT) myef.")
31 Event Generation in Abacus Efficiency Abacus myef Efficiency Fuel Flow Rate Flow Out Efficiency Efficiency = (Flow Out / Fuel Flow Rate * 3.14) myef.start = (Efficiency > LIMIT) myef.end = (Efficiency < LIMIT) AND (Fuel Flow Rate > 80) 31


32 Goal Goal FUTURE 4Q 1H 2H 1H 2H Wave 1 Partner and Early Adopters Wave 2 Event Frames for the Mainstream End-to-End Event Frames Experience Ability to generate Event Frames automatically Several event frame visualization options NOTE: Future dates are subject to change. Last Updated: Wave 3 Batch Moves to Event Frames Move PI Batch Customers Forward Batch to EF Migration Functional Equivalency with existing Batch Clients 32


33 Smart Interfaces PI Interface Tags Assets Automatically Data Events discover your data, PI System PI Interface send it to your PI System, Tags Tags and Assets keep it in sync. Assets Data Data Events Events PI Interface Tags Tags Tags Assets Assets Assets Data Data Events Data Events Events 33
34 Find - PI System Search Optimized Search Engine for the whole PI System And perhaps related systems Indexed for high performance Weighted / Ranked Results Helps you find things more easily Can crawl many PI System machines Includes client artifacts PI ProcessBook Displays, PI Coresight Displays Common User Experience 34

35 Future Data Coming Next PI Server Data Load Curve (Actual) Load Forecast (Predicted) Just works with the PI System: Interfaces Analytics Data Access Visualization time 35
")
36 PI Data Access, longer-term PI System SDK RESTful Web Services Integration Services A single high performance SDK that allows you to access all PI System data Emerging web service standard, ideally suited for mobile and cloud Makes business system integration easy, not just possible (ERP, BI) 36


37 Project Rubik Why? Power View Tags Data Assets Events PI System 37


38 Project Rubik Bridge the gap between PI System experts and BI Users Allow PI System expert to select the data Leverage BI Visualization Tools from Microsoft, SAP (and others) Tags Assets Data Events Configures BI Semantic Model Configures Data Extraction Queries / Stored Readies and Sends Data Cleansing Publish Scheduled Refresh COTS Business Intelligence 38
39 PI System Themes Scale Asset-Centric PI Event Frames Visualization More data Fast Performance More robust Manage data via Asset context Reuse many times Identify and use important events and related data Many roles Different formats Any device 39
40 PI Coresight with Mobile Clients Browser Clients ipad Windows8 Android Smart Phones PI Server(s) (PI Data Archive & PI AF) PI Coresight Application Server 40

41 PI Coresight Tablet Edition Target Audience Plant / Operations Management Most likely to have ipad or similar device Overview of how the plant/utility is running Failures, Efficiency, KPIs, Actual vs Forecast Process Engineers / Corporate Planners Identifying problems Optimize processes plant to plant Create Content / Displays for management Maintenance Manual Data Entry / Problem Recording Troubleshooting documents and real-time Calibration 41

42 PI Coresight ipad Demo 42
43 PI Coresight on Windows8 with PI Notifications 43
44 PI Coresight Phone Edition Target Audience Check in with Plant from Home / Road Tell me if something is wrong! Focus on Notifications, Acknowledge, Dispatch, and Escalation Give me some basic data related to notification Outside of plant - 3G, 4G, or public WiFi Personalization 44

45 PI Coresight Phone Demo 45
 (PI Data Archive & PI AF) PI Coresight Application Server ProcessBook Displays")
46 PI Coresight ProcessBook Display Viewer Browser Clients ipad Windows8 Android Smart Phones PI Server(s) (PI Data Archive & PI AF) PI Coresight Application Server ProcessBook Displays 46
47 PI WebParts 2013 Support for SharePoint 2010 and SharePoint 15 Become a better SharePoint corporate citizen Become a more IT friendly product Replace obsolete technology Set the stage for OS and Browser independence, Mobile Remote Data Services WSP Installs IE 8 with Adobe SVG Viewer if needed IE9 and IE10 with Master Page Mode change Firefox and Chrome Remote Data Services WSP Installs Visualization using Web Standards Support for IE9, IE10, Firefox, and Chrome Mobile Devices per Microsoft Support ios, Android, Windows Phone 47

48 Stay Up-To-Date on the Web PI System Roadmap on OSIsoft Technical Support Site 48


49 Brought to you by