Project Controls for Optimal Execution
|
|
|
- Merry Neal
- 5 years ago
- Views:
Transcription
1 Project Controls for Optimal Execution Scheduling Techniques to Optimize Execution Tony Bolstad, Senior Project Controls Manager, Scheduling & Information Services, Inc.
2 Agenda Scheduling Practices and Project Success Schedule Development Schedule Risk Analysis Project Execution Capturing Delays and Impacts~
3 Scheduling Practices and Project Success Dr. Andrew F. Griffith, PE Hypothesis: There is a positive and significant relationship between scheduling practices used early in the project life-cycle and the ultimate success of the project. Independent Project Analysis, Inc. based study 494 completed major industrial capital projects (72% from North America, 58% petro-chemical) Projects authorized from 1993 to 2003 (Median Q3 2000) Average cost of $24MM, median $4.3MM, range $100k to $934MM 59 different owner organizations~
4 Scheduling Practices and Project Methodology: Success IPA project data collected at project authorization and project completion Measures of project success: Absolute cost performance relative to the industry benchmark for comparable projects (Cost Index) Absolute execution schedule performance relative to the industry benchmark for comparable projects (Schedule Index) Cost growth relative to the estimated cost at the time of project execution, and Schedule slip relative to the planned project finish date set at the time of authorization~
5 Scheduling Practices and Project Success At the time of authorization, successful projects had the following schedule characteristics: Integration of all project phases into a single schedule Definition / FEL, Detail Design, Procurement, Construction and Startup Application of Critical Path Method (CPM) Resource loading of the project schedule, and Detailed review of the schedule by the core project team~
6 Scheduling Practices and Project Success Outcome Metric Absolute Cost Index Project Cost / Industry Avg. Percent Schedule Slip Projects with Integrated Schedules % Projects without Integrated schedules %
7 Scheduling Practices and Project Success Outcome Metric Absolute Cost Index Percent Cost Growth Projects that applied CPM % Projects that did not apply CPM % Percent Schedule Slip 14% 26%
8 Scheduling Practices and Project Success Outcome Metric Absolute Cost Index Percent Schedule Slip Resource Loaded Schedules % Non Resource Loaded schedules %
9 Scheduling Practices and Project Success Outcome Metric Percent Cost Growth Projects that did Core Team reviews 0% Projects that did not do Core Team reviews 11%
10 Scheduling Practices and Project Success Project Definition Rating: No schedule 3% (15 projects) Milestone schedule 55% (272 projects) CPM Network schedule 29% ( 143 projects) CPM Network with resource loading 13% (64 projects)~
11 Scheduling Practices and Project Success Outcome Metric Resource Loaded CPM CPM Milestone Absolute Cost Index Percent Cost Growth -1% 2% 5% Absolute Schedule Performance Percent Schedule Slip 2% 19% 25%
12 Scheduling Practices and Project Success Summary of Dr. Griffith s findings: Fully Integrated schedule Use Critical Path Method (CPM) Resource load the schedule Early detailed review of the schedule by the core project team~
13 Scheduling Practices and Project Success Projects with the highest level of schedule definition at authorization had on average: 8% lower cost 13% faster schedules They were more predictable: 6% less cost growth 23% less schedule slip~
14 Schedule Development Project Schedule Structure Contractual Language Clear DOR WBS Easily understood Supports the major phases of the project Supports the major components of the project Coding Responsibility Phase Area (physical or administrative area) Activity ID structure Calendars~
15 Schedule Development Master Project/Subproject structure Time and cost savings Dates are synchronized between schedules Information updated one time only Concurrent updating of schedules Ability to link between projects Schedules stay synchronized even when checked out Links between projects are maintained at the master schedule level el Activity coding dictionaries, layouts, and filters are synchronized Ability to "check out and check in" a project to individual companies for their updating. Ability to do schedule comparisons both at the master project and sub project levels~
16 Schedule Development Master Project/Subproject structure Subprojects are useable during the month without effecting the master schedule. 3 week look ahead "what if" analysis Subprojects can be transmitted as legal documents Security Each entity has access to only their subproject. Subprojects do not have access to activities in the master other than viewing linked activities. Data dictionary structure is controlled at the master level~
17 Schedule Development Standards/ Definitions /Conventions Activities Criteria (scope, duration) Descriptions: Verb, Noun, Location Understandable when taken out of context Resources Major disciplines (electricians, welders, ironworkers ) Major Equipment~
18 Schedule Development Standards/ Definitions /Conventions Numbering scheme and format for: Filters Layouts Reports Conventions for Adding Activities Master Project / Subproject Check In/Out Process Updating Cycle / Process Target Schedules Reproducible from week to week Provides appropriate information for each entity: Owner Engineer/Architect Contractor Subcontractor~

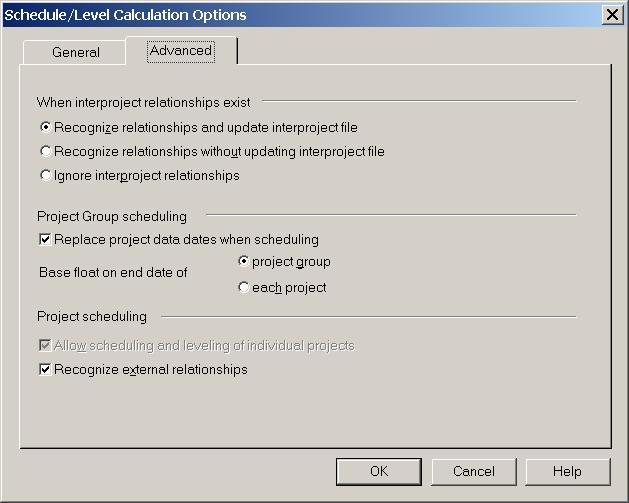
19 Schedule Development Software Configuration Schedule calculations

20 Schedule Development Software Configuration Resource/Cost
21 Schedule Development Schedule Integrity QA steps Close open ends Remove Mandatory and Start/Finish On constraints Justify every constraint used Verify contractual Milestones / Dates are entered Balance resource loading to the estimate Review Float Low Float High Float Test the schedule~
22 Schedule Development Schedule Integrity Check Schedule reports: P3 Suretrak
23 Schedule Development PertMaster Sanity Check reports

24 Schedule Development Constraint documentation

25 Float Review Schedule Development

26 Schedule Development Schedule Testing
27 Schedule Development Schedule Integrity Review cycle Scheduler s Peer Review Project Manager / Superintendent Core Team (Stakeholders) First Iteration Hard Logic Focus on what s physically possible No resource leveling or soft logic Second Iteration Soft or Preferential Logic added Resources leveled~

28 Logic Review Schedule Development
29 Risk Analysis Some of Pertmaster s Features Risk Analysis Monte Carlo Simulation Cost Analysis and Cost Risks Individual Task Analysis and Entire Project Analysis Tornado Graphs Probabilistic Branching / Task Exists? Resource Risk Schedule Comparisons Network Diagrams / PERT Pertmaster: ~
30 Risk Analysis Single Path (CPM) vs. Monte Carlo technique 3 Durations (min, most likely,max) using a Triangular Distribution Each iteration has it s s own critical path (1000 iterations) CPM - Does not take uncertainty into account Traditional CPM shows only 1 critical path Distribution graph presents likelihood of finish dates~

31 Risk Analysis

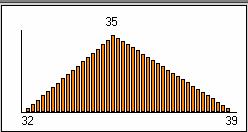
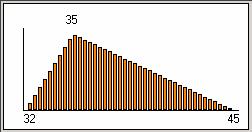
32 Distribution Triangle for Individual Activities

33 Distribution Triangle for Individual Activities

34 Baseline Schedule in Pertmaster

35 Baseline Schedule in Pertmaster Min and Max are 10% of Most Likely or Original Duration
36 Finish Date Analysis Risk Project Entire Plan : Finish Date Hits Apr02 01May02 08May02 15May02 22May02 29May02 05Jun02 Distribution (start of interval) 100%07Jun02 95% 27May02 90% 24May02 85% 22May02 80% 21May02 75% 20May02 70% 19May02 65% 18May02 60% 17May02 55% 16May02 50% 15May02 45% 14May02 40% 13May02 35% 12May02 30% 11May02 25% 10May02 20% 09May02 15% 08May02 10% 06May02 5% 04May02 Cumulative Frequency Analysis Simulation: Latin Hypercube Iterations: 1000 Convergence Plan Finish Date: Converged in 200 iterations (variation < 1% over 100 iterations) Total Plan Cost: Converged in 200 iterations (variation < 1% over 100 iterations) Statistics Minimum: 24Apr02 Maximum: 07Jun02 Mean: 15May02 Median: 15May02 Mode: 12May02 Max Hits: 146 Std Deviation: Variance: Skewness: Kurtosis: Selected Confidence 80%: 21May02 Deterministic Finish: 09May02 Probability 22%
37 Risk Project Entire Plan : Finish Date 100%07Jun02 95% 27May % 24May02 85% 22May02 80% 21May02 Hits % 20May02 70% 19May02 65% 18May02 60% 17May02 55% 16May02 50% 15May02 45% 14May02 40% 13May02 35% 12May02 Cumulative Frequency 30% 11May02 25% 10May % 09May02 15% 08May02 10% 06May02 5% 04May Apr02 01May02 08May02 15May02 22May02 29May02 05Jun02 Distribution (start of interval)
38 Why Did the Finish Date Change? Single Path (CPM) vs. Monte Carlo technique (1000 iterations) Parallel Path & Merge Bias Effect ~ Install Electrical Rough-in Walls L2 Install Electrical Rough-in Soffits L2 Install Electrical Rough-in Ceiling L2 Merge Bias Point Wall Framed Install Phone & Data Cabling L2 Install GWB, Drywall, and Taping L2 Install Security System RI Walls L2
39 Tornado Graphs Criticality Index During the risk analysis iterations, the number of times an activity was critical is recorded ~ Risk Project Risk - Criticality Index Inspect, snag, etc 100% Exterior works 100% Recover roof 100% Strip off roof cover 100% Re-build 50% brick 100% Demolish 50% brick 100% Re-build 50% brick 100% Demolish 50% brick 100% Drill out ties, etc 97% Drill out ties, etc 96% Plumbing, etc 92% Chimney rebuild 79% Drain off system etc. 79% Erect Scaffold 41% Dismantle scaffold 23% Wasp Nests Found 20% Cut-off & re-route electric 11% Cut-off & re-route electric 9% Roof struct. work 5% Plaster 0% Analysis Simulation: Latin Hypercube Iterations: 1000 Display settings Normal tasks only Showing 20 highest tasks
40 Schedule Sensitivity Index The SSI identifies and ranks the tasks most likely to influence the project duration / finish ~ Risk Project Schedule Sensitivity Index Re-build 50% brick 47% Re-build 50% brick 47% Recover roof 43% Demolish 50% brick 26% Demolish 50% brick 26% Inspect, snag, etc 23% Drill out ties, etc 22% Drill out ties, etc 22% Plumbing, etc 15% Strip off roof cover 14% Chimney rebuild 14% Exterior works 14% Erect Scaffold 7% Drain off system etc. 5% Dismantle scaffold 3% Roof struct. work 2% Cut-off & re-route electric 1% Wasp Nests Found 1% Cut-off & re-route electric 1% Joinery 0% Analysis Simulation: Latin Hypercube Iterations: 1000 Schedule Sensitivity Index Values are displayed for: All tasks in the plan Display settings Normal tasks only Showing 20 highest tasks
41 Duration Sensitivity Correlation between the duration of a task and the duration of the t project. The task with the highest duration sensitivity is the task that is most likely to increase the project duration ~. Risk Project Duration Sensitivity Re-build 50% brick 46% Re-build 50% brick 45% Recover roof 44% Inspect, snag, etc 25% Demolish 50% brick 25% Drill out ties, etc 24% Demolish 50% brick 23% Drill out ties, etc 22% Plumbing, etc 21% Strip off roof cover 13% Chimney rebuild 13% Exterior works 11% Drain off system etc. 11% Joinery 7% Erect Scaffold 6% Plaster 4% Re-wire 4% Cut-off & re-route electric 4% Boundary wall, etc 4% Wasp Nests Found 3% Analysis Simulation: Latin Hypercube Iterations: 1000 Sensitivity measurement Spearman's rank correlation Measured Against: Display settings Normal tasks only Showing 20 highest tasks Entire Plan

42 Cost Risk Can be view by activity or entire project ~
43 Project Execution What to do with all of the brightly colored wallpaper~
44 Project Execution Field use Communication Tools Short Interval Schedules Discipline Reports Critical Path Planning Tools Resource Histograms~

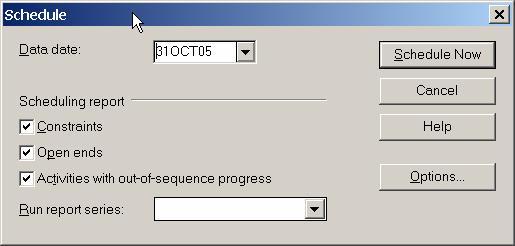
45 4 Week Schedule Data Date + 28 Days Activities in progress Activities that will start within 28 days ~

46 4 Week Schedule x Subcontractor

47 Critical Path Activities

48 Bar Chart View / Histogram Manpower Loading
49 Project Execution Management use Communication Tools Critical Path Milestone Summary Phase Summary Variance reports Planning Tools 3 Month Lookahead Combined Histograms Risk Reports~

50 Milestone Summary Management Use

51 3 Month Look Ahead Management Use
52 Management Use Period Analysis Last Period vs. Current Period Baseline plan vs. Current Period Bang for the Buck Float and Resource Analysis to determine which activity progress/completion will yield the best results Identify tighter sequential activity coordination Finish on Friday Identify which tasks need to finish this week to keep things on track Helps prevent the 95% and holding syndrome~

53 Management Use Establish the Baseline Schedule for Variance Comparison

54 Management Use Using the Variance Reports to Illustrate Delays and Impacts Week 4: Current to Baseline Schedule Comparison Late Activities Why? Create Plan to Mitigate / Recover ~

55 Bang for the Buck Management Use
56 Capturing Delays and Impacts Illustrating/Documenting Forecasting What if analysis~
57 Delays & Impacts Use the schedule to illustrate impacts from the following types of events: Non excusable, Non compensable Subcontractor Performance Contractor Performance Excusable, Non compensable Force Majeure Excusable, Compensable Design Error RFI s~
58 Delays & Impacts Delays & Impacts always need to be evaluated against the current plan Document and illustrate the delay Analyze the impact Get acknowledgement of the delay~
59 Delays & Impacts Subcontractor Delays can be recognized by the general or the sub. Delays are addressed in the schedule after a known or potential impact has been identified. Start or Finish Date Variance Const. Sequence change Performance issue (low % complete)~
60 Delays & Impacts Delay recognition occurs at or just behind the data date. Can be for work currently in progress or in the future Very little advance warning Generally not seen until late Not readily acknowledged by the Sub or GC Usually non-compensable~
61 Delays & Impacts Document the Impact Enter actual dates, % complete Add coding to be able to group or filter the delay Add additional activities if needed Add notes to Log Show variance from target finish Develop recovery options~

62 Impact from a Subcontractor
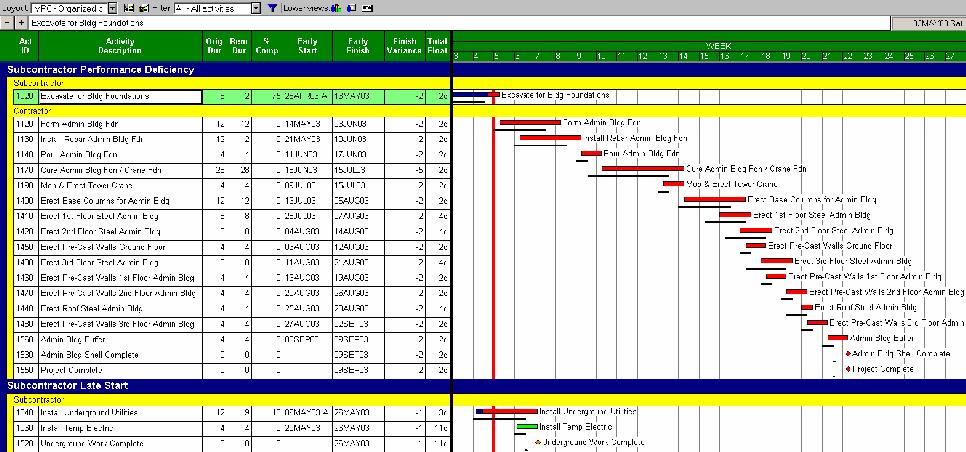
63 Impact Illustrated

64 Impact Recovery Plan
65 Uncontrollable Delays Delays are addressed in the schedule after the impact has been identified Can impact work in progress or work in the future Add the impact to the schedule Add the consequence activity Add logic or change durations to illustrate the impact~

66 Impact from Weather - Start

67 Impact from Weather - Illustrated


68 Impact from Weather - Extension

69 Impact from Weather - Extension Changed Constraint +2 days

70 Impact from Weather - Final
71 Impact from an RFI RFI s are initiated by GC or subcontractor RFI s are added to the schedule after a known or potential impact has been identified. Commodity change Qty change Const. Sequence change Design Clarification / Change~
72 Impact from an RFI RFI s occur at or behind the data date Can be for work currently in progress or for work in the future RFI s that don t go in the schedule Dimensional clarifications 2 or 3 Stenciling Installation clarification Torque to 100 ft lbs or 110 ft lbs~

73 RFI Impact - Start

74 RFI Impact Add RFI

75 RFI Impact Capture Rework

76 RFI Impact Capture Change
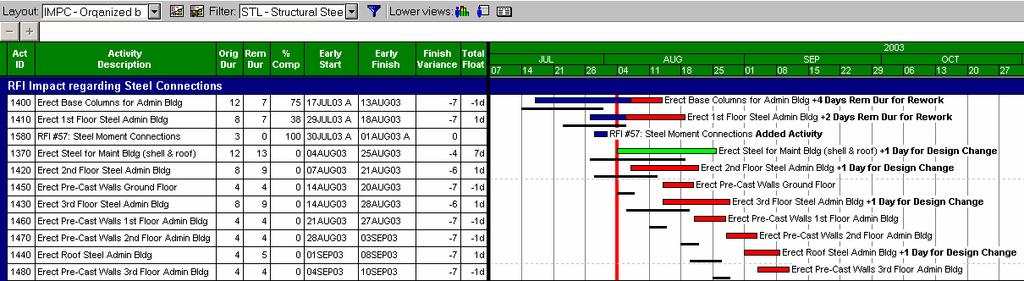
77 RFI Impact Illustrated

78 RFI Impact Final
79 Analysis of Impacts Analyze Impacts Individually and as a whole Isolate the effect of each impact if possible Easier to do if analyzed at the time they happen~

80 Analysis of Impacts By Event

81 Analysis of Impacts By Type
82 Presentation of Impacts Illustrate Impacts, then: Communicate the impact Get acknowledgement of the impact Get extension Present Multiple Options for Recovery (with $ s) Develop new plan to proceed forward~
83 Presenting Options - RFI Leave as is, finish 7 days late Pro = costs and risks are known, plan is in place Con = extended GC s, Equipment $ s Work crane related activities 5 or 6 days / Week Pro = Finish sooner, decreased GC & Equip. $ s Con = Increased direct $ s, Decreased Productivity, increased Safety exposure Re-sequence the work (if possible) Pro = Finish sooner, decreased GC & Equip. $ s Con = Increased Safety Risk, Decreased Productivity~

84 RFI Impact Whole Schedule

85 RFI Impact Isolated

86 RFI Impact Date Extension

87 RFI Impact Date Extension

88 RFI Impact Revised End Date

89 Presenting Options 5 Days / Week

90 Presenting Options 6 Days / Week
91 Capturing Delays and Impacts Summary Foundation of schedule must be sound Cover scope of work for all parties Coding structure Logic Durations Update Regularly File, Save As, for every update period Capture AS, AF, % Comp., RD every week Analyze the Update Maintain scheduler s narrative & log~
92 Capturing Delays and Impacts Capture the Impacts Summary Add impacts to the schedule as they happen Log changes to the schedule Code the impact Analyze Communicate Present the impact Get Acknowledgement Present Options Make a new plan~
93 Scheduling Techniques Summary Solid Plan Contractual Language Integrated Schedule 5 Phases CPM, Resource Loaded Built Well Mechanics are correct Coding / Structure is sound Protocol developed early~
94 Scheduling Techniques Summary Check the Schedule Peer Review Review with Core Team Perform Risk Analysis Use the Schedule Field Information Management Information Capture the Problems Illustrate Impacts Forecast Delays Provide Options~
95 The End Scheduling Techniques to Optimize Execution Tony Bolstad, Senior Project Controls Manager, Scheduling & Information Services, Inc Please contact author prior to reproduction or distribution for other than personal use.
96 References Scheduling practices and project success (Paper PS05). Andrew F. Griffith. 49th Annual Meeting, AACE International,, New Orleans, LA, June 26-29, 29, PertMaster Project Risk Software