From Good to Great The Emory Healthcare Success Journey! Your Speaker: Jeff Rumburg
|
|
|
- Gilbert Taylor
- 5 years ago
- Views:
Transcription
1
2 From Good to Great The Emory Healthcare Success Journey! Your Speaker: Jeff Rumburg

3 Download Two KPI ebooks & Today s Presentation MetricNet.com/smw18 3


4 The One Year Path to World-Class Performance 4


5 The Benchmarking Methodology Emory Healthcare s IT Service and Support Performance COMPARE Performance of Benchmarking Peer Group Determine How Best in Class Achieve Superiority Adopt Selected Practices of Best in Class Achieve World-Class Performance The ultimate objective of benchmarking 5
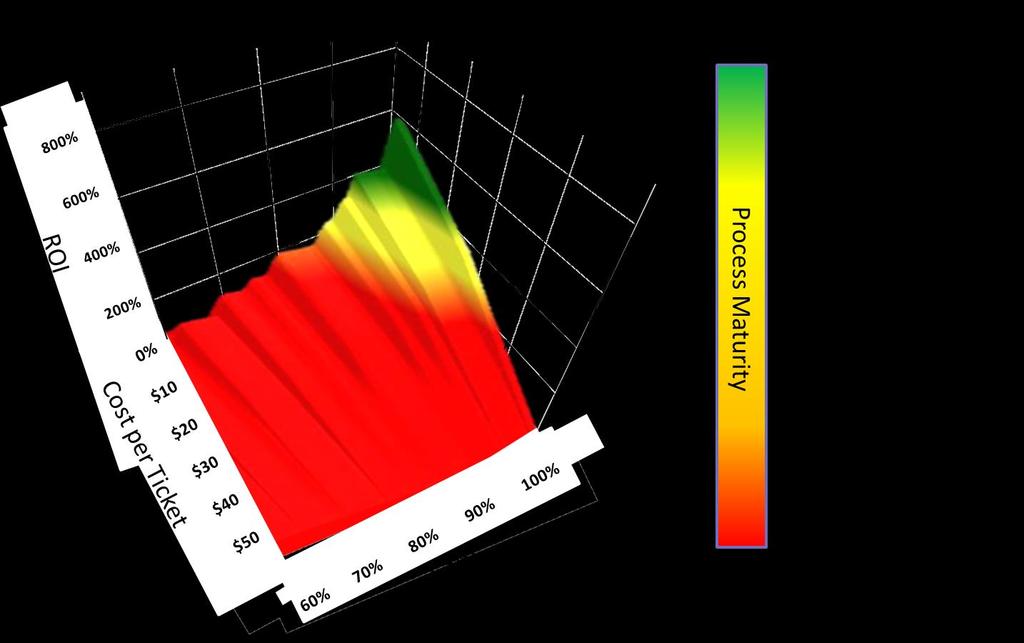
6 Project Goal: World-Class IT Service and Support Service consistently exceeds customer expectations Result is high levels of Customer Satisfaction Top Quartile Customer Satisfaction Costs are managed at or below industry average levels Cost per Ticket below average Bottom quartile Cost per Ticket Service and Support follow industry best practices Practices and Procedures are well defined and well documented Service and Support follows industry best practices Every transaction adds value A positive customer experience Creates ROI > 100% 6
7 7 The Initial State
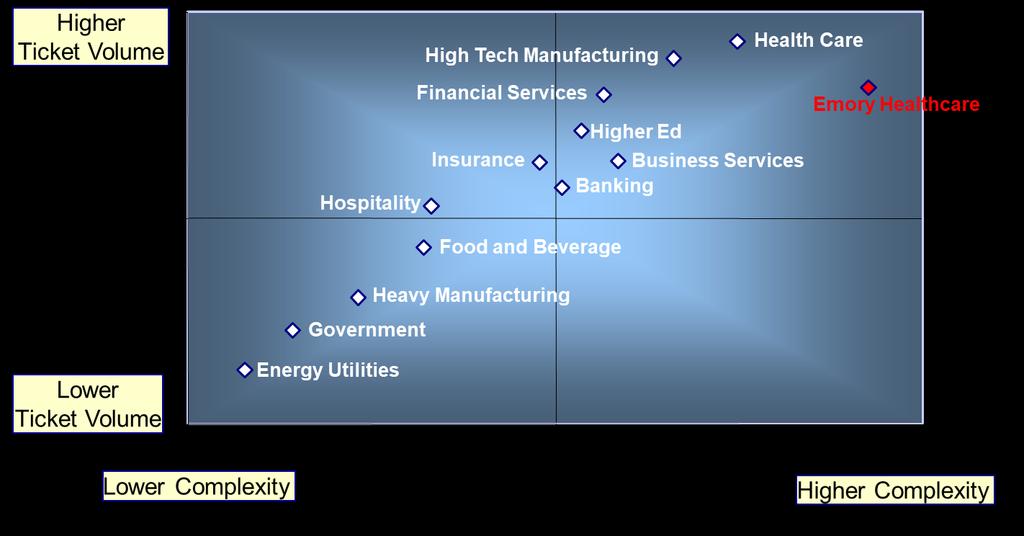
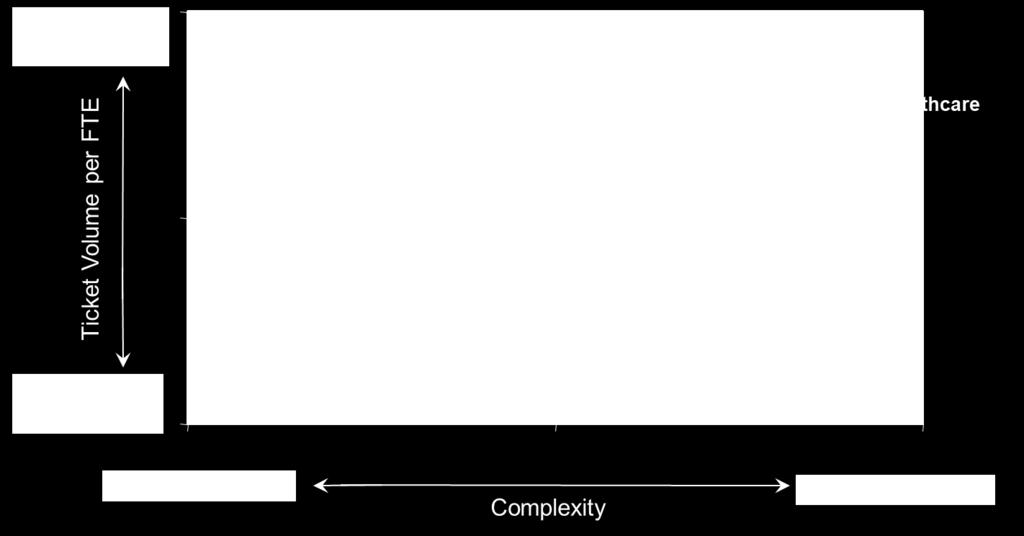
8 8 Complexity vs. Ticket Volume


9 Emory Healthcare at a Glance 10 Hospitals 2,673 Beds 250 Locations 2,800 Physicians 21,000 Employees 9
10 Scope of the Initiative Deputy CIO Client Services Help Desk Field Services
11 Emory s IT Service and Support Overview Metric Service Desk Field Services Location Atlanta, GA Atlanta, GA Remote sites Hours of Operation 24 X 7 6 AM 6 PM, Monday Friday Annual Operating Expense $1,694,669 $3,824,425 Monthly Ticket Volume 14,569 3,361 Technician Headcount
12 Service Desk Benchmarking Metrics Cost Productivity Service Level Cost per Inbound Contact Cost per Minute of Inbound Handle Time Net First Level Resolution Rate Inbound Contacts per Technician per Month Outbound Contacts per Technician per Month Technician Utilization Technicians as a % of Total Headcount Average Speed of Answer (ASA) % of Calls Answered in 30 Seconds Call Abandonment Rate Technician Quality Call Quality Net First Contact Resolution Rate Customer Satisfaction Annual Technician Turnover Daily Technician Absenteeism Technician Occupancy Schedule Adherence New Technician Training Hours Annual Technician Training Hours Technician Tenure (months) Technician Job Satisfaction Contact Handling Inbound Contact Handle Time (minutes) Outbound Contact Handle Time (minutes) Inbound Contacts as a % of Total Contacts User Self-Service Completion Rate 12
13 Field Services Benchmarking Metrics Cost Productivity Service Level Cost per Ticket Cost per Incident Cost per Service Request Quality Customer Satisfaction Incident First Visit Resolution Rate % Resolved Level 1 Capable Workload Tickets per User per Month Incidents per User per Month Service Requests per User per Month Incidents as a % of Total Ticket Volume Tickets per Technician per Month Incidents per Technician per Month Service Requests per Technician per Month Technicians as a % of Total Headcount Technician Utilization Technician Annual Technician Turnover Daily Technician Absenteeism New Technician Training Hours Annual Technician Training Hours Technician Tenure (months) Technician Job Satisfaction Mean Time to Resolve Incidents (business hours) % of Incidents Resolved in 8 Business Hours Mean Time to Fulfill Service Requests (business days) % of Service Requests Fulfilled in 24 Business Hours Ticket Handling Average Incident Work Time (minutes) Average Service Request Work Time (minutes) Average Travel Time per Ticket (minutes) 13
14 Performance Metric Initial EHC Help Desk Balanced Scorecard Metric Weighting Performance Range Worst Case Best Case EHC 2017 Metric Score Balanced Score Cost per Inbound Contact 25.0% $19.95 $8.17 $ % 21.8% Customer Satisfaction 25.0% 72.4% 97.8% 89.6% 67.7% 16.9% Agent Utilization 15.0% 30.8% 57.8% 30.8% 0.0% 0.0% Net First Contact Resolution Rate 15.0% 58.0% 77.3% 58.0% 0.0% 0.0% Agent Job Satisfaction 10.0% 63.6% 90.6% 78.7% 55.9% 5.6% Average Speed of Answer (seconds) 10.0% % 0.0% Total 100.0% N/A N/A N/A N/A 44.3% 14
15 Balanced Scores Initial EHC Help Desk Balanced Scorecard Summary 90.0% 85.0% 80.0% 75.0% 70.0% 65.0% 60.0% 55.0% 50.0% 45.0% 40.0% 35.0% 30.0% 25.0% 20.0% 15.0% 10.0% 5.0% 0.0% Key Statistics Help Desk Scores High 83.8% Average 54.8% Median 56.9% Low 9.9% Emory Healthcare 44.3% Help Desk 15

16 Initial EHC Field Services Balanced Scorecard Performance Metric Metric Weighting Performance Range Worst Case Best Case Your Actual Performance Metric Score Balanced Score Cost per Ticket 25.0% $ $64.25 $ % 16.2% Customer Satisfaction 25.0% 59.5% 97.2% 92.1% 86.5% 21.6% Tickets per Technician per Month 15.0% % 9.3% Mean Time to Resolve Incidents (business hours) 15.0% % 0.0% Mean Time to Fulfill Service Requests (business days) 10.0% % 5.4% Technician Job Satisfaction 10.0% 68.3% 84.3% 77.2% 55.3% 5.5% Total 100.0% N/A N/A N/A N/A 58.0% 16
17 Balanced Scores 17 Initial EHC Field Services Balanced Scorecard Summary 85.0% 80.0% 75.0% 70.0% 65.0% 60.0% 55.0% 50.0% 45.0% 40.0% 35.0% 30.0% 25.0% 20.0% 15.0% 10.0% 5.0% 0.0% Field Services Key Statistics Field Services Scores High 77.1% Average 57.1% Median 57.5% Low 21.8% Emory Healthcare 58.0%
18 Client Services Faced a Number of Challenges The metrics discipline was weak Some important KPIs were not being tracked e.g., Customer Satisfaction, Cost per Ticket, MTTR, and Agent Satisfaction ITIL Disciplines were weak and unmanaged Incident, Problem, and Knowledge Management were immature Initial troubleshooting was sometimes minimal or non-existent before a ticket was escalated to a resolver group There is a lot of bypass, e.g., customers going directly to resolver groups for support Lines of demarcation between client services and other support groups are not well defined The result was a lack of accountability 18
19 Recommendations were Made Move work closer to the customer Shift left Specialty Desktop Support Team Rounds relaunch Mature core service management processes Incident, Change, and Problem Management Introduce and mature key disciplines Metrics and Reporting Incident Management Knowledge Management Problem Management Workforce Management 19
20 The Continuous Improvement Phase 20
21 Implementation of Client Services Goals Q Q Q Q Q Initial Assessment Shift Left Remedy Ticket Cleanup Balanced Scorecards Ticket and Call Quality Assurance Knowledge Transfer and Training from Other Groups Knowledge Management First Contact and First Level Resolution (FCR and FLR) Specialty Desktop Support Services Identify Desktop Work Outside of Client Services Create Specialty Desktop Support Group Develop Policies for Work Defined as Specialty Desktop 21


22 22 Shift Left Reduces Total Cost of Ownership
23 Key Initiatives Mature the Metrics Discipline Implement Scorecards Clean up the Remedy ticket backlog Implement a Ticket Quality Monitoring Program Mature Incident Management, and Hire an Incident Manager Mature Problem, and Knowledge Management Stand Up Specialty Desktop Support 23
24 Increasing Value! 24 Maturing the Metrics Have You Leveraged KPIs for World-Class Performance? Do You Use Metrics to Continuously Improve? Do You Use Metrics Prescriptively? Do You Use Metrics Diagnostically? Do You Understand KPI Cause-and-Effect? Do You Set Performance Targets with KPIs? Can you Define Your KPI s? Do You Use Metrics for Reporting? Do You Have KPIs? 5 % 10 % 10% 20% 30% 60% 80% 90% 100%

25 25 The Emory Healthcare Scorecard Framework
26 Proposed Goals for Remedy Ticket Cleanup Non Client Services 40% 30% 20% 10% 0% Current State 212, 28% 178, 23% 108, 14% 263, 35% % 60% 50% 40% 30% 20% 10% 0% First 90 Days 263, 65% 89, 22% 54, 13% 0, 0% % 80% 60% 40% 20% 0% At 180 Days 0, 0% 0, 0% 27, 9% 263, 91% Steady State (> 180 Days) Zero red tickets (100+ Days) Zero orange tickets (30-99 Days) Yellow tickets reduced by 75% (15-29 Days) 26

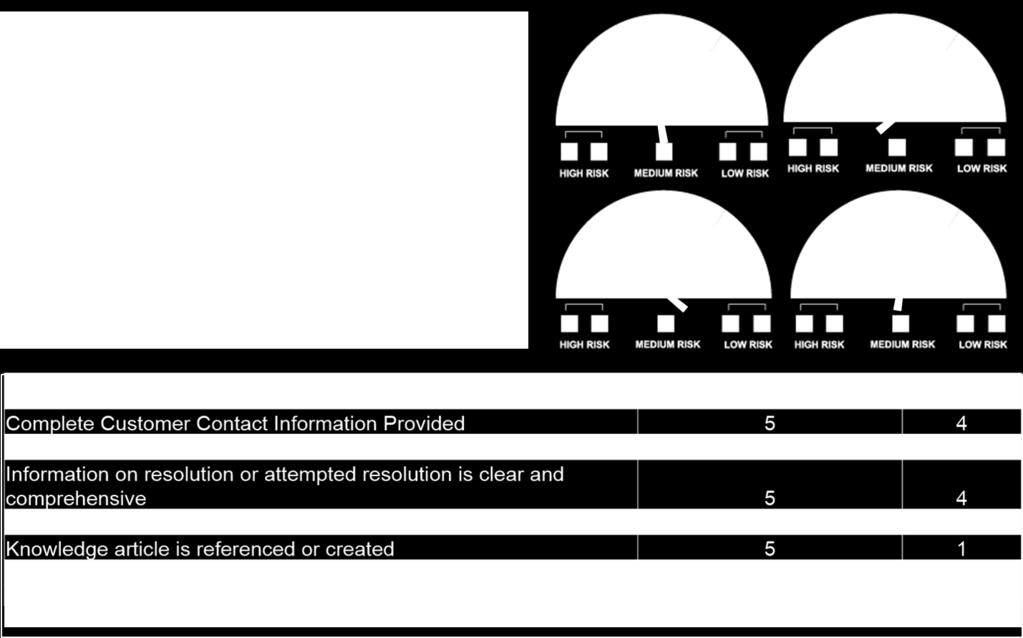
27 27 Ticket Quality Monitoring
28 Implementing and Maturing ITIL Processes Initial Maturity Assessment Formalize Problem, Change and Knowledge Management 2 nd Maturity Assessment March 2018 April 2018 May 2018 June 2018 July 2018 August 2018 Define and Formalize the Incident Management Process Remedy 9.1 Create Problem and Known Error Database Formalize Incident Management Reporting and Baselining Fully populate CMDB 28
29 29 Show Me the Money!
30 30 The Results: One Year Later

31 Net First Contact Resolution Rate 80.0% Help Desk Metrics: First Contact Resolution Key Statistics 75.0% 70.0% 65.0% 68.0% Net First Contact Resolution Rate High 77.3% Average 67.4% Median 66.5% Low 58.0% EHC % EHC % 60.0% 58.0% 55.0% 50.0% 31 Help Desk
32 Agent Job Satisfaction 95.0% Help Desk Metrics: Job Satisfaction Key Statistics 90.0% 85.0% 80.0% 75.0% 70.0% Agent Job Satisfaction High 90.6% Average 78.4% Median 78.9% Low 63.6% EHC 2017 N/A EHC % 71.0% 65.0% 60.0% 55.0% 50.0% Help Desk 32
 High 146 Average 73 Median 70 Low 26 EHC 2017 146 EHC 2018 50 50 146 Help Desk")
33 Average Speed of Answer (ASA) (seconds) Help Desk Metrics: Average Speed of Answer Key Statistics Average Speed of Answer (seconds) High 146 Average 73 Median 70 Low 26 EHC EHC Help Desk 33
34 Balanced Scores 90.0% 85.0% 80.0% 75.0% 70.0% 65.0% 60.0% 55.0% 50.0% 45.0% 40.0% 35.0% 30.0% 25.0% 20.0% 15.0% 10.0% 5.0% 0.0% Improvements in the Help Desk Balanced Score 65.2% 44.3% Key Statistics Help Desk Scores High 83.8% Average 55.3% Median 57.4% Low 9.9% EHC % EHC % Help Desk 34

35 Balanced Score World-Class = 75% Average = 47.2% Help Desk Process Maturity vs. Scorecard Performance 100% Emory Healthcare Performance 90% 2017 Process Assessment Score 42.4% 2017 Help Desk Balanced Score 44.3% 80% 2018 Process Assessment Score 62.5% 70% 2018 Help Desk Balanced Score 65.2% 60% Average = 54.8% 50% 40% 30% 35 20% 10% EHC Help Desk 2017 EHC Help Desk % Global Database 0% 10% 20% 30% 40% 50% 60% 70% 80% 90% 100% Process Assessment Score
36 Tickets per Technician per Month Field Services Metrics: Tickets per Tech per Month 140 Key Statistics Tickets per Technician per Month High 127 Average 96 Median 101 Low 70 EHC EHC Field Services 36
37 Mean Time to Resolve Incidents (business hours) Field Services Metrics: MTTR Incidents Key Statistics Mean Time to Resolve Incidents (business hours) High Average 7.53 Median 6.60 Low 4.20 EHC EHC Field Services
38 Technician Job Satisfaction 90.0% Field Services Metrics: Technician Job Satisfaction Key Statistics 85.0% 80.0% 78.0% Technician Job Satisfaction High 84.3% Average 77.2% Median 78.1% Low 68.3% EHC 2017 N/A EHC % 75.0% 70.0% 65.0% 60.0% 38 Field Services
39 Balanced Scores 85.0% 80.0% 75.0% 70.0% 65.0% 60.0% 55.0% 50.0% 45.0% 40.0% 35.0% 30.0% 25.0% 20.0% 15.0% 10.0% 5.0% 0.0% Improvements in the Field Services Balanced Score 73.9% 58.0% Key Statistics Field Services Scores High 77.1% Average 57.9% Median 58.0% Low 21.8% EHC % EHC % 39 Field Services
40 Balanced Score World-Class = 75% Average =37.6% Field Services Process Maturity vs. Scorecard Performance 100% 90% 80% 70% 60% Emory Healthcare Performance 2017 Process Assessment Score 50.9% 2017 Field Services Balanced Score 58.0% 2018 Process Assessment Score 61.0% 2018 Field Services Balanced Score 73.9% Average = 57.1% 50% 40% 30% 40 20% 10% EHC Field Services 2017 EHC Field Services % Global Database 0% 10% 20% 30% 40% 50% 60% 70% 80% 90% 100% Process Assessment Score

41 Quality (Effectiveness) Cost vs. Quality for Emory Healthcare Client Services Higher Quality Middle Quartiles Effective but not Efficient Top Quartile Efficient and Effective EHC Help Desk EHC Field Services Global Database Lower Quality Lower Quartile Middle Quartiles Efficient but not Effective Higher Cost Cost (Efficiency) Lower Cost 41


42 42 Show Me the Money!
43 The Estimated ROI for Client Services is > 200% ROI Metric Help Desk Field Services Monthly Ticket Volume 14,569 3,361 Estimated Productivity Gain per Ticket (minutes) Annual Productivity Gain (hours) 58, ,996 Annual Productivity Gain FTEs Estimated Value of Productivity Gain (return) $3,885,067 $8,066,400 Annual Operating Expense (investment) $1,694,669 $3,824,425 Estimated Annual ROI 229% 211% Total Estimated Client Services ROI 217% 43
44 Project Goal: World-Class IT Service and Support Service consistently exceeds customer expectations Result is high levels of Customer Satisfaction Top Quartile Customer Satisfaction Costs are managed at or below industry average levels Cost per Ticket below average Bottom quartile Cost per Ticket Service and Support follow industry best practices Practices and Procedures are well defined and well documented Service and Support follows industry best practices Every transaction adds value A positive customer experience Creates ROI > 100% 44

45 Client Services at Emory is a Center of Excellence Costs are below average Efficient delivery of support services Quality of service is above average Effective delivery of support services ROI is well above 100% The support model is relatively mature Management is highly regarded and morale is good Self-Awareness is good you generally know your weaknesses Client Services has a progressive and proactive culture CSI Continuous Service Improvement e.g., production vs. service request Numerous improvements are underway Remedy upgrade, Bomgar implementation, for example Client Services has all the qualities of a Center of Excellence (COE) Client Services can serve as a model for other support functions such as CBS And can potentially absorb and/or supplement these support roles 45
46 Transformation Success Factors: Lessons Learned Establish a Current State Baseline Brutal Honesty about the Challenges Establish a Clear, Bold Vision Know Where you Want to Go Build Buy-in and Support from Senior Leadership Relentless Execution and Scalability Don t Get Sidetracked! Measure Your Progress Early Success Drives Even Greater Success! Communicate Your Progress Keep Sponsors Engaged Institutionalize Best Practices Make them Part of Your DNA! 46

47 47 From Good to Great in One Year!
48 Questions? 48 48
49
50 Thank You! 50 50
51 51 Questions?
52 From Good to Great The Emory Healthcare Success Journey! Your Speaker: Jeff Rumburg
53 About MetricNet Your Benchmarking Partner 53

54 Your Speaker: Jeff Rumburg Co Founder and Managing Partner, MetricNet, LLC Winner of the Ron Muns Lifetime Achievement Award Named one of HDI s Top 25 Thought Leaders in 2016 and 2017 Former CEO, The Verity Group Former Vice President, Gartner Founder of the IT Service and Support Benchmarking Consortium Author of A Hands-On Guide to Competitive Benchmarking Harvard MBA, Stanford MS 54


55 Contact MetricNet


56 Benchmarking is MetricNet s Core Business Information Technology Call Centers Telecom Service Desk Desktop Support Field Support Customer Service Technical Support Telemarketing/Telesales Collections Price Benchmarking Satisfaction Customer Satisfaction Employee Satisfaction 56


57 Meet a Sampling of Our Clients MetricNet Conducts benchmarking for IT Service and Support organizations worldwide, and across virtually every industry sector. 57
58
59 The Biggest Challenges Were Outside of Client Services Accountability was generally lacking Customer support is not always given high priority The backlog of open tickets is excessive Communication with the customer during open tickets is often lacking Expectations for Client Services from other support groups and resolver groups were unrealistic They want more initial troubleshooting, for example, but do not provide tools and training to support that goal There is very little knowledge capture outside of client services This exacerbates the challenge of Client Services providing initial troubleshooting Support groups and resolver groups outside of Client Services generally have limited metrics, and weak reporting Some do not even know their ticket volumes Access rights to key systems are sometimes denied to Client Services; e.g., eprint and certain password resets It is unclear when a project goes into production eicu, for example, continues to be managed as a project There is a lot of bypass, e.g., customers going directly to resolver groups for support 59

60 60 The Three Year Roadmap

61 Characteristics of an Optimized Support Organization 61


62 Backlog Reduction Action Plan Non-Client Services 62


63 63 From Client Services to Individual Agents

64 64 Maturing the Metrics