M A Y MIFI NASDAQ
|
|
|
- Blaise Richardson
- 5 years ago
- Views:
Transcription
1 M A Y MIFI NASDAQ
2 Safe Harbor Statement - The following presentation contains statements about expected future events that are forward-looking and subject to risks and uncertainties. For these statements, we claim the safe harbor for forward-looking statements within the meaning of the Private Securities Litigation Reform Act of For a discussion of factors that could cause actual results to differ materially from expectations, please refer to the risk factors described in our filings with the SEC. Non-GAAP Financial Measures- Non-GAAP gross margins, operating expenses, and earnings per share exclude restructuring charges, share-based compensation expenses, amortization of the debt discount and debt issuance costs associated with our convertible notes, charges related to acquisition and divestiture activities and acquisition-related intangible-asset amortization. This presentation contains references to certain non-gaap financial measures and should be viewed in conjunction with our press releases and supplementary information on our website ( which present a complete reconciliation of GAAP and Non-GAAP results. 2

3 3 An innovative global solutions provider. Simply connecting people with information.


4 4 MiFi. Enabler for IoT. Leverage MiFi R&D Capabilities, Scale Manufacturing & Positive Cash Flows MiFi Portfolio Software Firmware Manufacturing Scale +1,000,000 Units Annually Cash Flow Fleet Management


5 5 Customers. Partners.


6 6 Target Regions. Telematics Growth. Telematics leads IoT 25% CAGR GLOBAL through 2020* 35 % CAGR* North America 28 % CAGR* UK/Western Europe 19 % CAGR* Russia/Eastern Europe Latin America 20 % CAGR* 17 % CAGR* Middle East / Africa Australia 25 % CAGR* = Potential high growth regions = Current focus regions for SOURCES: ABI Research, Frost & Sullivan, Berg Insight; Markets and Markets, TechNavio


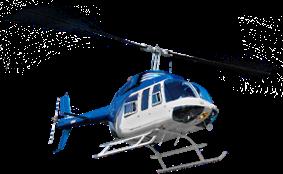
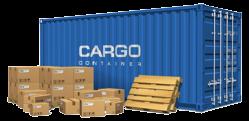
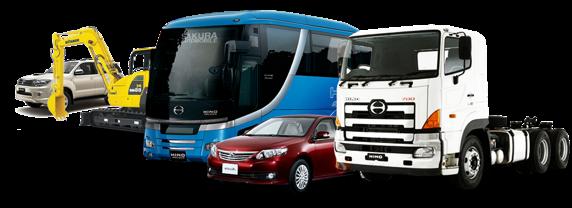
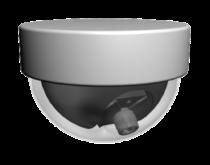
7 7 Diverse Fleet Management. Proven Tracking Solutions. Containers, Refrigeration Private Driver, <5 Vehicles Aircraft, Bus/Transit +30 Years of Offering a Diverse Range of Intelligent Solutions. Security Guards, Technicians Municipalities, Local Delivery Construction, Agriculture


8 8 Telematics. Solutions. Stolen Vehicle Recovery FLEET MANAGEMENT SMB Enterprise Asset Tracking / Monitoring Usage Based Insurance


9 9 Full, Modular. Fleet Solutions. FLEET SOLUTIONS Heavy Trucks Enterprise GROWTH 15-20% CAGR MARKET PENETRATION 45% SMB Local Fleet 22% CAGR 31% Consumer Rental Fleets 34% CAGR 13%


10 10 Exceptional SMB GROWTH Fueled by ROI Value Proposition. Driver Terminal - Job Dispatch - Navigation Driver Identification Driver Behavior Tracking Light Commercial Van- Monthly ROI Industry Standard per Unit Monthly Investment Monthly Fuel Saving $25-40/van $35/van Monthly Overtime Savings $80/driver Productivity Increase $133/Increased Billing Total Monthly Savings = $248 Per vehicle Return on Investment 7:1 Vehicle Diagnostics Fuel Consumption *Example only; Metrics by region varies Figures not to be interpreted as Guidance


11 11 High Growth Telemetry Segment. Connected Retail. Connected Retail 22% CAGR GLOBAL through 2022* 24/7 Vending Machine Kiosk Digital Signage Point of Sale Failover SOURCES: Grand View Research;


12 12 Connected Retail. Connectivity- as- a- Service. SOURCES: Grand View Research;
13 FINANCIAL HIGHLIGHTS

14 14 Improving Margins. Return to Profitability. Company guidance provided on May 9, 2016 Drivers Quarterly Non- GAAP Gross Margins 60%- 65% non- GAAP gross margins for Ctrack s telematics business. Highly profitable SaaS and service offerings improve mix of overall revenues. 23.9% 23.8% 24.8% 30.9% 27.7% 33.4% 35.2% 36% Low BoM for hardware offerings due to scale. Q3'14 Q4'14 Q1'15 Q2'15 Q3'15 Q4'15 Q1'16 Q2'16 Guidance Mid- point Stated Financial Objectives: 35%+ corporate non- GAAP gross margin; 70%+ non- GAAP gross margin for SaaS and Services
15 15 Increased Revenue Mix. Return to Profitability. Drivers Annual SaaS, Software, and Services Growth Acquisitions in Q1 15 and Q4 15 transform the business towards SaaS and Services from pure- play hardware. Global growth trends in fleet management telematics and telemetry. $0.5M Revenue $12.8M Revenue 534,000 Subscribers 150,000 0 Subscribers Q1'14 Q1'15 Q1'16 Growth in managed services. Stated Financial Objectives: 20% Growth in Fleet Management Telematics Subscribers and Overall Subscribers
16 16 Increasing EBITDA. Return to Profitability. Company guidance provided on May 9, 2016 Drivers Increased gross margin from improving revenue mix drives gross profit. Adjusted EBITDA Growth (millions) Expense controls and synergies from acquisitions reduce operating costs. Telematics SaaS business (Ctrack acquisition) generated $2.2M of positive adjusted EBIDTA in Q1 16. ($2.3M) ($0.3M) ($0.1M) $1.5M Q2'15 Q3'15 Q4'15 Q1'16 Q2'16 Stated Financial Objective: $7 million Adjusted EBIDTA in Fourth Quarter 16 $1.3M Guidance Mid- point
17 17 2Q Guidance Key Metrics. Company guidance provided on May 9, 2016 Q4-15 Financial Results Q1-16 Financial Results Q2-16 Financial Guidance* Revenue $61.5M $66.9M $57M - $63M Non- GAAP Gross Margin 33.4% 35.2% 34.5% % Non- GAAP OperatingExpenses $22.9M $24.4M $22.5M - $25.5M Adjusted EBITDA ($0.1M) $1.3M $1.0M - $2.0M Non- GAAP EPS ($0.04) ($0.08) ($0.08) ($0.05) *Ctrack guidance is included within Financial guidance. Q2-16 Guidance for Ctrack: Revenue $14M - $16M; Non- GAAP Gross Margin 60% - 65%; Adjusted EBIDTA $1.5M - $2.5M