Safe Harbor & SEC Regulation G
|
|
|
- Elaine Malone
- 5 years ago
- Views:
Transcription

1
2 Safe Harbor & SEC Regulation G Safe Harbor Statements made in the course of this presentation that state the company s or management s hopes, beliefs, expectations or predictions of the future are forward-looking statements made pursuant to the safe-harbor provisions of the Private Securities Litigation Reform Act of Actual results and performance could differ materially from those set forth in the forward-looking statements. Additional information about forward-looking statements and factors that could cause or contribute to actual results differing materially from those in the forward-looking statements is contained in our filings with the Securities and Exchange Commission (SEC), including our Annual Report on Form 10-K, our Quarterly Reports on Form 10-Q and our Current Reports on Form 8-K. We undertake no obligation to publicly update or revise any forward-looking statements, whether as a result of new information, future events or otherwise. Non-GAAP Information - This presentation includes non-gaap financial measures, including net sales less excise taxes, remaining gross profit, free cash flow and adjusted earnings, before interest, taxes, depreciation and amortization (EBITDA) after certain items. These measures are classified as non-gaap financial measures by the SEC and may be different from non-gaap measures used by other companies. We believe these non-gaap financial measures provide meaningful supplemental information for investors regarding the performance of our business and allow investors to view results in a manner similar to the method used by our management. EBITDA is also among the primary measures used externally by our investors, analysts and peers in our industry for purposes of valuation and comparing our results to other companies in our industry. Our management uses net sales less excise taxes and remaining gross profit to separate changes in sales and profitability due to actual sales and other changes in core operations from the effects of increases in excise taxes, LIFO accounting, inventory holding profits and certain other items. Our presentation of this information is not intended to be considered in isolation, and these non-gaap measures should be considered as a supplement to, and not as a substitute for, or superior to, financial measures calculated in accordance with GAAP. Reconciliations of these non-gaap financial measures to the most comparable measures prepared in accordance with GAAP are included in the appendix to this presentation. 2

3 Our Values & Our Culture Our Mission is to be the most valued marketer of fresh & broad-line supply solutions to the convenience retail industry. 2
4 Our Team Some of Our Key Players. Chris Hobson o SVP of Sales & Marketing Bill Stein o SVP of Eastern Divisions Scott McPherson o SVP of Business Operations & Strategic Development Chris Miller o SVP and CFO 3


5 Our Business Core-Mark plays a critical role for Fresh Food & consumer package goods wherever they are sold in a convenient format Core-Mark ~85 million cubic feet per year ~54,000 SKUs & 4,400 vendors Through 32 distribution centers* and ~970 tractors & ~800 tri-temperature trailers to over 44K retail locations 4


6 Core-Mark s Customers Building Deep Relationships with best in class retailers 5
7 Our Core Strategies for Growth Vendor Consolidation Initiative Streamlines and take costs out of our customers supply chain Fresh & Foodservice Market leader in innovative programs to address the emerging trends Focus Marketing Initiative Transformative consulting & category management for independent retailers Acquisitions Take our business model to where the most c-stores are located 6

8 7 Our Share Price
9 Agenda Each minute presentation will be followed by a brief Q & A. Then at the end of the presentations we have allowed 30 minutes for Q & A followed by 1 ½ hour lunch buffet. 8
10
11 Topics How does Core- Mark win customers? What role does marketing play within the organization? Data analytics and harvesting internal data to enhance decision making. Trends in tobacco and the distribution economics of the tobacco categories. 10 Chris Hobson SVP of Sales & Marketing September 7th, 2016
12 Topics How does Core- Mark win customers? What role does marketing play within the organization? Data analytics and harvesting internal data to enhance decision making. Trends in tobacco and the distribution economics of the tobacco categories. 11


13 The Core- Mark business model Sustainable Competitive Advantage Growing our customers sales, profitably. Making it easier for our customers. Doing the fundamentals well. 2/3 rd s of the C Store Industry are single store owners, relying on Core- Mark for new, consumer relevant & innovative marketing programs coupled with data backed analytical decision making. Continuous improvement of customer touching technology & retail support. Smart Ordering B.Y.O.D. APP Technology Field support > 1, % Fill Rate target 99.75% Order Accuracy target 95% On time delivery target. > 54K sku Assortment National buying power/ best bracket 12
14 Core Strategies Fresh VCI FMI FRESH FOOD Provides new category sales Supported by multi week delivery VENDOR CONSOLIDATION Provides low cost additional deliveries Reduces Cost of Goods FOCUSED MARKETING Data driven decision making for single store owners & others. 13

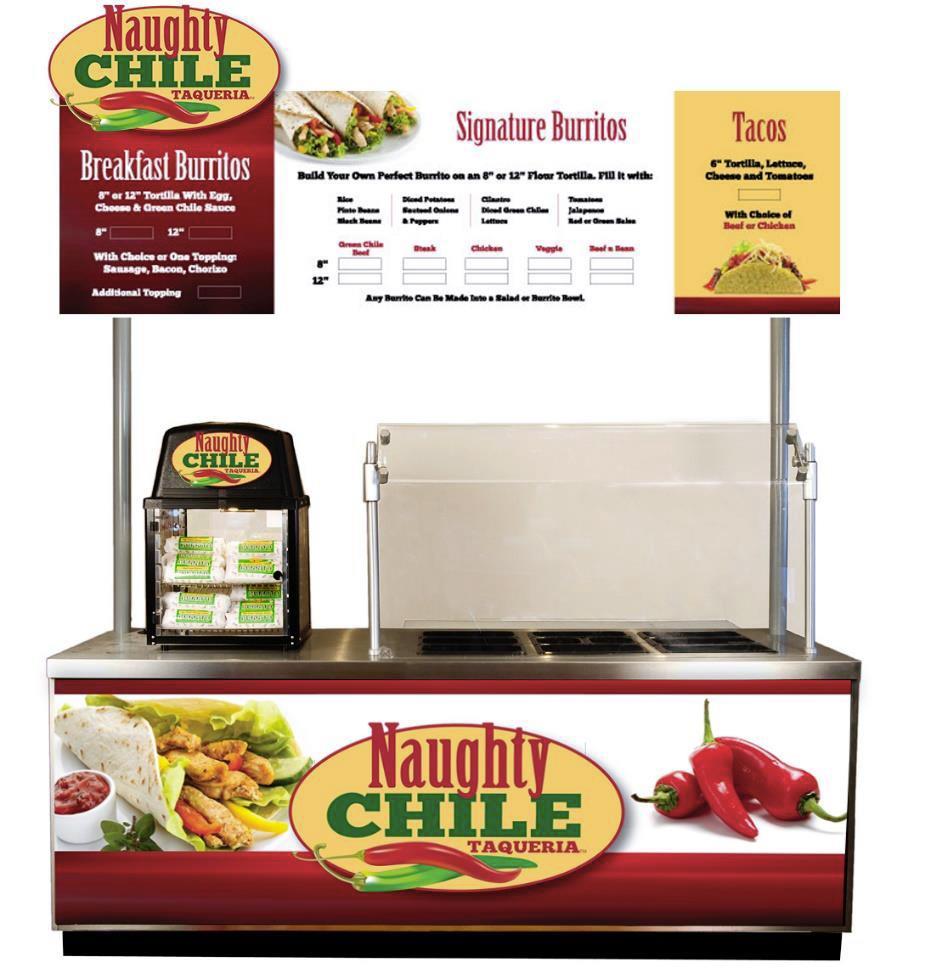
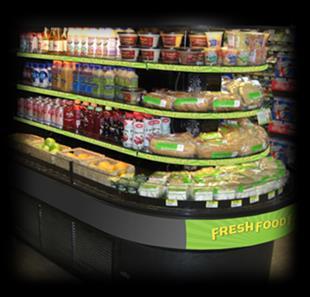
15 Fresh 59% of consumers say that they sought more healthy food options at convenience stores than in the previous year. Consumers expectations are changing, demanding more from C-stores, including Fresh Adding freshness cubes attracts new consumers Still significant penetration opportunity for Fresh in existing customer base. 14


16 15 Fresh

17 16 Fresh

18 Vendor Consolidation Traditional wholesalers revenue is < 50% of what a small format retailer purchases. Inherent issue with 1 delivery a week. We bid on additional variable cost basis. Solves many C store retailer issues with out of stocks & Inventory turns. 17

19 Focused Marketing Leverages internal data and external data to rationalize product/ space/ price points. Enables independents to utilize resources unavailable to them previously. Solves many C store retailer issues. 18


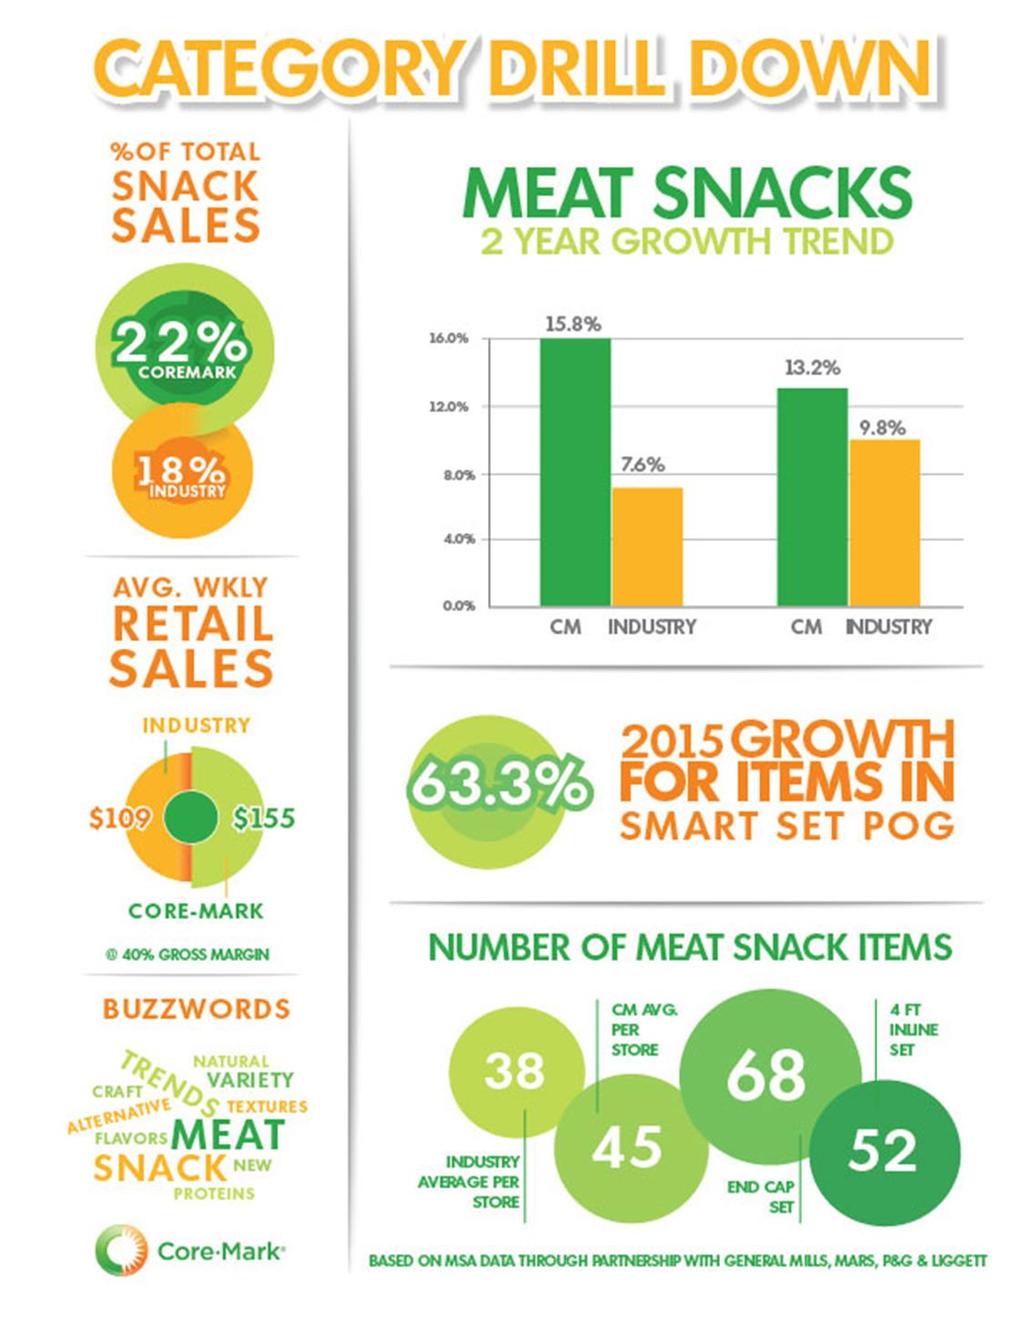
20 Why is FMI Important? Indy s Fuel Sales are 82% of Chains Inside Sales only 57% Pretax Income 66% Large Chains are doing better job capturing Fuel Customers Category Management is the key to driving incremental sales! 19 Source: NACS SOI (151 firms representing 14,332 stores)
21 Market Share update/c stores Year CM McLane EBY HT GSC 2004 $4.9B $19.5B $4.4B $3.6B $1.2B 2005 $5.3B $21.0B $4.3B $3.9B $1.2B 2006 $5.3B $25.6B $4.4B $3.6B $1.2B 2007 $5.6B $28.0B $4.4B $3.6B $1.2B 2008 $6.0B $24.2B $4.5B $3.6B $1.2B 2009 $6.5B $26.6B $4.5B $3.6B $1.2B 2010 $7.3B $27.3B $4.5B $3.6B $1.2B 2011 $8.1B $27.3B $4.5B $4.0B $1.3B 2012 $8.9B $28.9B $4.9B $4.0B $1.3B 2013 $9.8B $31.8B $5.0B $4.0B $0.8B 2014 $10.3B $31.7B $5.3B $4.0B $0.8B Source: Debra Chanil of Nielsen CM Retailers 19K 21K 21K 24K 24K 26K 28K 29K 30K 32K 36K Source: CM Datacube 20
22 Topics How does Core- Mark win customers? What role does marketing play within the organization? Data analytics and harvesting internal data to enhance decision making. Trends in tobacco and the distribution economics of the tobacco categories. 21


23 Marketing = On Trend, Relevant Programs Anticipate and Pre-empt the Demand for a Health-Focused Food Offering Consumers definitions of health will continue to evolve, and descriptors like fresh, local and sustainable will lose their elitist associations and be demanded by all consumers, not just the affluent or activists.- Technomic 22 76% of today s consumers are looking for healthier eating options 53% of consumers would visit c-stores more for healthier foods. 50% convenience stores have expanded fresh fruit sales; 30% have increased cut fruit & vegetable offerings. NAC s surveys, June 2015.


24 Marketing = On Trend, Relevant Programs Anticipate and Pre-empt the Demand for a Ethnic focused food offering Minorities will be the majority in the U.S. by 2043 Hispanic consumers are growing rapidly as a customer base in the U.S. Hispanics will comprise 25% of the population by Major urban areas will see continued growth in acculturated and nonacculturated Hispanics Core-Mark working to provide a single source solution for Hispanic Snacking supported with Planograms 23


25 24 Foodservice branded solutions


26 25 Center Store focus
27 Topics How does Core- Mark win customers? What role does marketing play within the organization? Data analytics and harvesting internal data to enhance decision making. Trends in tobacco and the distribution economics of the tobacco categories. 26


28 Core Solutions Group Data mining Team created 5 years ago to analyze both internal & external data to create comprehensive analytic backed consultative suggestions. Expanded from FMI to include analytical engine behind CRM, Core Analytics & Core Logistics. 27
29 Topics How does Core- Mark win customers? What role does marketing play within the organization? Data analytics and harvesting internal data to enhance decision making. Trends in tobacco and the distribution economics of the tobacco categories. 28

30 29 Cigarette Units
31 30 Cigarette Pricing

32 Channel Share C-Stores See Their Share of Cigarette Volumes Improve in 2014 Through the first half of 2014 convenience stores claimed another 1% of the overall volume, according to a presentation by Management Science Associates. egorynews/tobacco/articles/walgreensfeels-tobacco-heat 31
33 Tobacco Consumer 66% of OTP used smoke cigarettes and conversely 13% of cigarette smokers use OTP. Moist Snuff 5.1% 19.7% 48.4% 26.8% MST & Snus MST & Cigarettes MST, Snus, & Cigarettes MST only About 2/3rds of MST dippers also smoke cigarettes and use snus; only about 1/4 th of dippers use only MST Cigarettes 3.8% 6.3% 87.2% 13% of cigarette smokers also use smokeless tobacco (about 6MM people) Cigarettes & Snus Cigarettes, MST, & Snus Cigarettes & MST Cigarettes only 32 Source: 2014 Swedish Match Market Tracker research.


34 Margin % Margin % to Cube Matrix High Med Low Small Med Large CUBIC FEET 33 For illustrative purposes only


35 Tobacco summary Levers for price increases to offset volume decline. OTP users tend to also be cigarette users. C- stores gaining share Low margin Core- Mark category but generates solid GP$ s per cubic foot 34


36 All of us at Core- Mark Thank You for Your Interest Dedicated to Customer Service for over 125 years 35
37
38 Presentation Agenda How we Partner with our Customers New & Existing Improving Performance with Data Analytics The Value of Focused Marketing (FMI) The Value of Vendor Consolidation & Fresh Competitive Environment Q & A Bill Stein SVP of US Divisions East September 7,


39 Customer Partnership Customer Relationship Cycle Prospecting Messaging Separation Supporting 38


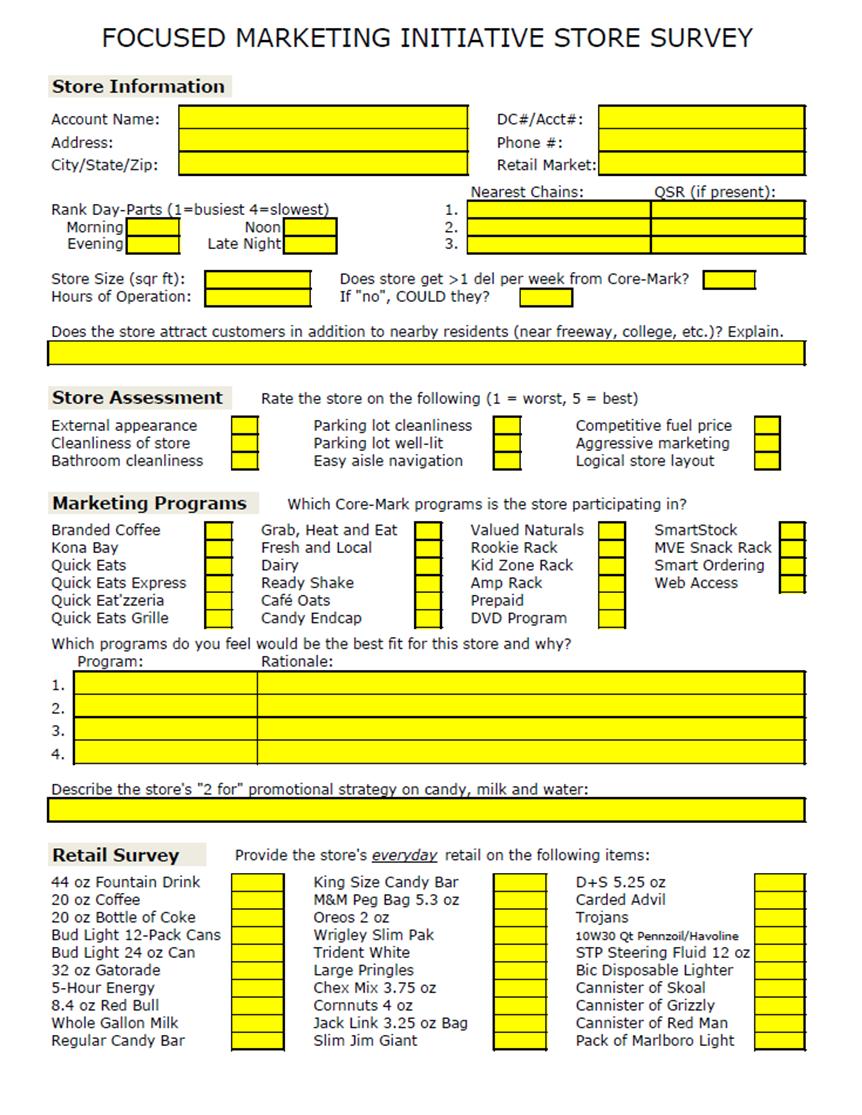

40 CORE Solutions Dashboards for Territory Managers and Sales Development Representatives Purchase Data vs. Benchmark Top Items by Commodity Program Compliance Populate FMI Survey Business Reviews 39


41 Focused Marketing Initiative Powered by The Flagship of Category Management! Primary components include: Demographic Study Using accredited Alteryx data to identify your Customers and the right solutions for their specific needs. Enhancing the Consumer Offering New and Unique Income Generating Opportunities including Core-Mark exclusives. 40 Product Mix Optimization Comprehensive analysis of current purchases versus other customers and the industry s top selling items. Vendor Consolidation Identify and eliminate supply redundancy, reducing overall cost of doing business. Competitive Comparison Retail-pricing strategies to increase profit and maintain your competitive edge. Space Rationalization Analyzed based on linear profit per foot methodology, this approach will help optimize your income opportunities.


42 2015 FMI Results FMI is closing the Pre-tax gap to large retailers Profit improvement ~20% Acceptance Rate of CORE recommendations now over 65% FMI Non-Cigarette Sales Growth running at ~2.5x of non-fmi 3,010 Marketing Plans Completed in

43 Why VCI? Coffee ($100/mo) Cleaning Supplies ($50/mo) Fresh ($100/mo) Meat Snacks ($50/mo) Milk ($200/mo) Div# Division 48 Albuquerque 37.3% 43.2% 45.6% 78.4% 26.1% 178 Atlanta 14.6% 35.7% 60.7% 88.1% 22.0% 23 Bakersfield 31.7% 17.6% 72.0% 68.7% 48.7% 280 Carolina 26.8% 44.2% 50.9% 90.4% 10.9% 35 Corona 36.8% 31.9% 70.8% 81.9% 21.7% 256 Denver 43.2% 35.4% 54.6% 80.6% 25.7% 160 Forrest City 11.5% 15.9% 21.5% 64.9% 12.4% 75 Fort Worth 24.6% 27.4% 51.5% 85.6% 33.3% 7 Hayward 28.0% 33.8% 73.1% 82.2% 25.9% 175 Kentucky 14.4% 22.9% 29.4% 86.3% 24.2% 65 Las Vegas 61.6% 47.2% 77.5% 83.0% 46.8% 42 ** Source: NACS SOI 2013


44 Retailer VCI Current Solution Situation Benefits Fund 2 nd Delivery from Core-Mark Reduction in transactional costs associated with multiple vendors Improved inventory turns Reduce Out- Of Stocks Average 13% per GMA study. Lower landed cost of goods ~ 40% of Supplier Cost embedded in transportation 70% of that cost is variable Delivery platform to support Fresh. 43


45 44 Fresh Initiative

46 Factors that raised the bar Upgraded Sales Force FMI VCI Fresh 45


47 Is it working? January January February March March September December 46
48 47 Q & A
49
50 Presentation Agenda Operational Performance Operating Expense Leverage Acquisition Approach Scott McPherson SVP of Business Operations & Development September 7,


51 Warehouse-Foundation For Success People Hiring Screening, education Training Standardized, crosstraining, safety Developing Leadership training & succession planning Technology DCMS Warehouse management system Pick to Light Selection technology Radio Frequency Scanning based selection & receiving Batch Order Selection Multi-stop selection Discipline Measure Results Core-Logistics creates consistency of metrics Manage To Metrics We are a company of standards! Recalibrate Continually evaluate performance & react 50

52 51 The Power of Core-Logistics


53 Other System Enhancements Recent Warehouse Innovations Load Out Loop staging of multiple trucks simultaneously Robotic Stacker brings efficiency to the tote stacking process Mobile Tote Wrapping portable/automated pallet wrapping Selection Error Solutions System scans each carton UPC and tax stamp, validating a match with product ordered Focused on divisions with multiple cigarette jurisdictions Improved Visibility To Concealed Shortages System photographs/straps 100% of totes prior to loading A customer-centric approach to validating concealed order issues 52

54 Transportation-Foundation For Success People Hiring & Recruiting Recruiting, testing & training Training Standardized with focus on safety & customer service Developing In-house Driver Training Program Technology Peoplenet Fleet performance monitoring CoolTracs Cold-chain compliance Roadshow Routing optimization Driver Handheld New technology Discipline Measure Results Truck performance metrics consistent Manage To Metrics Established standards across divisions Recalibrate Continually evaluate performance & react 53
 Temperature Monitor Door Monitor Fleet")

55 Managing Truck Performance Customer On-Time Delivery Outperform Competition Achieve 90% On-Time Delivery Employ a 2-Hour Window Cold-Chain (Cooltracs) Temperature Monitor Door Monitor Fleet Performance (Peoplenet) Miles Per Gallon DOT Enforcement Speed Gauge Idle Time Fleet Utilization TE Cubic Ft of Product XT Per Load Travel Miles Per Stop Total Travel Miles Per Route Total Stops Per Route 54


56 Driver Handheld Technology (Beta) Make It Easier For Our Customers Simplify the Check-In Process Automate the Credit Process Customer Verification Driver Counts Paperless Environment Option Signature Capture Provide Employees Tools To Be Successful! Automates the Check-In Procedures Reduces Paperwork Automates Truck Reconciliation at Warehouse Quick Resolution to Delivery Issues 55

57 Operating Expense Levers Keys Expense Levers & Influences Cost Per Cube Cube = cubic ft. of product shipped Increases as cartons increase Decreases as non-cig mix improves Decreases as productivity & throughput increase Decrease as cartons increase Increases as non-cig mix improves Decreases as productivity & throughput increase Expenses as a % of Sales 56
58 Leveraging Operational Expenses Warehouse Expenses Largely variable expenses Leverage from increased volume Leverage from technology Leverage from productivity Leveraging Operation Expense General & Facility Expenses Largely fixed expenses Leverage from volume Leverage technology advancements Transportation Expenses Largely variable expenses Leverage from route optimization Leverage from acquisitions Leverage from technology 57

59 Acquisition Strategy Acquisition Objectives Geographic Expand our footprint and leverage our cost to service customer nationwide Strategic Acquire competitors that would afford us competitive advantages in the marketplace Opportunistic Capitalize on opportunities to acquire underperforming wholesalers Industry Changing Make one of a small handful of acquisitions transformational Accomplishments In 2006 Acquisitions became a key element of our Growth Strategy In 2006 establishing New Facilities became part of our strategy to support Growth 58


60 Parallel Approaches to Valuation Multiple Approach Derive Core EBITDA Assess Quality of Assets Assess Quality of Earnings Quantify Synergies Evaluate Risk Profile Benchmark Value Using Industry Multiples Populate 5yr DCF Model to Evaluate Returns Many of our Acquisition Targets carry assets that would exceed an industry multiple of EBITDA. Book Value Approach Derive Core EBITDA Assess Quality of Assets Assess Quality of Earnings Quantify Synergies Evaluate Risk Profile Assess Book Value & Other Purchase Incentives Populate 5yr DCF Model to Evaluate Returns Approaching the purchase on a book value basis and focusing on other Income Streams has been effective. 59


61 Expanding Our Presence Vancouver Calgary Portland Spokane W innipeg Minneapolis Toronto New England North New England Sacram ento Hayward Salt Lake City Denver Ohio Pennsylvani a Bakers field Los Angeles Las Vegas Kentucky Carolina Corona Albuquerq u e Forrest City Atlanta 6 Acquisitions 3 New Buildings 2 Building Upgrades Fort W orth Tam pa 60
62 61 Questions
63
64 Driving Solid Financial Results Core Strategies and Market Share Growth Driving Strong and Consistent Financial Results GROSS MARGIN EXPANSION ~$182M increase in remaining gross profit* over 5 years PROFITABILITY GROWTH Adjusted EBITDA growth of 10% CAGR last 5 years CAPITAL DEPLOYMENT $169M invested in business Over $90M returned to investors last 5 years 63 * See appendix for reconciliation of GAAP gross profit to remaining gross profit
65 $ Billions Consistent Growth Net Sales $12,000 $10,000 $8,000 $8,115 $8,892 $9,768 $10,280 8% CAGR $11,069 $6,000 $4,000 $2,000 $ Excise Tax Net Sales Less Excise Taxes 2016 Net Sales expected to increase 27-31% y/y 64
66 $ Millions Focused on Margin Expansion $700 $600 $500 $437.5 $481.3 $536.8 $ % CAGR $618.9 $400 $300 $200 $100 $ Cigarettes RGP Non-Cigarette RGP Core Strategies target higher margin products 65 * See appendix for reconciliation of GAAP gross profit to remaining gross profit (RGP)
67 $ Millions Strong Profitability Adjusted EBDITA* $ % CAGR $135.2 $125.0 $100.0 $91.9 $100.8 $109.5 $122.7 $75.0 $50.0 $25.0 $ Adjusted EBITDA ex holding gains Cigarette holding gains Non-cig Non-cigarette holding non gains Supports strategic initiatives to drive growth 2016 Adjusted EBITDA expected to increase 16-21% 66 * Please see appendix for reconciliation from Net Income to Adjusted EBITDA

68 Adjusted EBITDA Growing Faster Than Sales Growth 200% 190% 180% 170% 160% 150% 140% 130% 120% 110% 100% Sales Growth EBITDA Growth 67
69 $ Millions Solid Cash Flow Growth $90 $80 $70 $60 $71 $59 $67 $77 $50 $40 $43 $41 $39 $30 $20 $10 $0 $11 $(13) $7 -$10 -$ Operating Cash Flow Free Cash Flow Cash flow reflects investment in growth Strong focus on returning value to shareholders 68
70 Returning Value to Shareholders $25 Strong dividend and share repurchase program $20 $9.2 $7.0 $15 $10 $19.0 $5.2 $7.2 $8.0 $5 $10.3 $7.1 $10.7 $12.8 $15.0 $- $1.9 FY 2011 FY 2012 FY 2013 FY 2014 FY 2015 YTD 2016* Dividends Shares Repurchases Dividend paid in 2015 up 20% Dividend payout over 4 years up 58%* 69 * FY 2013 dividend payout adjusted for Q1 dividend paid in Q4 2012
71 2016 Growth Outlook Reiterating 2016 Guidance SALES ADJUSTED EBITDA EPS (EXCLUDING LIFO) CAPX 27% 31% GROWTH 16% 21% GROWTH 17% 24% GROWTH ~$50 MILLION 70
72 Positioned to Deliver Shareholder Value Strategies create foundation for future growth Opportunity to capture significant market share Strong financial discipline Operating leverage opportunity Solid balance sheet Focus on growth and return of capital 71
73 72 Appendix
74 Remaining Gross Profit Reconciliation of Gross Profit to Remaining Gross Profit Core-Mark Holding Company, Inc. Millions Gross Profit $ $ $ $ $ Cigarette Holding Gains (8.2) (7.8) (9.0) (8.2) (10.1) Candy Inventory Holding Gains (5.9) - - (6.0) - Cigarette Tax Stamp Inventory Holding Gains (9.0) OTP Tax Items (0.8) - - (8.5) (1.8) LIFO expense Remaining Gross Profit $437.5 $481.3 $536.8 $567.3 $
75 Adjusted EBITDA Reconciliation of Net Income to Adjusted EBITDA Core-Mark Holding Company, Inc. Millions Net Income $ 26.2 $ 33.9 $ 41.6 $ 42.7 $ 51.5 Interest expense (net) Taxes Depreciation & amortization Amortization of stock compensation Foreign currency transaction losses (gains) LIFO expense Adjusted EBITDA (FIFO) $ 91.9 $ $