RITIS for Work Zones. Work Zone Monitoring Dashboard & Collaborative Meetings for Planning of Work Zones. Performance Measures. Planning.
|
|
|
- Georgia Lloyd
- 5 years ago
- Views:
Transcription


1 RITIS for Work Zones Work Zone Monitoring Dashboard & Collaborative Meetings for Planning of Work Zones Performance Measures Planning Operations Archive Communications Enabling Decision Making & Effective Communication

2 RITIS Fusion & DSS 2


3 2013 Michael L. Pack, UMD CATT Laboratory Our Goal with RITIS is to: Provide tools to make data easily accessible, usable, Understandable, and allowing for insights discovery To domain experts or the general public 3

4 4


5 Context Probe Analytics 2


6 Improving Work Zone Safety and Mobility


7 Background Motivation Compliance with Final Rule on Work Zone Safety and Mobility Funding In 2013 MD SHA and FHWA funded a project to develop a real time performance monitoring tool for work zones using INRIX probe vehicle data and event data. 2
 Upstream Downstream Work Zone Work Area Calculated using: ADT (AADT with adjustment factor) Passenger/commercial vehicle")
8 Data Sources and Key Definitions Active work zone information provided by SHA CHART system in real-time. Probe vehicle speed information from INRIX. Queue/Bottleneck Roadway Work Zone User Delay Cost (UDC) Upstream Downstream Work Zone Work Area Calculated using: ADT (AADT with adjustment factor) Passenger/commercial vehicle percentages Speed reduction factor Delay 2


9 Audience and Goals Audience: Project Engineers and Managers Goals: Real time performance Alerts when thresholds exceeded Potential actions based on identified performance Audience: Public Relations Goals: Real time and historical performance Responding to complaints and inquiries Corridor performance Regional performance Audience: Planners and Decision Makers Goals: Closure costs Review of previous performance Individual work zone performance 2

10 Work Zone Dashboard Overview Critical List Map Delay 10 2

11 Overview List

12 Work Zone Dashboard

13 Critical Work Zones

14 Critical Work Zone Parameters

15 Work Zone Dashboard

16 User Delay Cost Information

17 UDC Options and Corridor Selection

18 Work Zone Dashboard 18

19 Map Layers and Options

20 Individual Work Zone Profile Settings L a Performance Charts Map n e s Delay

21 Settings and Map

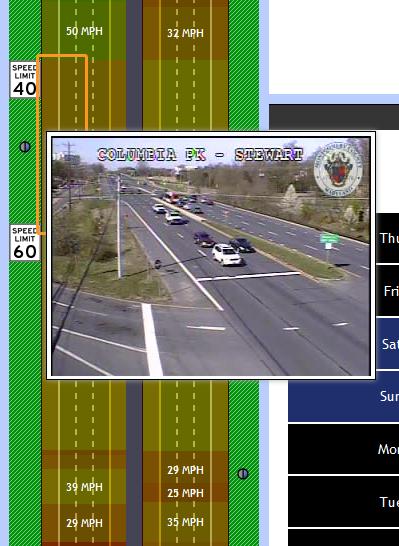


22 Lane Profile Bottlenecks & Nearby Events Segment Speeds Live CCTV & DMS
23 Individual Work Zone Profile
24 Performance Charts
25 Performance Charts
26 Adjusting Parameters
27 Filtering Results

28 Individual Work Zone UDC
29 I don t have time to watch the Dashboard all day long! Can t you just tell me where the problems are?
30 Work Zone Alerts

31 Work Zone Alerts


32 Next Steps I-95 Corridor Coalition Expansion I-95 CC awarded $300,000 to deploy to as many agencies as possible. Backend re-architecture for scalability across 17 states. Data collection to support the application. Improvements Increased spatial granularity of probe vehicle data. Multiple probe vehicle data providers.
33 Planning & Collaborating The RITIS Meeting tool is being used by construction managers, operations, and others to help plan (on a weekly basis) which work zones are expected to occur, how that might impact traffic, and facilitate a dialogue about how to best manage traffic and safety. 33
 It s situational awareness")
 Probe speed data/dms messages It s collaborative decision-making Leverage multiple layers of data Share documents Discuss ideas &")

34 What is RITIS Meeting? It s a virtual meeting platform Anytime/anywhere PC or mobile device, such as ipad (participants only) It s situational awareness Weather (radar, alerts, road surface condition) Events/Incidents (construction, crashes, etc.) Probe speed data/dms messages It s collaborative decision-making Leverage multiple layers of data Share documents Discuss ideas & recommendations Conduct attendee polling It s multi-faceted Multi-agency/multi-user Plan, respond to, follow-up on Extreme weather, special events, incident management It s fast and easy Simple set-up of meetings, creating agendas One-click e-links to send to attendees Intuitive & user-friendly Instant follow-up with an automatically generated meeting log (MOR) Cover photos source: 4


35 The Meeting in Progress Screen After you start a meeting, you ll see four basic areas of the host s meeting in progress screen A Details/Checklist and Forecast Column B Map/Document Area C The Polling Area & Attendance/Questions Column B A C 5
36 Ways to Communicate Take a Poll: Enter Notes: Submit a Question: 36

37 The Map/Document Area Show Document You can upload documents into the mapping area for viewing and discussion: 37


38 The Map/Document Area - Traffic-related Data Click on the checkboxes in the Layer List to activate or deactivate Incidents and Events, DMS & Probe Speed Data: Then click on a map icon to bring up more information 38


39 The Map/Document Area - Weather-related Data Click on the checkboxes in the Layer List to activate or deactivate Road Weather, Weather Alerts and Weather Radar: Then click on a map icon to bring up more information 39


40 The Map/Document Area Weather Radar Weather Forecast Chance of Precipitation Weather Radar includes a total of five conditions and forecasts: Temperature Snowfall 40

41 The Map/Document Area Evacuation Support This map shows layers pertaining to evacuation support: routes, staging areas, hospitals, traffic control points, etc. 41


42 The Map/Document Area Evacuation Support Data Click on the checkboxes in the Layer List to activate or deactivate Evacuation Routes, Staging Areas, Comfort Stations, Hospitals, etc.: Then click on a map icon to bring up more information 42


43 After the Meeting An , with a complete log of all information, will be automatically generated and sent to all participants. 43

44 Collaborative Decision Making Collaborative Decision Making Tools Meeting in Progress Clear, comprehensive, and organized layout of tools and information makes collaborating simple and easy. Active Poll Notes/Agenda Event Timeline/Forecast Attendee List Annotations 44


45 Collaborative Decision Making Collaborative Decision Making Tools Meeting in Progress (Cont d.) Pre-weather event meeting showing impending weather and incidents. 45
 Running a Poll The host of the meeting or a designated presenter can share images and documents during the meeting. This person can add and remove annotations on the files they are sharing.")
46 Collaborative Decision Making Collaborative Decision Making Tools Meeting in Progress (Cont d.) Running a Poll The host of the meeting or a designated presenter can share images and documents during the meeting. This person can add and remove annotations on the files they are sharing. In the image below, RITIS Meeting is used during a water main break to identify closures, rerouting, and other items. The meeting host used the drawing tool to walk participants through the event


47 Collaborative Decision Making Collaborative Decision Making Tools Meeting Log A meeting log is generated after every meeting. This log keeps track of all the information shared in the meeting, and is sent out to all the participants afterwards. 47
48 Other tools for evaluating Work Zones The Probe Data Analytics Suite has additional features and functionality that can be used to measure the impacts of construction events, and then 48

49 Probe Data Analytics Can Supplement RITIS Meeting I-95 Reconstruction in Philadelphia Construction began late 2011; multiple sections underway starting late 2012 Graphic instantly communicates impacts to wide variety of audiences Spatial and temporal Great starting point for analysis of changes/issues 14

50 Probe Data Analytics Can Supplement RITIS Meeting Impact of the Amtrak Derailment & Suspension of SEPTA s Trenton Line Significant travel time increases on I-95 Wednesday and Thursday Likely that most Trenton Line riders ended up driving Still working on analysis of hourly volumes 15


51 Other Probe Data Analytics Tools User Delay Cost tables and Animated Comparison Maps can all be used to help show the impacts of work zones 51


52 These slides were produced using tools developed by the CATT Laboratory. For more information, contact the Lab Director Michael L. Pack CATT Laboratory npmrds.ritis.org