2015 Financial Statements. Amsterdam, 23 February Sharing our DNA
|
|
|
- Jennifer Bryant
- 5 years ago
- Views:
Transcription

1 2015 Financial Statements Amsterdam, 23 February 2016 Sharing our DNA
2 Agenda 2015 Main Points Market and Positioning Financial Operational Outlook and Conclusion

3 2015 MAIN POINTS
4 2015 Main Points Our customers are moving from equipment manufacturer to solutions provider Reinforcement of position as one-stop provider and Life Cycle Manager Roll-out of DNA & Leadership cultural programme Intensifying of cooperation with customers and Preferred Suppliers Operational performance IT improvement programme Organisational adjustments at NCWS and NME to customer demand
5
6 Market and Positioning
7 EMS Market Trends Globalisation of OEMs Increasing demand from OEMs for Life Cycle Management, early involvement and shared participation in the development process of a product Increasing use of electronics in automotive and medical Volatility is a given (The only constant is change) Reduction of product life cycles Increasing investment levels
8 EMS Market Trends Increased intensity in cooperation within the chain as a result of transparency and modern means of communication Consolidation in the market from the bottom up Transition to more regulations Design for best production method with more controlled transfer moments Product traceability
9 Positioning in EMS - Market Close to the customer High added value / expertise & service From EMS to Product Life Cycle managementsts Growth sectors: Industry, Semicon, Medical, Automotive and Defence Development & Production of electronic components to complete box build systems Full-service solution, One-stop providership Industry/professional market B2B-OEM & first tier
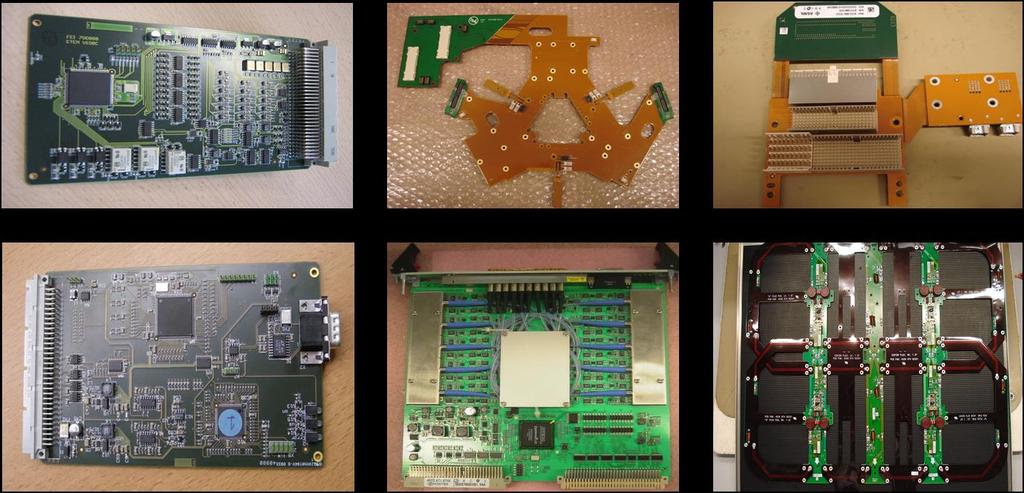
10 Company Profile Neways Development, engineering & services Micro electronics Connectivity; cable & wire Electronics assembly System integration
11 Strategical direction Neways Neways Customer Values Life Cycle Management CUSTOMER INTIMACY ANCHOR Anchor point is customer intimacy supported by the right balance in cost and technology leadership. DISCRIMINATOR BENCHMARK PRODUCT LEADERSHIP Product Ownership Neways a Tech. Company COST LEADERSHIP Neways Business Model Lean Approach CONTEXT Behaviour, One Neways Lean Leadership Value discipline model Treacy en Wiersema
12 Neways and Life Cycle involvement We cover almost every stage of the life cycle management process within our core technology competences. Product roadmap Responsibility Customer Shared responsibility, Neways leads Responsibility Neways The best total cost of ownership (tco) throughout the complete product life cycle Field data
13 What makes Neways as a TCO partner? CULTURE TECHNOLOGY INTEGRATION We nurture a customer intimacy culture We are a technology company We embrace integrated thinking
14 ONE OFFS SOLUTIONS Neways is taking outsourcing to the next level MUTUAL BENEFITS We re at the stage that responsibility needs to be outsourced based upon a sustainable partnership TRANSACTIONAL PARTNERSHIP
15 FINANCIAL
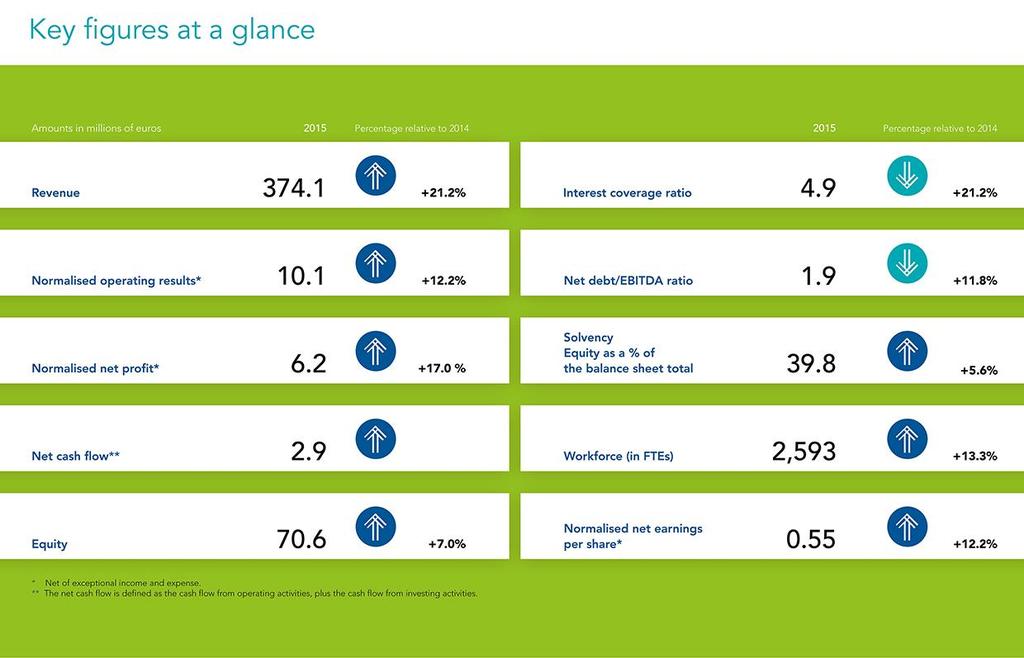
16 2015 Main Points More stable turnover, increasing order book Net turnover increases by 21.2% to m (2014: m) Turnover 2016 well started Sales show a more stable development in 2015, strong in Q3, more sales fluctuations in Q4 as a result of stock adjustments made by customers HY1 2015, organic -/- 6.3%, HY /+ 5.7% BuS Group turnover m (2014: 60.5 m) Order portfolio increased by 7.5% to 168 m as compared to year-end 2014 ( 156 m) Improved order book widely supported in the organisation Order portfolio increased by 5 m in HY2 2015
17 2015 Main Points Profitability more widely supported in the organisation Operating result, excluding extraordinary income and expenditure, increased in 2015 to 10.1 m (2014: 9.0 m) Operating result, including extraordinary income and expenditure, 5.9 m, as compared to 6.6 m in 2014 Lower profitability in Q4, fluctuations in capacity utilisation caused by stock adjustments made by our customers Non-recurring costs (external consultants, staff redundancy, new office automation, automotive readiness Wuxi) have put pressure on the result Reorganisation announced in December for NME and NCWS Net effect extraordinary income and expenditure -/- 2.8 m (2014: +/+ 1.7 m) Reorganisation costs for NME and NCWS activity ( 2.7 m; 2.0 m net) PPA effect on depreciation ( 1.4 m; 1.0 m net) Upward value adjustment of active deferred taxes (+/+ 0.3 m) Net profit decreased to 3.2 m (2014: 7.0 m) as a result of extraordinary expenditure Dividend proposal 40% (2014: 40% in shares) based on net profit including extraordinary income and expenditure 0.11 per share, payable in cash
18 2015 Main Points Healthy financial position Balance sheet ratios in order Balance sheet total slightly increased from m to m Shareholders equity increased as a result of the profit realised External net debt decreased from 34.8 m to 31.5 m Solvency increased to 42.6% (year-end 2014: 40.5%) Net cash flow +/+ 2.9 m (2013: -/ m) Operating capital increased by 5.6 m as a result of higher inventory and receivables Inventory increased as a result of deferral of orders by our customers Receivables increased as a result of higher turnover in December Debts repaid up to 3.3 m Investments ( 4.5 m) less than depreciation ( 8.3 m)
19 2015 Key Figures ( m) H H 2014 Net turnover 374,1 308,6 185,0 175,0 - nominal growth in % 21,2% 16,5% 5,7% 30,5% - comparable growth in % -1,3% -6,4% 5,7% -14,6% Operating result * 5, ,0 2,4 Operating result ** 10,1 9,0 3,5 4,8 Net result ** 6,2 5,3 2,7 2,3 Extraordinary income/expenditure -3,0 1,7-2,9 1,7 Net result 3,2 7,0-0,2 4,0 Gross margin/net turnover 39,4% 40,5% 38,9% 39,9% Operational margin ** 2,7% 2,9% 1,9% 2,7% Net margin ** 1,7% 1,7% 1,5% 1,3% WPA ( ) 0,28 0,63-0,02 0,33 * Including extraordinary income and expenditure * Excluding extraordinary income and expenditure
20 Development of Turnover and Order Portfolio Net turnover Order portfolio ( m) (year-end in m) +21% +7% H2 H * 2015 * New definition of order portfolio, hard orders (maximum 1 hear) plus forecast first 3 months.
21 Turnover Distribution by Market Sector ( M) 2015 % 2H 2015 % 2014 % 2H 2014 % 2013 % Industrial Semiconductor Medical Automotive Defence Telecom Other Total
22 Turnover Development per Quarter 31,7 28,8 32,0 31,8 33,1 32,3 YoY autonomous decrease by 1.3% 63,8 67,1 68,4 65,7 68,1 65,5 58,1 56,3 63,8 61,5 63,3 56,2 Q4 fluctuations in turnover as a result of stock adjustments made by customers 5.7% growth in HY Good development in semiconductors and automotive Q1 13 Q2 13 Q3 13 Q4 13 Q1 14 Q2 14 Q3 14 Q4 14 Q1 15 Q2 15 Q3 15 Q4 15 Neways Incl. BuS
23 Result Development Operating result* ( m) Net result* ( m) 8.4 5,8 2, ,1 5, ,9-1, ,0-2, ,4 4, ,9 H2 H ,6 0,6 3,2 1, ,2-2, ,8-1, , ,0 3,4-0,2 H2 H , 2012, 2013, 2014 and 2015 including extraordinary income and expenditure
24 Balance sheet Solvency (as at year-end, %) Increase of shareholders equity as a result of profit realised Increase in operating capital as a result of increase in inventory and receivables following deferral of orders and high turnover in December Solvency adjusted for deferred taxes and intangible assets 35.9% (year-end %) 47,4 43,5 42,6 41,5 40,
25 Operating Capital Operating capital increased as a result of both inventory and receivables Inventory high due to low turnover ratio BuS Group (~100 days) and deferral of orders to end of year Implementation of SMOI suppliers started Turnover ratio at constant good level (year-end in M) H H2014 Inventory 81,6 83,7 79,4 51 Turnover ratio in days Receivables 39,9 45,8 34,1 29,5 Turnover ratio in days Operating capital 57,7 63,7 53,5 33,6
26 Cash Flow Net cash flow ( m) Inventory increased as a result of deferral of orders by customers Receivables higher as a result of relatively strong December month Financing costs increased to 2.1 m as compared to 1.3 m in 2014, as a result of acquisition of BuS Group Investments ( 4.5 m) considerably below depreciation level ( 8.3 m) 1,9-2,9 28,4-18,5-32,5 2, H
27 Staff Average number of employees Knowledge component within human resource mix increasingly important Number of technical engineers steadily growing, app. 8% of the total number of employees Reduction of number of FTEs realised as a result of increased productivity Lower number of temporary employees in 2015 Total number of employees active in Eastern Europe and Asia app. 26% H ult ult 2015 Oost- Europa en China West- Europa * * hiring
28 Data per Share ( ) Operating result 0,52 0,60 0,26 0,24 Net result 0,28 0,63 0,19-0,04 Dividend 0,11 0,25 0,06 0,01 Shareholders' equity 6,19 6,01 5,03 4,90 Number of issued shares (x year-end)
29 OPERATIONAL
30 Up to the next level Neways DNA & Leadership programme From EMS to Life Cycle Manager ICT set-up Optimisation of procurement and supply chain Performance Operating Companies


31 Neways DNA & Leadership programme Neways DNA & Leadership model is the foundation of the Neways house Fully rolled out in the Netherlands and Germany Sustainability of the DNA programme started Preparation of roll-out for Slovakia and China HY Roll-out for Slovakia and China 2017

32 From EMS to Life Cycle Manager Focus made between Sales & Account Management Training sales & management started in 2015, account management will start in 2016 Customer Intimacy strategy rolled out in the Group Processes between development and production further aligned
33 ICT Set-up IT management reinforced Infor LN to go live Q2 KA 2.0 rolled out in Netherlands Traceability implemented in China Current structure mapped (Neways/BuS)
34 Optimisation of Procurement and Supply Chain Category management introduced Supplier reduction programme started in two categories VMI with suppliers operational Review of logistics model started

35 Performance Operating Companies Continuous improvement by POENK Roll-out of Infor LN as the foundation under standardisation of processes NCWS NME

36 OUTLOOK AND CONCLUSION
37 Basic Principles and Concerns for 2016 Further roll-out of DNA Leadership model to increase customer intimacy across the organisation Margin improvement by applying process innovation, productivity actions and expansion of production in Eastern Europa/China Inventory reduction/decrease in balance sheet total by implementing logistics model Roll-out of new Infor/Baan ERP LN System Integration of BuS Group in the Neways organisation, including the synergy advantages to be obtained Expansion of direct supplies from production facilities n China to OEMs in the region and expansion of (central) procurement materials in Asia Implementation of reorganisation NME and NCWS Continued attention to cash flow management
38 Outlook for 2016 Order portfolio increased in Q satisfactory start More stable basis with more balanced spread to market sectors as a result of acquisition of BuS Group NME and NCWS on schedule Sound financial position offering room for investments aimed at growth Neways is looking forward to 2016 with confidence
39
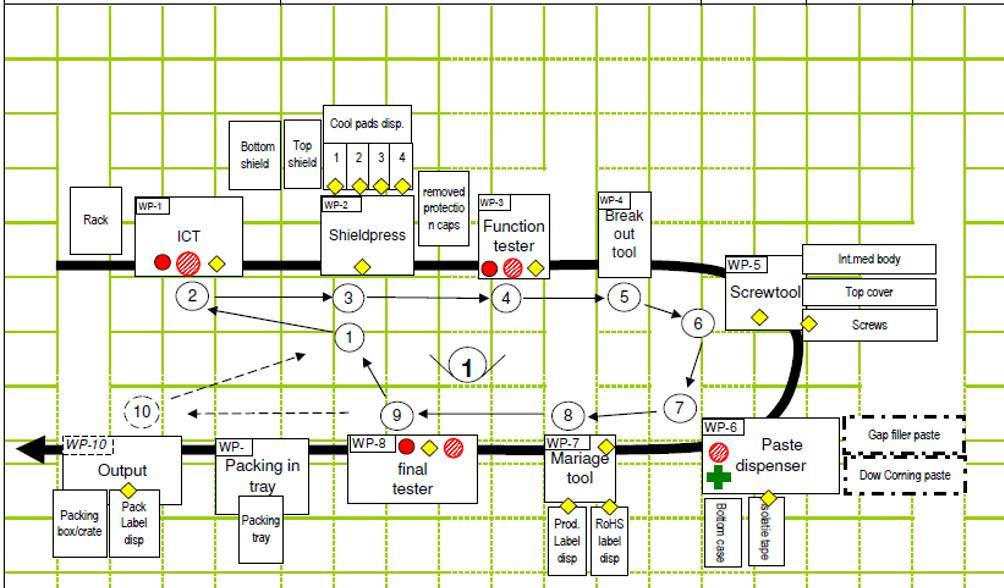

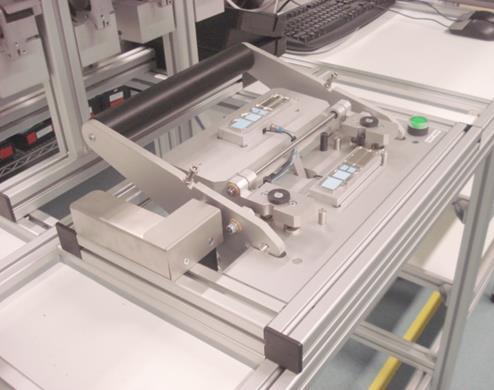
40 Low Cost Intelligent Automation (LCIA)

41

42

43 Thank you