Florida s Approach to Maximizing Advances in Data and Technology for Performance Management
|
|
|
- Drusilla Heath
- 5 years ago
- Views:
Transcription


1 Florida s Approach to Maximizing Advances in Data and Technology for Performance Management June 2, 2015
2 Topics 1. Florida s MPM Program 2. Data needs and sources 3. Use of measured data vs modeled 4. Mobility Performance Measures System 5. Plans for next year 2
3 Topics 1. Florida s MPM Program 2. Data needs and sources 3. Use of measured data vs modeled 4. Mobility Performance Measures System 5. Plans for next year 3
4 4
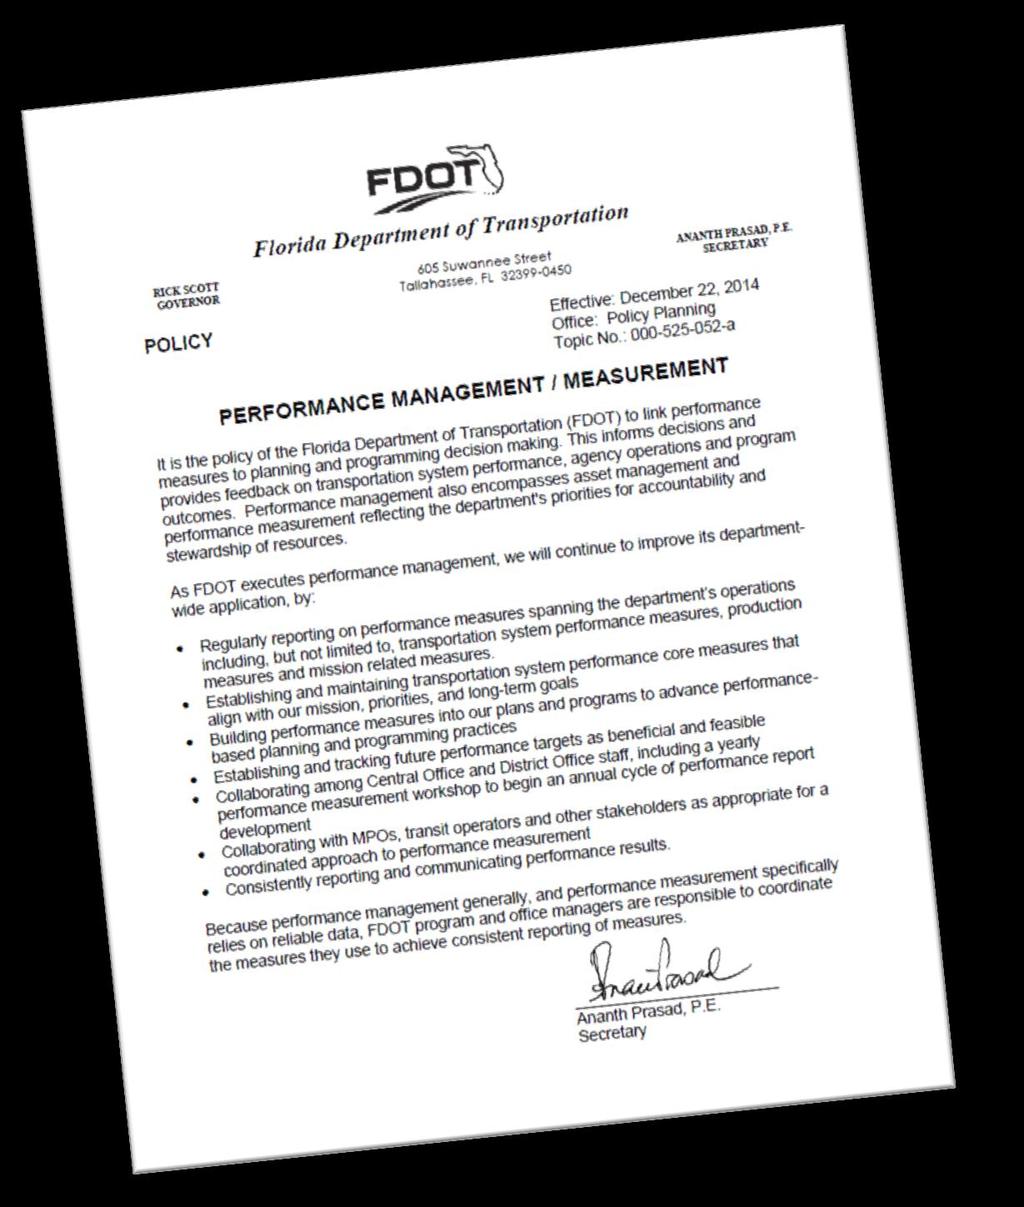
5 FDOT Performance Measures Policy Effective Dec 22, 2014 It is the policy of FDOT to link performance measures to planning and programming decision making. Offices required to coordinate for consistent reporting Actions Regularly report Establish and track targets Collaborate with MPOs 5


6 Features of Florida s Statewide Mobility Performance Measures People and Freight All major modes For FDOT purposes, and MAP-21 6
 to State and MPO")
7 MPM Program Plan Goals Develop and improve measures and reporting techniques Report on mobility measures for MAP 21 and statewide reporting purposes Provide guidance on mobility performance measures (MPMs) to State and MPO stakeholders
8 MPM Program GOALS OBJECTIVES STRATEGIES I. Develop and improve measures and reporting techniques Develop and update measures, analytic and reporting techniques for measures in every mode (freight, auto, transit, pedestrian, bicycle) regularly Conduct research related to data, analytic techniques and reporting Implement national research at the state level Create and maintain definitions of terms II. Report on mobility measures for MAP 21 and statewide reporting purposes III. Provide guidance on mobility performance measures (MPMs) to State and MPO stakeholders To report on a larger set of measures at the statewide level and meet all requirements for MAP 21 reporting. Educate, collaborate, and communicate the outcomes and activities of the MPM program to all stakeholders Stakeholders include modal, planning, operations, PD&E and ITS offices within Central Office and districts, management at FDOT and MPOs Produce Multimodal Performance Measures Source Book annually Maintain measure definitions Maintain data and analytic technique documentation Report on MAP 21 measures as requested Conduct consistent outreach Develop and administer technical guidance for Florida s MPM Develop and administer training
9 Mobility Performance Measures Reporting 9
10

11 Statewide Mobility Performance Measures Team Purpose To provide guidance and support to FDOT and the state s MPOs on multimodal mobility performance measures including reporting for internal and MAP-21 purposes Consensus on approach and measures

12 MPM Consensus Document Recommended mobility performance measures People Freight Roles of Central Office, Districts, and MPOs Definitions 12
13 FDOT Central Office Roles Central Office Coordinate statewide efforts on MPM Program Produce and report on statewide MAP-21 measures District Office Produce annual TranStat Source Book Provide additional MPMs Lead development of targets and support MPOs MPO Develop and provide training in 2015


14 FDOT District Offices Roles Central Office District Office Provide input to Central Office on MPM program Implement FDOT projects/programs to implement Federal and State goals/objectives and document activities Develop own MPMs within districts, if appropriate Coordinate with MPOs and Regional MPOs MPO Provide MAP-21 mobility performance measure analyses developed by the Central Office Provide technical support Provide advice on setting goals and objectives


15 MPOs Roles Central Office District Office MPO Comply with MAP-21 Use calculated results provided by FDOT, if desired Report to FHWA/FDOT as required Develop performance targets Include in LRTPs and Congestion Management Plans to evaluate alternatives, programming/prioritization of projects Develop own MPMs, if appropriate Coordination with other MPOs, if appropriate


16 MAP-21 Timing U.S. DOT by April 2014, in consultation with State DOTs, MPOs, and other stakeholders, will promulgate rulemaking that establishes measures Now June 2015 Possibly September

17 FDOT s Intent FDOT will provide an analysis of all required MAP-21 mobility performance measures Comparable measurements for road networks For the state as a whole not by Districts MAP-21 networks State Highway System Each MPO has the option to use or not Areawide groupings Urbanized boundaries Planning boundaries County boundaries Regional boundaries
18 Topics 1. Florida s MPM Program 2. Data needs and sources 3. Use of measured data vs modeled 4. Mobility Performance Measures System 5. Plans for next year 18
19 Primary Data Needs Delay Measure Vehicle Hours of Delay Coverage State Highway System Traffic Volume Inputs Travel Time/Speed FDOT Planning Traffic Source Models Database Traffic Roadway Travel Time Reliability/Variability % of Travel >45 mph on Freeways (Reliability) 95 th Percentile Travel Time Index (Variability) Limited Access Facilities Travel Time/Speed Models Traffic, Roadway Reports Source Book MAP-21 Annual Performance Report Source Book MAP-21 Annual Performance Report 19
20 Mobility Data Challenges and Opportunities Primary data needs = roadway characteristics, traffic volume, speed Transitioning from modeled to measured data Travel time, speed, and volume data can be collected automatically by roadside or probe devices Past methodology based on theoretical models and assumptions 20
21 Possible Data Sources Evaluated Possible field measured data sources Video Image Detection Microwave Radar Bluetooth Toll Tag Readers GPS vehicle probe data from private vendors HERE/NPMRDS INRIX TomTom 21
22 Data Source Criteria Data Coverage Need State Highway System Data completeness At lease 30% complete Data reported by individual TMC at 5 minute intervals throughout the entire calendar year Delivered in tabular and GIS shapefile Mean travel time and speed Status flag to indicate normal operations, periods of low traffic flow, inoperable status or unavailable data, etc. 22
23 Data Source Criteria, cont. Quality indicator that reflects the confidence in the estimate of mean travel time and speed Network conflation/data integration Connect field measured speed/travel time data to other data sources Separate speed for passenger cars, trucks, and all vehicles 23
24 Chosen Option Archive of HERE ITS real time data + NPMRDS Minimum additional cost to Department HERE ITS data NPMRDS data for Truck data on NHS Verifying HERE s data processing and imputation algorithms 24
25 Major Drawbacks Not every road of SHS has corresponding TMC TMC network not geographically aligned with FDOT base map Higher initial cost Different results from modeled data will result in differences when analyzing trends 25

26 Data Coverage SHS - 12,086 centerline HERE ITS 24,874 TMCs 228,430 links Data gaps over time filled by vender No separate truck speed Missing State roads are mostly in Northern FL, panhandle area 26

27 NPMRDS NHS centerline 11,733 TMCs Raw data Separate truck speed Data Coverage 27
28 Approach for Missing Data Factored-up method: route travel time = sum of travel times from available samples X ratio of route length divided by length of TMCs with data Travel times from previous and next timestamps Travel times from neighboring TMC links Historical averages, free-flow speeds, or speed limits, will also be considered For state roads not covered in HERE: Develop speed estimation model/default speeds from measured data of similar facilities by area type, facility type, volume, time of day, etc. 28

 Traffic")
29 Conflation Field measured speed data from private vendor 5 minutes average travel time Separate car and truck data Reported on TMC network GIS map conflation to connect to other FDOT data Roadway characteristics (RCI) Traffic characteristics (TCI)
30 Continuing Challenges Access to archived data Go directly to the source Stakeholder doubt in results Consider applying factors Be prepared for changing maps and coverage Plan ahead and set standards Details, Details, Details Know when good enough is good enough 30
31 Topics 1. Florida s MPM Program 2. Data needs and sources 3. Use of measured data vs modeled 4. Mobility Performance Measures System 5. Plans for next year 31
32 32
33 Mobility Performance Monitoring System Automated data collection process from various sources in FDOT Storage capability to store and maintain large amounts of data Processing capabilities that will provide data quality checks, perform needed calculations and provide capabilities to access and manipulate data from the different sources 33
34 Mobility Performance Monitoring System Query and reporting capabilities that will provide information in formats required by the Source Book and other customized formats A maintenance process to maintain the software, hardware and links to data sources 34
35 Topics 1. Florida s MPM Program 2. Data needs and sources 3. Use of measured data vs modeled 4. Mobility Performance Measures System 5. Plans for next year 35


36 MPM Source Book New Content 36
37 37
38 38

39 Mobility Performance Measures System 39

40 MPM Website 40