Welcome. Facilities. Public Meeting. Restroom Cafe
|
|
|
- Shanon Tucker
- 5 years ago
- Views:
Transcription


1

2 DECEMBER 19, 2018
3 Welcome 3 Facilities Restroom Cafe Public Meeting Noticed as Public Meeting due to ESC member participation Materials available on Florida PALM web site for public Recording meeting for note taking purposes Producing official meeting minutes for publication on Florida PALM web site


4 Introductions 4 Angie Robertson BPS Track Manager Bill Kilmartin Business Value Architect Matt Cole BPS Track Manager Mike Tramantana Reporting Lead Workshop Participants Project Team Participants Angie Robertson Bill Kilmartin Matt Cole Mike Tramantana
5 Agenda 5 Context Brainstorming: Rose/Bud/Thorn Trends and Design Principles Leading Practices Break Breakout and Group Discussion Next Steps

6 Florida PALM Timeline 6 We are here
7 Florida PALM Timeline 7 Two Phases DDI Phase 1 and DDI Phase 2 with six distinct periods: DDI Phase 1, Pilot Establish statewide solution and foundation for Departmental functionality to replace core FLAIR and CMS functionality for Pilot agencies DDI Phase 1, Agency Solution Confirmation Focus on agency readiness, reviewing the Solution as implemented in Pilot to demonstrate how Agencies will conduct business in the Solution and identify any remaining gaps DDI Phase 1, Wave 1 Extend proven solution to additional Agency users, approx. ½ of end user base DDI Phase 1, Wave 2 Extend proven solution to remaining Agency users DDI Phase 1, Wave 3 Deploy Payroll functionality to all Agencies DDI Phase 2 Deploy additional functionality

8 Solution Analysis and Design 8 We are here Design drafted through activities primarily performed by Project Team members, supported by Division SMEs, and leveraging Prototype 1 Design refined though Workgroup meetings with a small group of agencies, Project Team members, and Division SMEs leveraging Prototype 1 Design refined through Workshops with and feedback from all agencies * During Pilot period only Design finalized through presentation to and feedback from the ESC Finalized design communicated to all agencies through Business Process Workshops
9 Definitions 9 During this workshop, we will use these terms in the following context: Master Data: the single source of basic business data used across multiple applications and processes (e.g., master vendor file, master customer file, chart of accounts). Transactional Data: reflection of a business event in the accounting system (e.g., amount paid, warrant number, amount received, journal entry). Information Strategy: the business and technology approach defining how financial data and information aligns to the State s overall priorities and goals.
10 Definitions 10 Reporting: the business process to get data and information from the financial management system, enabled by technology. Reports: output of the system into a document (usually spreadsheet format); often pushed to end users, also could be pulled by end users. Queries: provision of data, per a user request, from a database; queries can be standard and ad-hoc. Business Intelligence: advanced technology application used to enable reporting; can produce both reports and queries from the database. Analytics: additional technology applications focused on discovery, interpretation, and communication of patterns in data and applying those patterns towards business purposes.
11 Agenda 11 Context Brainstorming: Rose/Bud/Thorn Trends and Design Principles Leading Practices Break Breakout and Group Discussion Next Steps
 Buds (Blue Post-it): What is currently working OK, but could use some improvement or additional work?")

12 12 Brainstorming Activity: Rose, Bud, Thorn In this activity, we will think about current reporting processes in terms of: Roses (Green Post-it): What is currently working well, and you would not want to change? (e.g., functionality, process, other items) Buds (Blue Post-it): What is currently working OK, but could use some improvement or additional work? Thorns (Pink Post-it): What are pain points that make it very difficult to do your job and/or reducing productivity and efficiency? Activity Instructions 1. Individually write down your Roses, Buds and Thorns on the Post-it 2. Each participant shares their Rose, Buds and Thorns 3. Collect and combine the Post-its into corresponding categories (Rose, Bud and Thorn) 4. Discuss the results in the full group
13 Agenda 13 Context Brainstorming: Rose/Bud/Thorn Trends and Design Principles Leading Practices Break Breakout and Group Discussion Next Steps

14 Trends: Driving Business Value Shift from collecting data and hoping it gets used to assigning value to information and prioritizing its distribution The key is that data and analytics must drive modern business operations, not just reflect them SOURCE: GARTNER, 2016

15 Trends: The Evolving Environment 15 User-Led Design Data Explosion Need for Speed Business Outcomes Changing Org Culture Demonstrate accountability Support operations As a Service Disruptive Innovation AI & ML
16 Trends: Analytics Powered Organization 16 MEASURE WHAT MATTERS DEVELOP A RESPONSIVE OPERATING MODEL HARNESS THE POWER OF NEW TECHNOLOGY OPTIMIZE DECISION PROCESSES DEVELOP AN ANALYTICS CULTURE Align action with strategy Define how analytics is governed Provide fast and meaningful insights Embed analytics into processes Use analytics to drive decisions
17 Enterprise Resource Planning and relationships to other information strategies 17 Enterprise Information Management Enterprise Performance Management Enterprise Resource Planning Enterprise Information Management (EIM): Enterprise strategies of shared data including financial, performance, and service delivery to customers Enterprise Performance Management (EPM): Data on goals, objectives, metrics, and measures (outputs and outcomes) Enterprise Resource Planning (ERP): Financial and statistical data
18 Information Maturity Analytics Maturity Model 18 What might happen? What is happening? Why is it happening? Basic Analysis Cross- Process and Functional Analysis Predictive Analysis Strategic Analysis Data & Basic Reporting Consolidated Reporting Operational Reporting Increasing Business Value
19 Design Principles 19 Engage users to define use cases Engage users to ensure tools and reports meet their needs, and do not just replicate current reports Define the criteria for ranking and prioritizing use cases Identify the right individuals to: Specify the level of detailed data to capture Determine the distribution mechanism (e.g., standard vs. ad-hoc)
20 Design Principles 20 Use as much out-of-the-box functionality as possible PeopleSoft Reporting (Transactional) Provides pre-built tools Facilitates daily business transactions Enables real-time reporting to support operational decision-making Produces static reports in standard formats Provides straight-forward aggregation and calculations Provides data elements and structure which can be basis for OBIEE/OBIA reporting OBIEE/OBIA Reporting (Business Intelligence) Add-on software to ERP capability/data structure Shows aggregated business trends over time Provides interactive reports to support analytical decision making Facilitates investigative and detailed ad-hoc reporting Supports different presentation formats; allows users to move from summarized views to more detailed views/drill downs via guided navigation Performs complex calculations and data aggregation
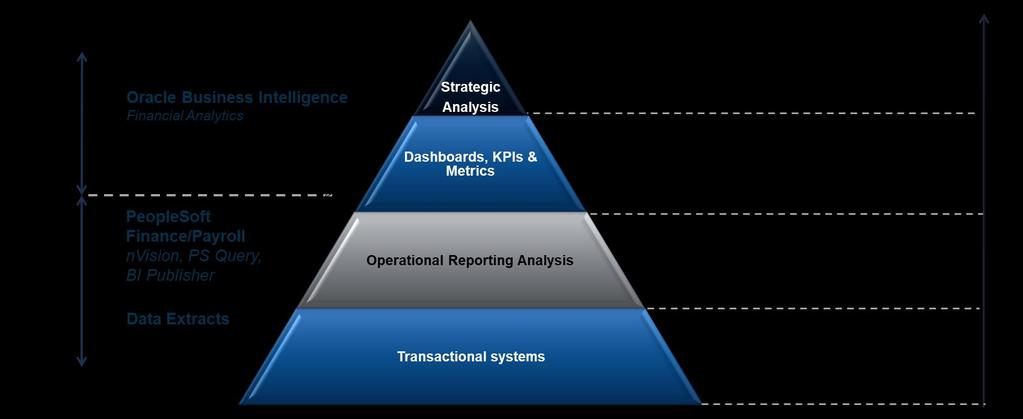
21 Proven Functionality 21
22 Design Principles 22 Provide users with appropriate technology access and security Allow employees to access data, reports and queries appropriate to their roles (i.e., report security, data-level security)
23 Design Principles 23 Support reporting within the financial management system and interfaces with external reporting solutions Provide reporting to support accounting, A/P, A/R, cash, etc. Determine the frequency and granularity of data Define the extract/transform/load process for external systems (e.g., public transparency website, FFMIS systems, agency business systems)
24 Design Principles 24 Support agency business operations Address programmatic requirements Adhere to statutory requirements
25 Agenda 25 Context Brainstorming: Rose/Bud/Thorn Trends and Design Principles Leading Practices Break Breakout and Group Discussion Next Steps
26 Leading Practices 26 Establish a well-defined governance and management model Include representatives from agencies and from finance, procurement, budget, HR/payroll, and IT Define the authoritative data source (i.e., system of record ) Define the report and data owners Manage authoritative reports and standard queries, and periodically review for decommission Enable ad-hoc reports and queries Provide clear definitions for consistent understanding (e.g., cash basis vs. accrual basis)
27 Leading Practices 27 When defining reporting policies, balance access with security Define security policies and guidelines Define a policy for exporting data Define a policy for non-state employees (i.e., public and media access) Define a policy to address how and what data is protected (e.g., legally protected, personal information) Define a policy for reports that are attested to as authoritative versus reports that are not


28 Leading Practices 28 Enable self-service Move from data gathering to data analyzing Make regular reporting easily accessible through various forms and channels Standard reports and queries, ad-hoc reports and queries, dashboards Enable ad-hoc reporting and queries that do not require a technical skillset Use intuitive data relationships and parameter-driven business rules From this: To this: What is my department s prompt payment compliance?
29 Leading Practices 29 Develop the high touch aspects to accompany the high tech Encourage employees to use reporting and business intelligence in their daily activities Encourage managers and executives to interact with the data to facilitate fact-based decision making (e.g., KPIs and scorecards) Create a shared learning and continuous improvement program about data and developing skills through training for all categories of users Community of Practice Center of Excellence Shared Services Organization
30 Leading Practices 30 Manage master and transactional data to ensure data quality Review chart of accounts values (e.g., sub-object codes) for relevance and redundancy Maintain up-to-date master customer and payee files Pre-empt inaccuracies related to manual data entry Limit free-text fields to where they are truly required Automate data entry where possible and integrate details from the single source of truth
31 Leading Practices 31 Evaluate emerging technological capabilities and supplement current tools Monitor the fast changing market for new reporting technologies Eliminate redundant reporting solutions Maintain a parking lot of use cases for future consideration when current technology cannot deliver
32 Break 32 Let s take a 15 minute break
33 Agenda 33 Context Brainstorming: Rose/Bud/Thorn Trends and Design Principles Leading Practices Break Breakout and Group Discussion Next Steps
34 Breakout and Group Discussion 34 We will divide up into 3 groups Each group will receive a poster board with a subset of the leading practices we reviewed in the prior section Based on the group s discussion, you will have 2 tasks: 1. Identify which current pain points (e.g., thorns ), or other value the State will realize by adopting this leading practice 2. Identify obstacles that might keep the State from fully adopting this leading practice Be as specific as possible! After 15 minutes, groups will rotate (there will be 3 rotations) Then, we will reconvene and report back to the full group
35 Breakout and Group Discussion 35 Green Post-it = Identify which current pain points (e.g., thorns ), or other value the State will realize by adopting this leading practice Pink Post-it = Identify obstacles that might keep the State from fully adopting this leading practice
36 Agenda 36 Context Brainstorming: Rose/Bud/Thorn Trends and Design Principles Leading Practices Break Breakout and Group Discussion Next Steps
37 Exit Ticket: Leading Practice Ranking 37 Before you leave please complete this ranking form On a scale of 1-5, rank each leading practice according to the following dimensions: Degree of value the State would realize if the leading practice were fully adopted (5 = highest value) Degree of effort for the State to fully adopt this leading practice (5 = highest effort)
38 Solution Analysis and Design 38 We are here Design drafted through activities primarily performed by Project Team members, supported by Division SMEs, and leveraging Prototype 1 Design refined though Workgroup meetings with a small group of agencies, Project Team members, and Division SMEs leveraging Prototype 1 Design refined through Workshops with and feedback from all agencies * During Pilot period only Design finalized through presentation to and feedback from the ESC Finalized design communicated to all agencies through Business Process Workshops
39 CONTACT US PROJECT WEBSITE