Mining, Metals & Materials: Shaping Your Journey to Operational Intelligence REGIONAL SEMINARS 2015
|
|
|
- Augusta Berry
- 5 years ago
- Views:
Transcription

1 Mining, Metals & Materials: Shaping Your Journey to Operational Intelligence Presented by Lance Fountaine
2 Company Visions
3 The OSIsoft Vision We believe People with Data can Transform their world 3
4 Typical Mining, Metals and Materials Vision Commodity Production: Low Cost Producer Sustainability: Eliminate / Minimize Risk Value-Add Production: Products that Differentiate 4
5 An Operational Intelligence Strategy: The Marriage of our Visions
6 What Challenges / Opportunities Exist within Mining, Metals and Materials? Challenge Market Conditions Commodity Market Prices New or Improved Operations / Known Technology Competition New, Competitive Manufacturing Technologies Challenge Cost Headwinds Energy Costs Raw Materials Costs Labor Costs Logistics / Transportation Costs Aging Assets / Sustaining Capital Requirements Other Challenges Geology Decreasing Yields on Known Mine Reserves Environmental Regulations / Reporting Requirements Slow Global Economic Recovery Opportunities Commodity Market Growth in Developing Countries Market Pull for New Materials / Alloys (Strength, Weight) Sustainable Materials 6
7 What If Your Company had the Ability to Leverage Its Current Data Assets to Improve Enterprise Visibility and Management (Operating System) Establish and Automatically Report Standard KPIs to Measure Performance Support Operations through Global and Regional CoEs (Centers of Excellence) or Remote Operation Centers Drive Real-time Action in Support of Operational Excellence Rapidly Identify and Leverage Best Practices Increase Employee Engagement with Continuous Improvement Innovation Improve Awareness and Forecasted Impact of Uncontrollable Factors Rising Energy Rates Rising Raw Material Costs, Reduced Raw Material Quality Rising Water Rates Rising Labor Rates Cost of Environmental Regulation / Mandates More Directly Impact Controllable Costs / Performance Continuously Improve Process Productivity / OEE Better Control Product Quality / Improve Genealogy Tracking Extend Life of Critical Assets / Reduce Maintenance Costs Reduce Energy / Raw Material / Natural Resource Consumption Continuously Improved Environmental Performance to Meet Regulatory Compliance and Reporting Requirements 7

8 Why the Need to Re-Evaluate Your Information Platform? The Data Capability and Maturity Model 8
9 Data to Value: Recognizing the Critical Contributors People Resources Tools / Applications Data Infrastructure Network Connectivity Sensors / Data Sources Subject Matter Experts (SMEs) Centers of Excellence (CoEs) Visualization Tools Application Systems Data Collection / Historization Ethernet TCPIP / Proprietary Wired / Wifi / Cellular IoT / IIoT Transactional Databases Innovators (Enabled Workforce) Change Agents Analytical Tools (Big Data) Reporting Tools Data Contextualization / Enterprise Normalization Calculations / Rollup / Aggregation Calibration VALUE 9
10 Information and the Operational Intelligence Concept Operational Intelligence Concepts Hidden information, problems Data in many locations & not easily accessible Multiple versions of the truth Traditional Operating Processes Common platform & tools Real-time data transparent, available to all Standardized Data Model Proactive problems solving to reduce Excursions Process modeling & improvements Customer connections Operational Excellence in the 21 st Century 10
11 How Does Operational Intelligence Drive Results? Daily/Real-Time Operations Intelligent Action Frequency: Real-time to Daily Process Stability/Improvement Intelligent Analysis Frequency: Any Learnings Applied: Manual or Closed Loop Production and Operations Management Intelligent Reporting / Integration Frequency: Daily to Monthly Visual Information / Notification Audience: Operators Craftsmen Supervisors Objectives: Achieve Daily Targets (DMS) Situational Awareness Resolve Immediate Issues (RCA/Problem Resolution) Maintain Schedule/Plan Learning / Knowledge Expansion Audience: Process Engineers (Location) Production Superintendents CoE Experts (Regional/Global) Objectives: Detect Excursions (Leading) Maintain Process Stability Improve Productivity Improve Quality OSIsoft PI Data Infrastructure Evaluation / Decision Support Audience: Location Managers Regional/Global Operations Business Leadership Objectives: Understand/Grade Performance Adjust Expectations Establish Plans Calculate Forecasts 11
12 21st Century Operational Excellence: Leveraging Information as a Key Enabler Common Operations Programs SPC (Statistical Process Control) Lean Manufacturing / Six Sigma TPS (Toyota Production System) Continuous Improvement / Deming Cycle Improving Plant / Enterprise Performance Management Established / Managed KPIs Visibility into Uncontrollable Impacts (e.g., Energy Rate, Raw Material Rate, Metal Prices, etc.) Engaged Workforce driving Collective Innovation Enabling Platform for Process CoEs (Centers of Excellence) Leverage / Adoption of Best Practice 13
13 Meeting the Technical Requirements: Recognizing IT / OT Convergence

14 Recognizing IT/OT Convergence 15
15 Defining a Standard Technical Architecture Transactions Business Action Operations A N A L Y S I S I N T E G R A T E D Environment Health & Safety Operational Intelligence Operations / Production Management Process Data Collection & Storage Environment Processes Assets ERP PCS Orders & Purchasing Production Processes D A T A M O D E L Definition: The integration of data with process expertise to enable proactive and intelligent manufacturing decisions in dynamic environments Key Components: 1. REAL TIME and HISTORICAL process data capabilities 2. Network / Data integration from shop floor to the enterprise 3. Comprehensive analysis toolset(s) The Architecture Ties Together Information from All Sources within a Plant and Across the Enterprise
16 Adopting a Project or Program Approach
 Fixed Project Timeline Working Group: Location Operations Resources working with IT")
: Site Based, One Off Solutions Not Easy to Leverage / Deploy Best Practices or Standards across Multiple Sites New Projects")

17 Project Based Approach Project #1 Project Scope Technology - Solution Design Technology - Solution Deploy Typical Scenario: Limited Technical Scope (Sources of Information / Tags) Fixed Project Timeline Working Group: Location Operations Resources working with IT / OT Resources Pros (often): Well Defined, Limited Scope Single Design / Deployment More Manageable Initial Cost Project #2 Cons (often): Site Based, One Off Solutions Not Easy to Leverage / Deploy Best Practices or Standards across Multiple Sites New Projects Require New Software / New Solutions / New Funding / New Start Cost / Complexity Increase Over Time Project Scope Technology - Solution Design Technology - Solution Deploy Project #3 Project Scope Technology - Solution Design Technology - Solution Deploy TIME 19
: Higher Initial Funding Investment (Offset by Lower ongoing TCO and Stronger")

: Supports Transformation through Continuous Improvement Program Shorter Time to Value for Defined")

18 Data Infrastructure Data Infrastructure Design Program Based Approach Data Infrastructure Deploy Value Initiative #1 Cons (often): Higher Initial Funding Investment (Offset by Lower ongoing TCO and Stronger Value Realization) Solution Design Typical Scenario: Supports Vision of Data as an Asset Initial Scope / Focus on Technical Architecture and Data Infrastructure Defined Partnership between Operations and IT /OT Solution Deploy Value Initiative #2 Solution Design Solution Deploy Value Initiative #3 Solution Design Pros (often): Supports Transformation through Continuous Improvement Program Shorter Time to Value for Defined Value Initiatives Less Investment / Funding Required for Subsequent Projects Focus on Leverage of Common Standards or Best Practices Provides Standard Approach to Technology / Minimizes Complexity Engages People Solution Deploy TIME 20

19 Value Creation The Project vs. Program Approach VALUE Performance Management Environmental Reporting Equipment Health Mgmt. Incremental Value Operations Management Application Benefits Value Realization TIME Initial Investment VALUE NOW VALUE OVER TIME
20 Examples of Success


21 Enterprise Operational Intelligence CHALLENGES SOLUTION RESULTS 23


22 Enterprise Data Access Solution CHALLENGES SOLUTION RESULTS
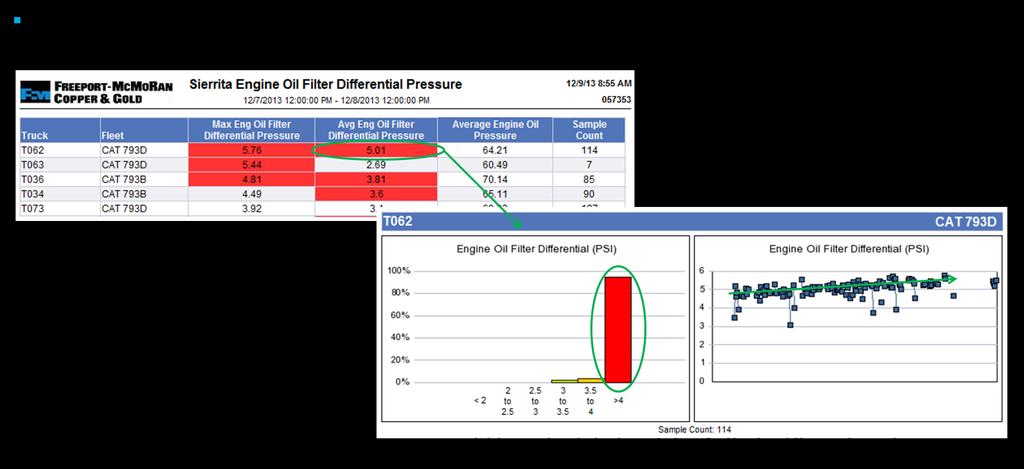
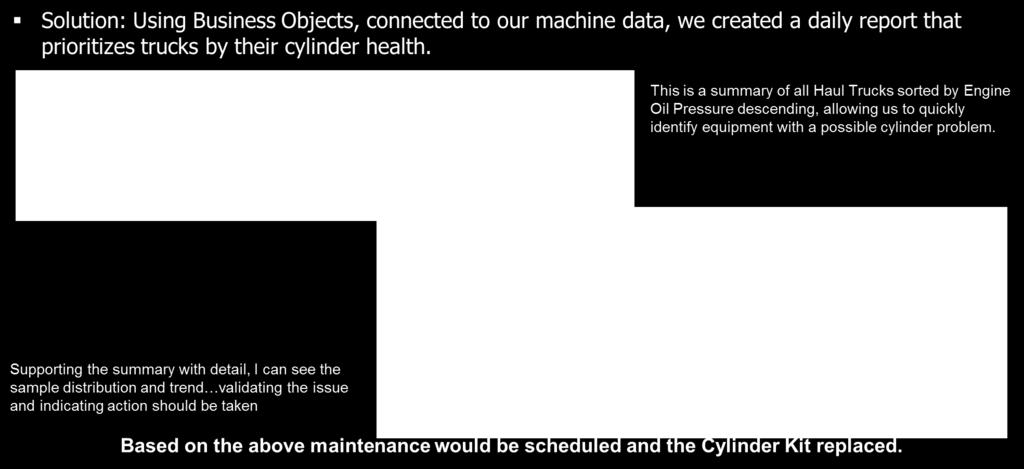
23 How Did Freeport-McMoRan Deliver a Solution? 25


24 Drive to Operational Intelligence CHALLENGES SOLUTION RESULTS 26


25 Data Supports Real-Time Decisions CHALLENGES SOLUTION RESULTS 27

26 How is CEMEX Using PI System to Impact Operational Results? 28


27 Energy Management CHALLENGES SOLUTION Implement a data-based system using PI Visibility of the power use at every level Develop high level KPIs, reporting and drill down capabilities RESULTS Enterprise visibility of all electrical consumption - resulted in a 1% reduction in electrical power use Significant time reduction for collecting the data and performing roll-ups and analysis 29


28 How is Anglo American Platinum Using PI to Monitor and Manage Energy? 30


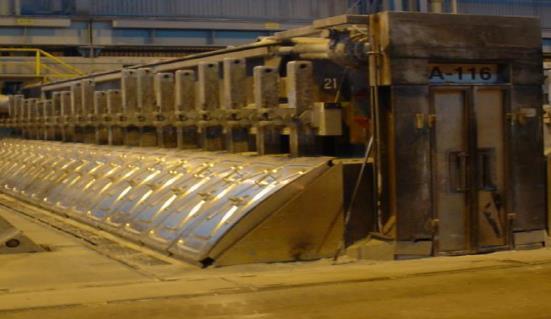
29 Improving Pot Health Analysis CHALLENGES SOLUTION RESULTS 31


30 Examples of How Alcoa is Managing to Improve Pot Health 32
31 Conclusion
32 Key Considerations for Today s Session What is your vision for the use of information within your company / division? What role does OSIsoft PI System play as an enabling technology? How can OSIsoft help you establish and execute your strategy for success? 34
33 Lance Fountaine Industry Principal, Mining, Metals and Materials OSIsoft, LLC 35


34 Questions Please wait for the microphone before asking your questions State your name & company 36
35