Operation Excellence Dashboard Text. Metrics and Processes. Carole Cornell & Aba Diakite ICANN BIPMO 25 June 2014
|
|
|
- Gabriella Lee
- 5 years ago
- Views:
Transcription


1


2 Operation Excellence Dashboard Metrics and Processes Carole Cornell & Aba Diakite ICANN BIPMO 25 June 2014


3 Agenda Fadi s vision Strategic structure Process-driven culture Business Excellence Business Intelligence Questions & Answers


4
5 Fadi s vision Run a video of Fadi (4 minutes)


6 Organizational Objectives and Goals 1.1 Deliver core internet functions $9.5M 1.2 Act as stewards of public interest $6.0M 1.3 Engage in IG ecosystem $1.4M 1.4 Deepen partnerships with I-Orgs $1.0M Total $17.9M 1 2 Affirmation of Purpose Operational Excellence 2.1 Institutionalize Mgmt. disciplines $3.5M 2.2 Mature Org. Support Functions $54.7M 2.3 Optimize R&R services $41.3M 2.4 Plan for scale, security, continuity $1.2M Total $100.7M 3 Globalization 4 Multi-Stakeholder Model Evolution 3.1 Engage stakeholders globally $15.9M 3.2 Communicate clearly & locally $2.9M 3.3 Integrate global/regional resp. $0M 3.4 Evolve gov. relationships $3.3M Total $22.1M 4.1 Optimize policy dev. Process $6.8M 4.2 Increase/improve participation $1.7M 4.3 Evolve SO/AC structures $0.8M 4.4 Promote ethics & transparency $0.4M Total $9.7M
7 Linkage Across Management Systems Strategic & Financial Planning Exec Dashboard Operating Plan 1 - Objectives Enterprise Risk Mgmt Goals Portfolios Budget / Cost Mgmt. 7 People Performance Mgmt. # - Projects Project Portfolio Mgmt. Phases Key Strategy Implementation Results


8 Culture change Moving from a high quality artisanal culture towards a scalable, professional, data & metric driven culture
9 Business Excellence Business excellence is the systematic use of quality management principles and tools in business management, with the goal of improving performance based on the principles of customer focus, stakeholder value, and process management.


10 Successes so far IANA BE 4 internal assessments built up to an external assessment Recognized for commitment to excellence Customer experience better services
11 Successes so far Operations Institutionalize Management Disciplines Mature Organization Support Functions Procurement Strategy & Plan, Cost Management Standardize Process / Controls documentation Procedural Improvements with EFQM approach Development of Multi-Level Dashboards Launch ERM, DNS & NgTLD Risk Assessments Reserve Fund Assessment


12 Plan for the future draft FY15 plan Process development Process integrity self-test EFQM self-assessment Reporting
13 Business Intelligence Business intelligence (BI) is a set of methodologies and technologies that transform raw data into meaningful and useful information for business purposes. BI as an enterprise information platform, enables the organization to align strategic and operational objectives with business activities in order to fully manage performance through better informed decision making and action.


14 From Report to Dashboard Reports are the most common form of presenting and summarizing data. Dashboards present data in a single, purpose-built and concise screen, dashboards only contain the most essential data 14

15 Dashboard - purpose Strategic, mission-critical decisions require a clear understanding of organization performance Organize and present information in an accessible way: at-a-glance visual communication relevant to objectives or business processes enhance & enable management decisions Measure performance, validate them and model how specific strategic and operational decisions are going to be executed Improve accountability, communication, visibility, and operational effectiveness & efficiency 15
16 Dashboard - purpose Strategic Board/ Communities Directional Executives/ Global Leadership Operational Staff/ Managers Dashboards to achieve multiple Purposes for multiple Audiences 16
17 Dashboard cycle and progress Make Evidence-Based Decisions Define Objectives / Goals Define KSF / KPI Objectives Goals KSFs Define Present the Information Dashboards Design Data Collection Warehousing KPIs Metrics Calculate KPI Charts Design 17
18 Dashboard Development Roadmap Jul Aug Sept Oct Nov Dec Jan Feb Mar Apr May Jun Jul Phase 1: Technical setup BI architecture and design Dashboard tool selection Review data source structure Data warehouse modeling Phase 2: Dashboard Beta version Deploy Dashboard tool Create visibility for ICANN performance Present Public Dashboard Beta testing of dashboard tool Standardize format Phase 3: Cascading KPIs Review and validate KPIs Public interactive work session Staff Training and workshops Review KPIs grouping and cascading Phase 4: Web based Dashboard Release multilevel Dashboard Distribute Multilevel Dashboard Expand KPI list and visualization Standardize data format and gathering process KPI data collection and KPI charts review Communication and Improvement ICANN 51 Los Angeles, USA ICANN 52 AF (Tentative) ICANN 53 LAC (Tentative) 18
19 Dashboard development process framework 4 Organizational Objectives led by CEO/Board 16 Organizational Goals led by Global Leaders o 1 to 2 KSF per Goal o 1 to 2 KPI per Goal 52 Portfolios led by Executives/Managers o 1 to 2 KSF per Goal o 1 to 2 KPI per Goal 19
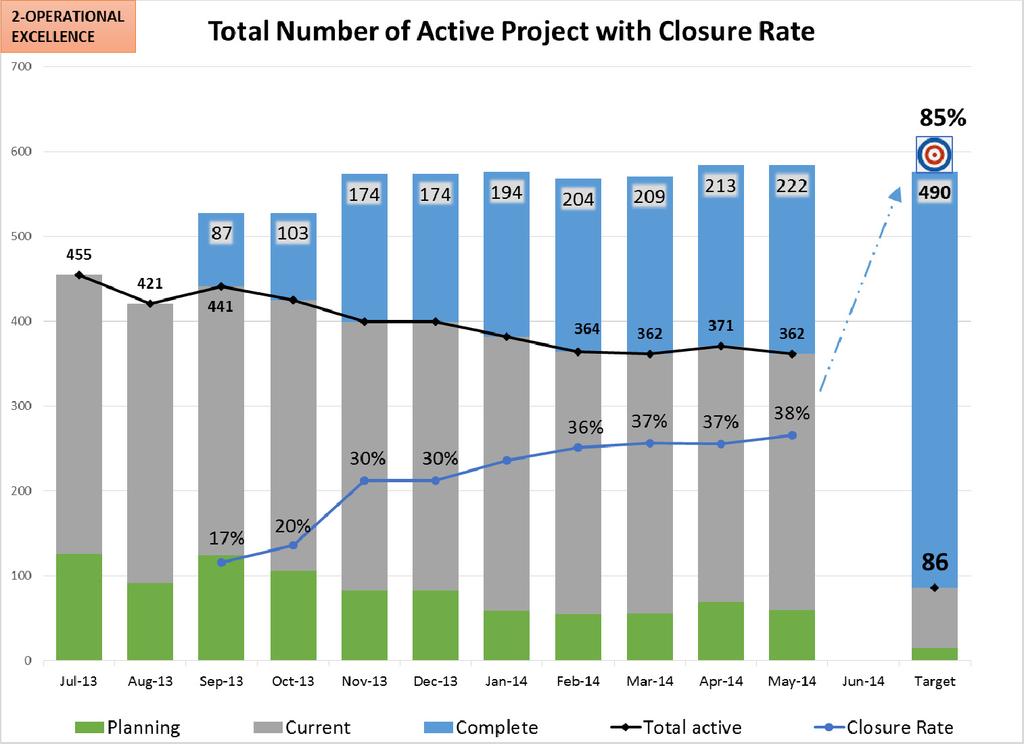
20 20

21 21

22 22
23 23
24 24

25 25


26 Discussion Intelligence Questions Excellence Operations & Answers Management