Investor Presentation Q2 2019
|
|
|
- Benedict Hudson
- 5 years ago
- Views:
Transcription

1 Investor Presentation Q2 2019

2 Looking Forward Statements The statements in this presentation relating to matters that are not historical fact are forward looking statements that are based on management's beliefs and assumptions. Such statements are not guarantees of future performance, and are subject to a number of uncertainties, including but not limited to future economic conditions, the markets that TECSYS Inc. serves, the actions of competitors, major new technological trends and other factors beyond the control of TECSYS Inc., which could cause actual results to differ materially from such statements. All names, trademarks, products and services mentioned are registered or unregistered trademarks of their respective owners. 2
3 End-to-end, Integrated Supply Chain Management Solutions SUPPLIERS PARTNERS CUSTOMERS ENTERPRISE SYSTEMS Collaboration Demand Planning Procurement & Inventory Warehouse Transportation Sales Order to Cash Point of Use Financial Management 3 RD Party Billing ANALYTICS E X E C U T E A D A P T S C A L E E X P A N D 3

4 Healthcare 50% of new acct bookings 44% of total revenue ( 600+ customers sites 50,000+ users ( Complex Distribution 50% of new acct bookings 56% of total revenue Visionary Provider of SCM Technology Heavy Equipment Dealers Health Systems Top 3PL Providers Wine and Spirits 4
, Warehousing Education and Research Council (WERC), American Production and Inventory")
5 Solid Sustaining Growth in Complex Distribution $1.5B Market in % SCM Growth through 2019* Source: International Warehouse Logistics Association (IWLA), Warehousing Education and Research Council (WERC), American Production and Inventory Control Society (APICS), European Logistics Association (ELA), Company Websites, Expert Interviews, White Papers, and MarketsandMarkets Analysis 5


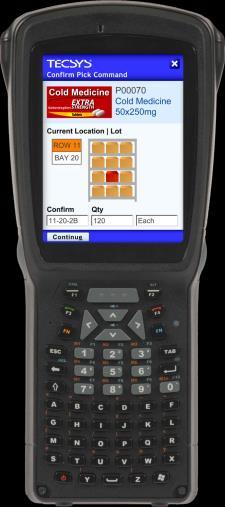


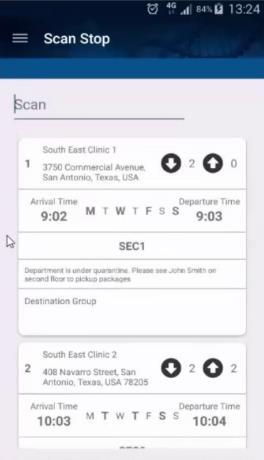

6 Visual Logistics Visual images and instructions delivered via RF Cloud-based OneSprint WMS system in the cloud for faster implementation Mobile-Enabled Delivery management designed for mobile Building Market Leadership through Innovation 6 6


7 Leveraging Technology and Expertise in a New Vertical Drivers: Regulatory Compliance Mergers & Acquisitions Affordable Care Act Healthcare SCM The next wave of sector-wide process improvement Sustaining Operating Margin 7


8 SCM Impact on Healthcare Costs 5-15% in SCM savings improves Operating Margin by 3-8% 8

9 Extending our Reach in Health Systems Health Systems Market Share Base Account Penetration 500 Target Health Systems 94% Market Opportunity: $9.6B 6% 17% Opportunity with Current Base: $610M+ 38% of Total Bookings 83% Market Opportunity Current Share Market Opportunity 9


10 TECSYS and UNC 12 Hospitals 249 Operating Rooms 2,675 Staffed Beds 56 Clinics 9.5 Billion in Patient Revenue Signed a LOI to merge with Carolinas HealthCare System; the combined entities operate 3.5 Billion in Total Revenue over 50 hospitals 10


11 Why We Win TECSYS brings to the table a very important flexibility it allows us schedule and allocate resources more efficiently. We anticipate between $8 and $13 million in savings. One of the top 5 U.S. health systems 45 acute care and specialty hospitals 700 physician practices and outpatient facilities TECSYS visibility gives us optimal performance at the six-sigma level with less than 5% obsolescence in our supply chain. With the deployment of TECSYS SMS we have been able to capture $14 to $16 million in revenue per year. Not-for-profit community-based health system 9 hospitals, 10,000 employees 11
12 Steady Revenue Growth In $CAD Millions $80.0 $70.0 $60.0 Total Revenue Recurring Revenue* Recurring revenue % $57.3 $67.5 $68.4 $ % 90.0% 80.0% Growth Drivers Cloud, Maint. and Sub. Revenue (4-year CAGR 12%) Healthcare revenue (4-year CAGR 27%) $50.0 $ % $40.0 $30.0 $20.0 $17.1 $19.3 $23.3 $26.3 $ % 50.0% $10.0 $ % 36.8% 38.2% 33.7% 34.5% % 30.0% * Refer to 2018 annual report MD&A for definition of recurring revenue 12

13 Predictable Professional Services Revenue Service Revenue Includes PS, EBS and ATS Proportion of PS revenue from Base Account in the last 5 years 83%* * Base account revenue for PS divided by total PS revenue 13

14 Healthcare Revenue Growth In $CAD Millions Total Revenue 4-year CAGR 11% Healthcare Revenue 4-year CAGR 27% 14
15 Financial highlights Q2, 2019 Q2, 2018 Δ YoY Q2, 2019 TTM Q2, 2018 TTM Δ YoY $ % $ % $ % $ % $ % $ % Revenue $18, % $18, % $ % $70, % $70, % $ % Cost of sales $8, % $8, % $40 0.5% $35, % $34, % $ % Gross margin $9, % $9, % $72 0.8% $34, % $35, % ($710) -2.0% Sales & Marketing $4, % $3, % $ % $14, % $15, % ($714) -4.7% General and Administration $1, % $1, % $ % $6, % $5, % $ % Research and Development $2, % $2, % $ % $10, % $5, % $5, % Operating expenses $8, % $7, % $ % $31, % $26, % $5, % Earnings from operations $ % $1, % ($771) -48.3% $3, % $9, % ($5,728) -63.3% Net earnings $ % $1, % ($760) -56.0% $3, % $7, % ($3,956) -55.8% * EBITDA $1, % $2, % ($762) -34.9% $5, % $11, % ($5,909) -51.4% EPS (basic) $0.05 $0.10 ($0.05) -50.0% $0.24 $0.57 ($0.33) -57.9% ** Bookings $16,226 $11,453 $4, % $53,620 $47,037 $6, % ** Backlog $51,657 $42,350 $9, % $51,657 $42,350 $9, % * Refer to 2018 Annual Report MD&A Non-IFRS Performance Measure ** Refer to 2018 annual report MD&A for definition 15


 Strenghten TECSYS offering")
16 Acquisition of OrderDynamics Description Cloud-based Distributed Order Management software 50 employees Based in Richmont Hill, Ontario Key customers include: Ubisoft, Sephora, Uniqlo, Golf Town, Kmart Australia, Khiels Key Metrics Purchase Price: $13.4 M Revenue Forecast (March 31, 2019): $7M Revenue forecast growth FY19/FY18: ~30% EBITDA (March 31, 2019): ($2M) Rational of the transaction Acquisition of a complementary technology Expand omnichannel distribution capabilities for E-commerce companies that have high growth potential Leverage OD s global presence (especially in Europe and Australia) Strenghten TECSYS offering for the 3PL and retail market SaaS-based business model Leverage their growing SI partners


17 Key Strengths Focus Customization Expertise Selected markets with deep pockets Solutions to the right problem Differentiated technology providing unequalled efficiency and visibility Tailored solutions to fit clients needs perfectly Seamlessly integrated Experienced workforce Clear understanding of sector specific issues TECSYS SMART 16


18 Continued Recognition by Gartner 4 TECSYS customers in top 5 - Gartner s Top 25 Healthcare Supply Chains Visionary for 5 years consecutively The vendor offers very differentiated capabilities, domain expertise and customer experience in healthcare provider SCM, with more than 60% of its bookings now in that industry. It also is pursuing a notably unique vision for Omni-Channel concepts applied to pharmacy SCM. The core WMS requirements in these environments are not dramatically different from other industries; however, TECSYS has distinguished itself by adding specialized capabilities, such as integrating WMS upstream into hospitals for automatic replenishment. C. Dwight Klappich Research VP, Supply Chain 17

19 Near-term Growth Strategies Healthcare Additional POU solutions Expand into pharmacy Expand into home care Complex Distribution Leverage new leadership with dedicated sales team Revitalize and simplify products Base Accounts Grow revenue as a percentage of total revenue Mergers & Acquisitions Strategic tuck-in acquisitions 18

20 Tracking Our Progress 8% -12% Topline Growth Continue Growing Total Bookings Enhanced Operating Leverage 40% Target Annualized Recurring Revenue 19

21 Corporate Overview $182M Symbol 22 30% Market Cap 13.1M S/O TCS Dividend per Year Insider Ownership Beacon Securities EdgePoint Brokerage Cormark Securities Echelon Partners Institutional Fiera FTQ Coverage GMP IA Securities Holders Mawer Pembroke LB Securities Stableview 20

22 Question & Answer Thank You 21