BI: For Users, By Users. Making Sense of Data Terry Rogers
|
|
|
- Gregory Richard
- 5 years ago
- Views:
Transcription


1 BI: For Users, By Users Making Sense of Data Terry Rogers
2 Agenda Data World Problems BI Challenges Analytics Journey About SplashBI Dashboards Reports Key Differentiators SplashBI Demonstration Ease of Use Data Connectivity Flexibility Field Office / Mobile Support Recommendations
3 About the presenter Regional Sales Manager, SplashBI More than 10 years of industry experience Domain Expertise: Reporting, BI, Oracle Discoverer Cloud, ERP From Atlanta, Ga, USA
4 Abstract Making an informed decision comes down to having the right data and analyzing it effectively; in other words, business intelligence and analytics. With good business intelligence, organizations can be efficient, agile, and informed risk takers. Organizations can streamline operations, looking for any areas for cost savings. They can identify and respond to business trends quickly, whether it is for understanding customer behavior or understanding key business metrics to realize new opportunities.


5 Data World.. Resources Funding Project Scope Forecast Capital Budget Procurement Costing Management PMIS Acquisition Labor Budget to Actual Timeline Project Management Customers Construction Vendors CIP Gant ChartDeliverables Milestone Business Intelligence Reconcilliation Objectives Expenditures Reporting


6 What do these companies have in common? No cars No Content No Real Estate They are all data driven companies

7 Common BI Challenges Incomplete and often untimely data Too many data sources Lack of a reliable tool to mine and massage data Corporate employee populations in different systems Inability to use the data effectively to exact patterns and intelligence Lack of Data Governance No Mobile capabilities


8 Data Usage Executives who feel they understand the impact data will have on their organizations SOURCE
9 How do you prepare for the BI Journey? Identify the data sources Enable cross application BI Leverage SplashBI pre-built fact and dimensions models Build Visualizations Understand the BI goals/vision Integrate/Connect to Cloud application and data to a DW Build Project fact and dimensions. Complete the transactional reporting Deliver

10 How BI helps drive business insights

11 What does BI mean to YOU?


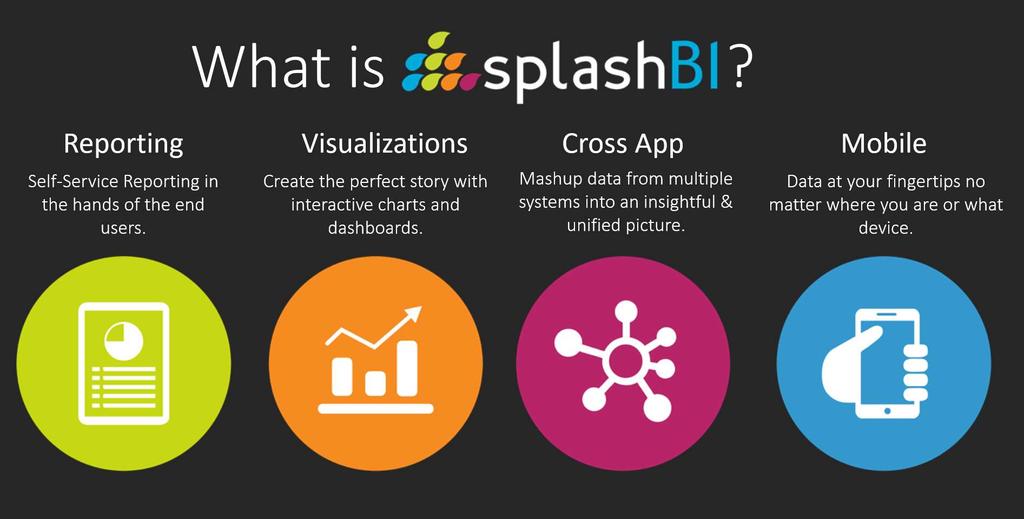
12 Tell your data story with Cross App BI
13

 Contracts Invoices Details.")


14 HR DATA WAREHOUSE Journey w/ Analytics Connector Oracle Cloud Applications Data Warehouse Projects Budgets C Level Field Officers Mid Level Managers Instructional Staff GL AP & AR CM Run Nightly Update from EBS to DW (Scheduled) Contracts Invoices Details. Real Time Reporting (Already Have) PLATFORM Get Real-Time Cloud Data Get Real-Time EBS Data Metrics & Reporting Analytics Community of Practice Scorecards Quality audits Descriptive reporting with analysis Dashboards Targeted analytics projects Business impact analysis / ROI Predictive analytics Design of experiments Artificial Intelligence Governance Best practices sharing Analytics training Leverage indirect resources and knowledge


15 On Premise Mobile On Cloud Customers Volume. Velocity. Variety.
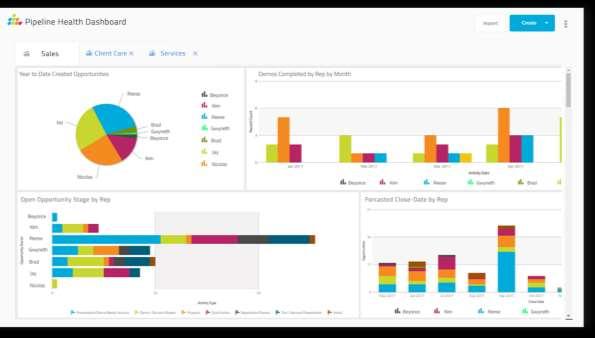
16 More than 100 types of charts and visualizations to best represent your data. Dashboards Multi tabular dashboards for better project overview Filter dashboards on the fly for more specific detail. Drilldown to additional dashboards, charts, and reports for deeper details on data points.
17 Additional Features of Dashboards Customize with your colors and logos/images Easily Configurable by the User without technical assistance More than 100 types of visualizations, including KPIs Create meaningful scorecards, project summaries, and dashboards Mashup data from multiple sources for a more complete picture Export Dashboards and Charts in PDF, PPT formats, plus distribution to s Extensive Help Menu throughout the solution
18 Reports Easy to navigate and search for reports by category or name Simple to use menus makes training simple Modern UI tailored to simplify the end user experience Expandable menu to allow report copy, edit, and more (without IT help!)
19 SplashBI Key Differentiators Easy to Use Connectors Ad-hoc reporting Drilldowns Customer s customer reporting Distribution Multi-Tenant Automation (content, tenant) OAuth2 Enabled APIs, Embed, Integrate Personalize 100+ Visualizations D3 integration Native Mobile App Excel Connect In-memory Database Scalability Multi-Node No Desktop Dependency Any Browser Pre-Built Reports & Dashboards Pixel Perfect Reporting
20 See it in action

21 Thank You!