Big Data and Analytics: Transportation Implications. Bob McQueen February 22, 2019
|
|
|
- Edwin Patterson
- 5 years ago
- Views:
Transcription

1 Big Data and Analytics: Transportation Implications Bob McQueen February 22,
2 2 Topics Transportation Big Data Analytics Data as the glue Smart data management 2

3 3 1. Transportation Spectrum of Actions Match supply and demand Explore alternatives Understand effects Develop resultsdriven investment programs Define projects Select technology Estimate cost Develop design concepts Develop detailed design Project management Project delivery Testing Commissioning Partnership management Monitor status Collect data Develop information Build intelligence Define strategies Implement strategies Develop maintenance policies Monitor device status Identify intervention points Assess device performance Plan Design Build Operate Maintain 3


4 2. Big data Exabytes User Generated Content Social Network BIG DATA User Click Stream Mobile Web Sentiment Petabytes Web Logs Offer History Dynamic Pricing A/B Testing WEB External Demographics Business Data Feeds Terabytes Gigabytes Purchase Detail Purchase Record Offer Details Segmentation ERP Payment Record CRM Customer Touches Support Contacts Affiliate Networks Search Marketing Behavioral Targeting Dynamic Funnels HD Video Speech to Text Product/ Service Logs SMS/MMS INCREASING Data Variety and Complexity DECREASING Value Density in the Data 4
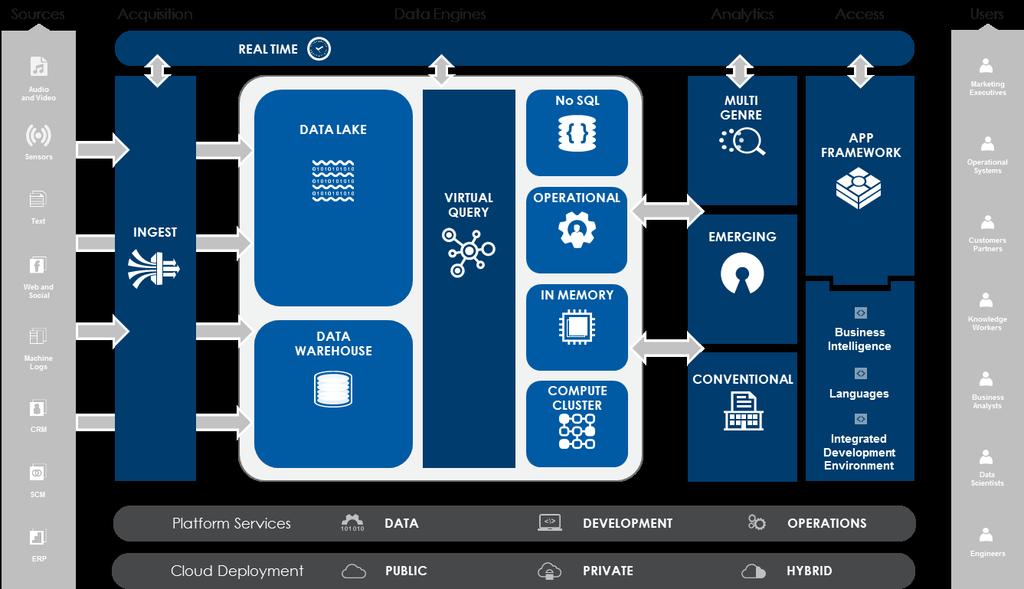
5 Big Data Type Volume Velocity Variety Variability Complexity Veracity New Analytics: graph and path analytics, and analytics on new, non-relational data types (coupled with existing relational data) Tools: uncover insights from data such as text in accident reports, or patterns in visuals, to quickly find the signal in the noise Economics: retain, do not throw away signal timings, speed, flow and occupancy data, by leveraging hot and cold data storage Architecture: hybrid ecosystem that allows both old and new tools and enables rapid discovery analytics on new data Not New Most big data use cases are variations on: Safety, Efficiency User experience Environmental questions that public service agencies have been addressing for years 5


6 How big is big data? 2013 Ford Fusion Energi Hybrid 145 actuators, 4716 signals, 74 sensors More than 70 onboard computers 25 GB of data per hour 2 ZB of data every year nationally Tidal wave of data Will we get access to it, do we need it all? 6


7 Big data in transportation Operations as a significant data generator SANDAG 1 TB per day Connected vehicle 2 ZB per annum Proportion of the data originating Planning 20% Design 10% Project delivery 5% Operations 50% Maintenance 15% Total 100% Maintenance Planning Operations Design Project delivery 7 7

8 8 3. Data Analytics gives business greater insight than ordinarily available in traditional business 3 Phases of Analytics intelligence (BI) techniques include machine learning, data mining, predictive analytics, location analytics, big data analytics, advanced visualization 8 Prescriptive Analytics Advise on possible outcomes Descriptive Analytics Insight into the past Predictive Analytics Understanding the future
9 Service Asset and maintenance management Connected vehicle Connected, involved citizens Integrated electronic payment Intelligent sensor-based infrastructure Low cost efficient, secure and resilient ICT Smart grid, roadway electrification and electric vehicle Smart land-use Strategic business models and partnering Transportation governance Transportation management 9 9 Analytics Example Asset performance index, asset maintenance standards compliance measure, optimal intervention point analytic Lane changes per mile, steering angle compared to road geometry, brake applications per mile, driving turbulence index, minutes per trip, trip time reliability index, no of stops per trip Citizens awareness levels index, citizens satisfaction levels Transit revenue per passenger, transit seat utilization, toll revenue per vehicle and per trip, premium customer identification index, parking revenue per slot, payment system revenue achieved compared to forecast and addressable market Data quality index, transportation conditions index, trip time variability index Network load compared to capacity index, network latency, cost of data transfer, network security index Electric vehicle charging points per mile, electric vehicle charging points per head of population, number of electric vehicles as a percentage of the total fleet, electric vehicle miles per day, electric vehicle miles per trip, electric vehicle miles between charges Observed trip generation rates for different land uses, observed actual trips between zones, land value transportation index, zone accessibility index Percentage of private sector investment, number of partnerships, improvement in service delivery for each private sector dollar invested Transportation efficiency for each dollar spent, supply and demand matching index, transportation agency coordination index, partnership cost-saving index, cost of data storage and manipulation compared to services provided Mobility index, citywide job accessibility index, citywide transportation efficiency index, reliability index, end-to-end time including modal interchanges index Traveler satisfaction index, decision quality information index,

10 4. Data as glue for transportation What is a system? It has clarity of purpose It is connected together We can find out its status at any given time It can adapt to changes in the environment Paraphrased from the speech by Samuel J. Palmisano, Intelligent Transportation Society of America, 2010 Annual Meeting & Conference, Houston, Texas, May 5,

11 11

12 5. Smart Data Management Crucial tool in answering questions facing TSM&O CAV Probe data DOT Tolls, Traffic, Transit, models Smart Mobility Services Transportation management Mobility as a Service Organized/accessible data will springboard private sector development of tools and services Data will be the fuel for innovation Transportation mobility cloud Private partner support Connected citizens and visitors Integrated payment Technology companies will apply knowledge & experience in managing smart city data Movement Analytics Cuebiq, Inrix Statewide Crowdsource Nontraditional (energy, credit card) 06 Smart grid and EV 12
13 Smart data management Regional Data silo Interstate Data cockpit Private Data silo Transit Data cockpit Traffic signal Data cockpit Non traditional Data cockpit Data ingestion Artificial intelligence and analytics to get from data to information to insight to action Data management Data analytics Data valuation Data exchange Analytics exchange Right data right information right time right cost Planners Designers Maintainers Operators Customers Partners Researchers Executive managers Federal Decisionmakers 13


14 Smart Data Management Not So Smart Data Management 14


15 Need for an Early Winner Data, as a raw material, is perceived to be of little or no value Low perceived data value Vicious Cycle Notion that data is too expensive to keep 02 Benefit cost calculations with respect to data retention and management are distorted 03 The opportunity to convert data to information to insight to action is lost, no value is created or understood Opportunity lost Data is discarded Data is discarded because of incorrect assumptions on the value of data and the cost of data retention and management will what 15

16 Getting What You Want from Data Difference between reporting and analytics The importance of Use Cases Getting started, developing a roadmap, defining the future vision Building bridges Between data science and transportation Between departments Between agencies and partners Using data as the glue Defining needs, issues, problems and objectives Reporting: questions predefined, focus on knowing Analytics Different questions can be defined Focus is on improving organizational performance by analytics applied to management Reporting makes you a well informed spectator, but the right analytics can make you the coach with the ability to change the performance of the team 16

17 TSM&O Use Cases Transportation Operations Use Cases 1 Traffic anomaly detection and communications 2 Towing and recovery management 3 Results driven investment 4 Asset management 5 Transportation network management 6 Transportation systems management and operation impact analysis 7 Developer fee management 8 Regionwide safety analysis 9 Regionwide speed in bottleneck analysis 10 Mobility as a service 11 Connected citizens and travelers 12 Project tracking and coordination 17
18 Towards Automation Growth in Query complexity, Workload mixture, Depth of history, Number of users, Expectations Database Requirement: Analytic foundation must handle multi-dimensional growth! Workload Complexity REPORTING Historical Performance Reporting ANALYZING Mechanisms related to transportation demand and supply PREDICTING Future Transportation Demand and Supply OPERATIONALIZING Applying insights to transportation operations ACTIVATING Automated transportation back office Batch Ad Hoc Eventbased Triggering Continuous Update/Short Queries Analytics Primarily batch and some ad hoc reports Increase in ad hoc analysis Analytical modeling grows Continuous update and timesensitive queries become important Event-based triggering takes hold Data Sophistication Single View of Transportation Better, Faster Decisions Drive Safety, Efficiency, User Experience 18
19 Thank you Teradata 19