COUPA: THE CLOUD PLATFORM FOR BUSINESS SPEND MANAGEMENT (BSM) December 4, 2018
|
|
|
- Warren Tate
- 5 years ago
- Views:
Transcription

")

1 COUPA: THE CLOUD PLATFORM FOR BUSINESS SPEND MANAGEMENT (BSM) December 4, Coupa Software, Inc. All Rights Reserved
2 SAFE HARBOR STATEMENT This presentation and the accompanying oral presentation include forward-looking statements. We intend for such forward looking statements to be covered by the safe harbor provisions for forward looking statements contained in the U.S. Private Securities Litigation Reform Act of All statements other than statements of historical facts, including statements regarding our future results of operations and financial position, customer lifetime value, strategy and plans, market size and opportunity, customer adoption and timing, competitive position, industry environment, potential growth opportunities, business model, benefits from acquisitions, products and product capabilities, expectations for future operations and our convertible notes, are forward-looking statements. Forward looking statements can be identified by terms such as anticipate, believe, estimates, targets, projects, could, expect, seeks, intend, may, plan, predict, potential, prospects, should, will, would or similar expressions and the negatives of those terms, although not all forward looking statements contain these identifying words. We have based these forward-looking statements on our current expectations and projections about future events and trends that we believe may affect our financial condition, results of operations, strategy, short- and long-term business operations and objectives, and financial needs. These forward-looking statements are subject to a number of risks, uncertainties and assumptions, including those described in Risk Factors in our most recently filed Form 10-K or 10-Q, which is available at and on the SEC s website at We operate in a very competitive and rapidly changing environment. New risks emerge from time to time. It is not possible for our management to predict all risks, nor can we assess the impact of all factors on our business or the extent to which any factor, or combination of factors, may cause actual results to differ materially from those contained in any forward-looking statements we may make. In light of these risks, uncertainties and assumptions, the forward-looking events and circumstances discussed in this presentation may not occur and actual results could differ materially and adversely from those anticipated or implied in the forward-looking statements. You should not rely upon forward-looking statements as predictions of future events. Although we believe that the expectations reflected in the forward-looking statements are reasonable, we cannot guarantee that the future results, levels of activity, performance or events and circumstances reflected in the forward-looking statements will be achieved or occur. Moreover, except as required by law, neither we nor any other person assumes responsibility for the accuracy and completeness of the forward-looking statements. Forward-looking statements represent our management s beliefs and assumptions only as of the date of this presentation. We undertake no obligation to update publicly any forward-looking statements for any reason after the date of this presentation to conform these statements to actual results or to changes in our expectations. In addition to U.S. GAAP financials, this presentation includes certain non-gaap financial measures. These non-gaap measures are in addition to, not a substitute for or superior to, measures of financial performance prepared in accordance with U.S. GAAP. A reconciliation of historical non-gaap measures to historical GAAP measures is contained in the Appendix. Coupa is not able, at this time, to provide a GAAP to non-gaap reconciliation for certain business model measures because of the difficulty of estimating certain items excluded from these non-gaap measures that cannot be reasonably predicted, such as charges related to stock-based compensation expenses. The effect of these excluded items may be significant Coupa Software, Inc. All Rights Reserved 2
3 Corporate Overview 2018 Coupa Software, Inc. All Rights Reserved 3


4 WHAT SALESFORCE IS TO SALES, COUPA IS TO SPEND SALES SPEND Marketing Procurement Services Support Web Platform Customer Relationship Management Business Spend Management Invoices Expenses Sourcing Inventory Payment Platform 2018 Coupa Software, Inc. All Rights Reserved 4


5 ALL-IN-ONE PLATFORM FOR BUSINESS SPEND MANAGEMENT (BSM) PRODUCTS and SERVICES Sourcing Payments Suppliers Procurement Invoicing Expenses 2018 Coupa Software, Inc. All Rights Reserved 5

 Source: Capital IQ. 2018 Coupa Software, Inc.")

6 OUR EXPANDING MARKET OPPORTUNITY 100,000+ Target Customers (1) ~$37 Billion Opportunity Current Customers, Current Solutions Current Customers, All Solutions ~$152M (2) ~$161M (2) All Modules (1) Source: Capital IQ Coupa Software, Inc. All Rights Reserved (2) Contracted subscription value for current customers for both current and all solutions as of October 31,


7 MAINSTREAM MARKET READY FOR ADOPTING COUPA 2010 to 2015 C H A S M 2016 to 2021 to Innovators and Early Adopters Early Majority Late Majority Laggards 2018 Coupa Software, Inc. All Rights Reserved 7


8 BREADTH OF CUSTOMERS 2018 Coupa Software, Inc. All Rights Reserved 8

9 ANALYSTS: COUPA IS A LEADER MAY 2018 JUNE 2018 SEPTEMBER 2018 Magic Quadrant for Procureto-Pay Suites Highest Rating in Completeness of Vision Marketscape for Supplier Relationship Management Highest rating in Capabilities and Strategy Spend Matters SolutionMap: Contract Services/Statement of Work Leader with the Highest Solution Score strong innovation and deep market understanding, as well as positive upgrade experience, account management and user group. incorporates unique technology and insights to decrease the efforts required to enable suppliers. one of DCR s strengths has been its innovative use of technology including its pioneering use of predictive analytics & artificial intelligence (AI) 2018 Coupa Software, Inc. All Rights Reserved 9 9


10 CORE VALUES ENSURE CUSTOMER SUCCESS STRIVE FOR EXCELLENCE FOCUS ON RESULTS 2018 Great Place to Work Survey 2018 Coupa Software, Inc. All Rights Reserved 10
11 COUPA INVESTMENT HIGHLIGHTS DISRUPTIVE CLOUD PLATFORM LARGE ADDRESSABLE MARKET RAPID PLATFORM ADOPTION ATTRACTIVE FINANCIAL MODEL Measurable Business Value Unified Platform Adoption by All $37Bn Market Opportunity $940Bn+ Cumulative Spend Under Management 1.5M+ Licensed Users 4M+ Suppliers $239M LTM Revenues 40% LTM YoY Total Revenue Growth 8.5% LTM Free Cash Flow Margin (1) Free cash flows are defined as operating cash flows less purchases of property and equipment. Free cash flow margin is defined as free cash flows divided by revenues Coupa Software, Inc. All Rights Reserved 11


12 WHY COUPA OPEN PRESCRIPTIVE COMPREHENSIVE USER-CENTRIC ACCELERATED 2018 Coupa Software, Inc. All Rights Reserved 12 12


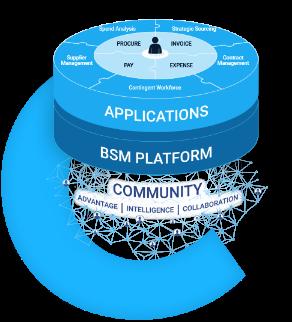
13 COMPREHENSIVE BSM PLATFORM COUPA 717* Customers 4M+ Suppliers $940Bn+ Spend Under Management 100+ Countries * Reported as of January 31, Coupa Software, Inc. All Rights Reserved 13
14 OPEN APPROACH: A STRATEGIC EXTENSION TO ANY ERP COUPA Spend Management Contracts Supplier Management Services Procurement Inventory Sourcing Compliance Portal Supplier Risk Suppliers Contract Authoring INVOICING PROCUREMENT EXPENSES Request Mgmt Social Marketing CRM ERP HCM Employee Self Service Benefits Performance Payroll Sales Customer Self Service Talent Service HRMS 2018 Coupa Software, Inc. All Rights Reserved 14

15 OPEN APPROACH: A STRATEGIC EXTENSION TO ANY ERP COUPA Spend Management CRM ERP HCM 2018 Coupa Software, Inc. All Rights Reserved 15
16 OPEN APPROACH: EASILY CONNECT TO SUPPLIERS AND SYSTEMS COUPA Easy Supplier Enablement Open Business Network Pre-Enabled Pre-Negotiated SAN CSP Invoice Smash cxml EDI 2018 Coupa Software, Inc. All Rights Reserved 16
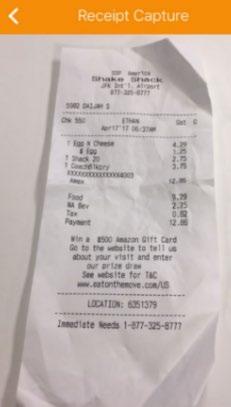


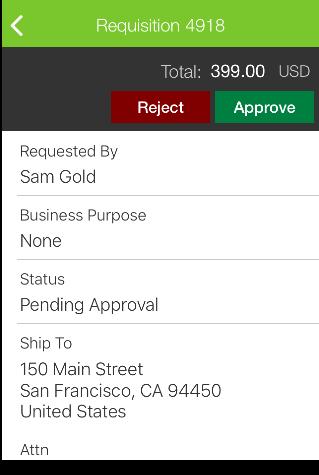
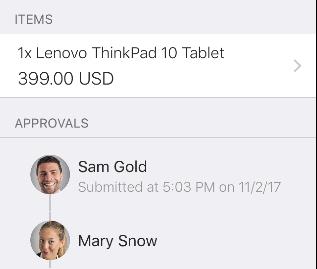

17 USER-CENTRIC: BUILT FOR EVERYONE, NOT JUST BACKOFFICE COUPA EMPLOYEE SUPPLIER The Best UI is No UI 2018 Coupa Software, Inc. All Rights Reserved 17

18 PRESCRIPTIVE: COMMUNITY INTELLIGENCE COUPA Listen objectively to all information Think using artificial intelligence Listen Community Intelligence Think Smarter Over Time Prescribe instant solutions Prescribe 2018 Coupa Software, Inc. All Rights Reserved 18

19 PRESCRIPTIVE: COMMUNITY INTELLIGENCE COUPA Suppliers Items Fraud 2018 Coupa Software, Inc. All Rights Reserved 19


20 MEASURABLE VALUE AS A SERVICE We moved from 30% PO-based spend to 100% overnight. We manage 10B of spend in the Coupa Platform and have achieved >80% end-user satisfaction. With Coupa, we've achieved 100% audit compliance Coupa Software, Inc. All Rights Reserved

21 CONTINUED PROGRESS AGAINST KEY METRICS AND RECENT WINS Q3 FY2018 Q3 FY2019 Q3 FY2018 Q3 FY2019 Cumulative Spend Under Management >$570Bn >$940Bn LTM Revenue $171M $239M Savings to Date >$20Bn >$35Bn Non-GAAP Gross Margin 72.6% 73.3% Recent Customer Wins 2018 Coupa Software, Inc. All Rights Reserved 21

22 NETWORK EFFECTS CREATE BARRIERS TO ENTRY AGGREGATE SPEND SUPPLIER NETWORK COMMUNITY INTELLIGENCE LEVERAGE $940Bn+ CUMULATIVE SPEND UNDER MANAGEMENT PATENTED METHOD, SYSTEM AND APPARATUS FOR REQUISITIONING PATENTED SHOPPING AT E-COMMERCE SITES WITHIN A BUSINESS PROCUREMENT APPLICATION PATENTED POLICY SYSTEM FOR E-PROCUREMENT PATENTED FEEDBACK VALIDATION OF ELECTRONICALLY GENERATED FORMS PATENTED PROVIDING ACCESS TO A NETWORKED APPLICATION WITHOUT AUTHENTICATION 2018 Coupa Software, Inc. All Rights Reserved 22


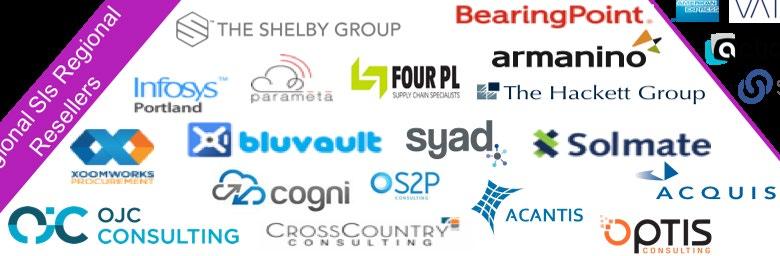

23 Partner Ecosystem 2018 Coupa Software, Inc. All Rights Reserved 23


24 GROWTH DRIVERS Market Penetration Partner Ecosystem Global Expansion Strategic Acquisitions Adoption & Expansion 2018 Coupa Software, Inc. All Rights Reserved 24


25 STRONG LEADERSHIP TEAM WITH DIVERSE EXPERIENCE ROB BERNSHTEYN CHIEF EXECUTIVE OFFICER, CHAIRMAN OF THE BOARD TODD FORD CHIEF FINANCIAL OFFICER STEVE WINTER CHIEF REVENUE OFFICER MARK RIGGS CHIEF CUSTOMER OFFICER RAVI THAKUR SVP, BUSINESS ACCELERATION CHANDAR PATTABHIRAM CHIEF MARKETING OFFICER ROGER GOULART SVP, BUSINESS DEVELOPMENT & ALLIANCES RAJA HAMMOUD SVP, PRODUCTS JP KRISHNAMOORTHY SVP, ENGINEERING RAY MARTINELLI EVP, PEOPLE JON STUEVE SVP & GENERAL COUNSEL DAVID WILLIAMS SVP, TECHNOLOGY 2018 Coupa Software, Inc. All Rights Reserved 25
26 Financial Overview 2018 Coupa Software, Inc. All Rights Reserved 26
27 FINANCIAL HIGHLIGHTS STRONG REVENUE GROWTH RECURRING SUBSCRIPTION REVENUE MODEL WITH HIGH VISIBILITY CONSISTENT COHORT SPENDING WITH HIGH PROFITABILITY COMPELLING UNIT ECONOMICS DEMONSTRATE POWERFUL BUSINESS MODEL 2018 Coupa Software, Inc. All Rights Reserved 27
28 RAPIDLY INCREASING CUMULATIVE SPEND UNDER MANAGEMENT CUMULATIVE SPEND UNDER MANAGEMENT ($Bn) >$940 ~$370Bn processed in last twelve months $570 $365 $190 $3 $7 $23 $57 $110 FY11 FY12 FY13 FY14 FY15 FY16 FY17 F3Q18 F3Q Coupa Software, Inc. All Rights Reserved 28
29 RAPID REVENUE GROWTH HISTORICAL ANNUAL REVENUE ($M) HISTORICAL QUARTERLY SUBSCRIPTION SERVICES REVENUE ($M) $187 12% 40% YoY Growth $84 10% $134 12% 88% 88% $34 $36 $40 $43 $47 $50 $55 $61 90% 49% CAGR FY16 FY17 FY18 Subscription Services Professional Services FQ4'17 FQ1'18 FQ2'18 FQ3'18 FQ4'18 FQ1'19 FQ2'19 FQ3' Coupa Software, Inc. All Rights Reserved 29
30 COMPELLING UNIT ECONOMICS >$6 $1 LTV/ CAC Customer Acquisition Cost Lifetime Value Note 1: LTV/CAC was reported for the period ending FY18; Updates to this metric are expected to be provided on an annual basis. Note 2: We calculate the lifetime value of our customers and associated customer acquisition costs for a particular year by comparing (1) gross profit from net new subscription revenues for the year multiplied by the inverse of the estimated subscription renewal rate to (2) total sales and marketing expense incurred in the preceding year Coupa Software, Inc. All Rights Reserved 30
31 STRONG GROSS MARGIN PERFORMANCE QUARTERLY GROSS MARGIN TRENDS (1)(2) CONSIDERATIONS 73% 73% 71% 71% 73% 73% 72% 75% Professional Services margins are stabilizing with revenue recognition fully transitioned from completed project to proportional performance 82% 80% 81% 81% 82% 81% 82% 81% Gross margin improvements despite continued investments in Professional Services footprint, partner ecosystem and support organization 10% 18% 6% 8% 4% (5%) (9%) (5%) FQ4'17 FQ1'18 FQ2'18 FQ3'18 FQ4'18 FQ1'19 FQ2'19 FQ3'19 Subscription Gross Margin Professional Services & Other Gross Margin Total Gross Margin (1) For a reconciliation of GAAP to Non-GAAP metrics, refer to the Appendix. (2) Bar chart represents gross profit dollar amounts while data labels refer 2018 to gross Coupa margins. Software, Inc. All Rights Reserved 31
32 STRIVING FOR EXCELLENCE-PATH TO $1B (NON-GAAP) (1) MID-TERM (10/6/16) F3Q19 MID-TERM LONG-TERM Gross Margin 65%-67% 73.3% 73%-75% 78%-80% R&D as % of Revenue S&M as % of Revenue G&A as % of Revenue 18%-21% 19.3% 18%-21% 15%-18% 48%-51% 31.5% 40%-42% 33%-38% 11%-13% 13.9% 11%-13% 7%-10% Operating Margin (13%-23%) 8.5% BREAK-EVEN 25%+ FCF Margin (2) 0%-5% 8.5% (TTM) 5%-10% 30%+ (1) For a reconciliation of GAAP to Non-GAAP metrics, refer to the Appendix. (2) FCF stands for free cash flow, which is calculated as operating cash flows less purchases of property and equipment. Free cash flow margin is defined as free cash flows divided by revenues. *These measures are forward-looking; are subject to significant business, economic, regulatory and competitive uncertainties and contingencies, many of which are beyond the control of the Company and its management; and are based upon assumptions with respect to future decisions, which are subject to change. Actual results will vary and those variations may be material. For discussion of some of the important factors that could cause these variations, please consult the Risk Factors section in our most recently filed Form 10-K or 10-Q. Nothing in this presentation should be regarded as a representation by any person that these measures will be achieved and the Company undertakes no duty 2018 to update Coupa these Software, measures. Inc. All Rights Reserved 32

33 APPENDIX 2018 Coupa Software, Inc. All Rights Reserved 33
34 GAAP TO NON-GAAP RECONCILIATION Q1 FY'18 Q2 FY'18 Q3 FY'18 Q4 FY'18 Q1 FY'19 Q2 FY'19 Q3 FY'19 FY 2018 Subscription Revenue $35,664 $39,764 $42,795 $46,642 $49,966 $55,374 $ 60,559 $164,865 Professional Services Revenue and Other $5,473 $4,787 $4,545 $7,110 $6,386 $6,277 6,896 $21,915 Total Revenues $41,137 $44,551 $47,340 $53,752 $56,352 $61,651 $67,455 $186,780 GAAP Subscription COGS $7,996 $9,025 $9,554 $9,906 $11,174 $11,773 $13,990 $36,481 Amortization of acquired intangible assets $486 $788 $747 $771 $784 $844 $1,408 $2,792 Share-based compensation expenses $355 $529 $585 $636 $831 $1,093 $1,152 $2,105 Non-GAAP Subscription COGS $7,155 $7,708 $8,222 $8,499 $9,559 $9,836 $11,430 $31,584 GAAP Subscription Gross Profit $27,668 $30,739 $33,241 $36,736 $38,792 $43,601 $46,569 $128,384 % Margin 78% 77% 78% 79% 78% 79% 77% 78% Non-GAAP Subscription Gross Profit $28,509 $32,056 $34,573 $38,143 $40,407 $45,538 $49,129 $133,281 % Margin 80% 81% 81% 82% 81% 82% 81% 81% GAAP Professional Services COGS $5,501 $5,923 $5,441 $6,560 $6,951 $6,867 $7,674 $23,425 Share-based compensation expenses $563 $716 $685 $757 $946 $1,069 $1,071 $2,722 Non-GAAP Professional Services COGS $4,938 $5,207 $4,756 $5,803 $6,005 $5,798 $6,603 $20,703 GAAP Professional Services Gross Profit ($28) ($1,136) ($896) $550 ($565) ($590) ($778) ($1,510) % Margin (1%) (24%) (20%) 8% (9%) (9%) (11%) (7%) Non-GAAP Professional Services Gross Profit $536 ($420) ($211) $1,307 $381 $479 $293 $1,212 % Margin 10% (9%) (5%) 18% 6% 8% 4% 6% GAAP Total Gross Profit $27,640 $29,603 $32,345 $37,286 $38,227 $43,011 $45,791 $126,874 % Margin 67% 66% 68% 69% 68% 70% 68% 68% Non-GAAP Total Gross Profit $29,044 $31,636 $34,362 $39,450 $40,788 $46,017 $49,422 $134,493 % Margin 71% 71% 73% 73% 72% 75% 73% 72% 2018 Coupa Software, Inc. All Rights Reserved 34
35 GAAP TO NON-GAAP RECONCILIATION (CONT D) Q1 FY'18 Q2 FY'18 Q3 FY'18 Q4 FY'18 Q1 FY'19 Q2 FY'19 Q3 FY'19 FY 2018 GAAP Research & Development $9,171 $10,720 $11,410 $13,235 $13,201 $13,415 $16,077 $44,536 Share-based compensation expenses $1,152 $1,647 $1,999 $2,130 $2,547 $2,958 $3,046 $6,928 Non-GAAP R&D expenses $8,019 $9,073 $9,410 $11,105 $10,654 $10,457 $13,031 $37,608 % of Revenue 19% 20% 20% 21% 19% 17% 19% 20% GAAP Sales & Marketing $20,679 $23,812 $22,401 $21,830 $24,660 $26,580 $25,622 $88,722 Amortization of acquired intangible assets $0 $189 $195 $258 $290 $251 $453 $642 Share-based compensation expenses $1,600 $2,340 $2,212 $2,324 $2,970 $3,863 $3,899 $8,476 Non-GAAP S&M expenses $19,079 $21,283 $19,995 $19,248 $21,400 $22,466 $21,270 $79,604 % of Revenue 46% 48% 42% 36% 38% 36% 32% 43% GAAP General & Administrative $8,177 $9,430 $9,693 $11,278 $12,435 $13,640 $14,010 $38,578 Share-based compensation expenses $1,607 $2,406 $2,386 $3,065 $4,018 $4,575 $4,652 $9,464 Non-GAAP G&A expenses $6,570 $7,024 $7,307 $8,213 $8,417 $9,065 $9,358 $29,114 % of Revenue 16% 16% 15% 15% 15% 15% 14% 16% GAAP Operating Profit ($10,387) ($14,359) ($11,159) ($9,057) ($12,069) ($10,624) ($9,918) ($44,962) % Margin (25%) (32%) (24%) (17%) (21%) (17%) (15%) (24%) Non-GAAP Operating Profit ($4,624) ($5,743) ($2,350) $884 $317 $4,029 $5,763 ($11,833) % Margin (11%) (13%) (5%) 2% 1% 7% 9% (6%) Operating Cash Flows $6,943 $9,178 $5,177 ($1,745) $12,636 $11,308 4,019 $19,553 Less: Purchases of property and equipment ($996) ($1,105) ($1,486) ($902) ($1,124) ($2,292) (1,454) (4,489) Free Cash Flows $5,947 $8,073 $3,691 ($2,647) $11,512 $9,016 $2,565 $15,064 % Margin 14% 18% 8% (5%) 20% 15% 4% 8% * Free cash flow is generally calculated as operating cash flows less purchases of property and equipment. Free cash flow margin is defined as free cash flows divided by revenues Coupa Software, Inc. All Rights Reserved 35
36 GAAP TO NON-GAAP RECONCILIATION (CONT D) Q1 FY'16 Q2 FY'16 Q3 FY'16 Q4 FY'16 Q1 FY'17 Q2 FY'17 Q3 FY'17 Q4 FY'17 FY 2016 FY 2017 Subscription Revenue $14,289 $17,333 $20,757 $23,288 $25,372 $27,783 $30,799 $33,834 $75,667 $117,788 Professional Services Revenue and Other $1,520 $1,371 $2,044 $3,076 $3,811 $3,349 $4,643 $4,184 $8,011 $15,987 Total Revenues $15,809 $18,704 $22,801 $26,364 $29,183 $31,132 $35,442 $38,018 $83,678 $133,775 GAAP Subscription COGS $3,550 $3,995 $4,280 $4,979 $6,050 $6,029 $6,346 $6,630 $16,804 $25,055 Amortization of acquired intangible assets $13 $13 $14 $347 $221 $212 $212 $308 $387 $953 Share-based compensation expenses $45 $54 $62 $74 $125 $140 $150 $300 $235 $715 Non-GAAP Subscription COGS $3,492 $3,928 $4,204 $4,558 $5,704 $5,677 $5,984 $6,022 $16,182 $23,387 GAAP Subscription Gross Profit $10,739 $13,338 $16,477 $18,309 $19,322 $21,754 $24,453 $27,204 $58,863 $92,733 % Margin 75% 77% 79% 79% 76% 78% 79% 80% 78% 79% Non-GAAP Subscription Gross Profit $10,797 $13,405 $16,553 $18,730 $19,668 $22,106 $24,815 $27,812 $59,485 $94,401 % Margin 76% 77% 80% 80% 78% 80% 81% 82% 79% 80% GAAP Professional Services COGS $2,594 $3,639 $3,914 $4,960 $5,968 $5,452 $5,031 $4,763 $15,107 $21,214 Share-based compensation expenses $45 $840 $59 $70 $135 $109 $155 $373 $1,014 $772 Non-GAAP Professional Services COGS $2,549 $2,799 $3,855 $4,890 $5,833 $5,343 $4,876 $4,390 $14,093 $20,442 GAAP Professional Services Gross Profit ($1,074) ($2,268) ($1,870) ($1,884) ($2,157) ($2,103) ($388) ($579) ($7,096) ($5,227) % Margin (71%) (165%) (91%) (61%) (57%) (63%) (8%) (14%) (89%) (33%) Non-GAAP Professional Services Gross Profit ($1,029) ($1,428) ($1,811) ($1,814) ($2,022) ($1,994) ($233) ($206) ($6,082) ($4,455) % Margin (68%) (104%) (89%) (59%) (53%) (60%) (5%) (5%) (76%) (28%) GAAP Total Gross Profit $9,665 $11,070 $14,607 $16,425 $17,165 $19,651 $24,065 $26,625 $51,767 $87,506 % Margin 61% 59% 64% 62% 59% 63% 68% 70% 62% 65% Non-GAAP Total Gross Profit $9,768 $11,977 $14,742 $16,916 $17,646 $20,112 $24,582 $27,606 $53,403 $89,946 % Margin 62% 64% 65% 64% 60% 65% 69% 73% 64% 67% 2018 Coupa Software, Inc. All Rights Reserved 36
37 GAAP TO NON-GAAP RECONCILIATION (CONT D) Q1 FY'16 Q2 FY'16 Q3 FY'16 Q4 FY'16 Q1 FY'17 Q2 FY'17 Q3 FY'17 Q4 FY'17 FY 2016 FY 2017 GAAP Research & Development $4,431 $5,792 $5,965 $6,579 $7,840 $7,206 $7,179 $8,037 $22,767 $30,262 Amortization of acquired intangible assets $0 $53 $105 ($158) $0 $0 $0 $0 $0 $0 Share-based compensation expenses $107 $750 $152 $227 $322 $303 $357 $784 $1,236 $1,766 Non-GAAP R&D expenses $4,324 $4,989 $5,708 $6,510 $7,518 $6,903 $6,822 $7,253 $21,531 $28,496 % of Revenue 27% 27% 25% 25% 26% 22% 19% 19% 26% 21% GAAP Sales & Marketing $10,679 $13,532 $14,306 $16,196 $15,836 $19,252 $16,315 $17,159 $54,713 $68,562 Share-based compensation expenses $176 $210 $706 $255 $471 $441 $937 $1,282 $1,347 $3,131 Non-GAAP S&M expenses $10,503 $13,322 $13,600 $15,941 $15,365 $18,811 $15,378 $15,877 $53,366 $65,431 % of Revenue 66% 71% 60% 60% 53% 60% 43% 42% 64% 49% GAAP General & Administrative $2,480 $8,719 $3,709 $4,632 $5,553 $4,620 $6,068 $7,865 $19,540 $24,106 Litigation-related costs $642 $848 $327 $126 $123 $26 $1 $0 $1,943 $150 Share-based compensation expenses $186 $5,620 $547 $383 $653 $566 $785 $1,064 $6,736 $3,068 Non-GAAP G&A expenses $1,652 $2,251 $2,835 $4,123 $4,777 $4,028 $5,282 $6,801 $10,861 $20,888 % of Revenue 10% 12% 12% 16% 16% 13% 15% 18% 13% 16% GAAP Operating Profit ($7,925) ($16,973) ($9,373) ($10,982) ($12,064) ($11,427) ($5,497) ($6,436) ($45,253) ($35,424) % Margin (50%) (91%) (41%) (42%) (41%) (37%) (16%) (17%) (54%) (26%) Non-GAAP Operating Profit ($6,711) ($8,585) ($7,401) ($9,658) ($10,014) ($9,630) ($2,900) ($2,325) ($32,355) ($24,869) % Margin (42%) (46%) (32%) (37%) (34%) (31%) (8%) (6%) (39%) (19%) 2018 Coupa Software, Inc. All Rights Reserved 37