Measure Consume. Store. Data Governance
|
|
|
- Dayna Chambers
- 5 years ago
- Views:
Transcription

1
2
3

4 Collect Process Manage Measure Consume Store Data Governance
5 Big Data Sources (Raw, Unstructured) Azure Machine Learning Business Insights Sensors Devices Intelligent Systems Service Hadoop on Windows Azure Summarize & Load SQL Server Data Marts Bots Hadoop on Windows Server SQL Server Parallel Data Warehouse SQL Server Reporting Services Interactive Reports Crawlers SQL Server Analysis Server SQL Server StreamInsight Enterprise ETL with SSIS, DQS, MDS Performance Scorecards ERP CRM LOB Alerts, Notifications OLTP Systems
6 Big Data Sources (Raw, Unstructured) Collect Sensors Devices Bots Process Intelligent Systems Service Store Hadoop on Windows Azure Hadoop on Windows Server Summarize & Load Azure Machine Learning Measure SQL Server Parallel Data Warehouse SQL Server Data Marts SQL Server Reporting Services Business Insights Consume Interactive Reports Crawlers Manage SQL Server Analysis Server Enterprise ETL with SSIS, Data SQL Server DQS, MDS StreamInsight Governance ERP CRM LOB Performance Scorecards Alerts, Notifications OLTP Systems

7

8
9


10 More and more data is collected every day but PREDICT FAILURES Asset downtime & maintenance costs ROOT CAUSE ANALYSIS Product quality & brand perception WARRANTY CLAIMS Future claims & remaining useful life do we use them to make better decisions?

11 but there is extreme potential for improving our processes.

12 But what if you could:

13 What if you could: Transform your business with Predictive Analytics


14 Predict failures before they actually happen The Solution Develop a more profitable manufacturing process by maximizing asset productivity using predictive analytics to spot failures before they occurred The Goal Predict when and where asset failures are likely to occur Prevent costly production line interruptions Calculate reliability of assets at any point in time The Challenge Acquiring a complete view of the processes: Sensor data Operating conditions Telematics data Event data

15 Perform root-cause analysis of failures The Goal Minimize product quality issues by understanding what is happening and why it is happening The Challenge Understanding the business flow and acquiring expert knowledge Operator error Supplier issues Design problems The Solution Continuously asses quality throughout the manufacturing process by predicting problems early in the product cycle
16 Reduce warranty claims The Goal Avoid costly warranty claims by providing resolution before customers are aware of the issues Minimize the risk of unpredicted failures The Challenge Monitoring the condition of the assets by collecting telematics data about operating conditions Integrating information from operations, finance, and customer systems The Solution Predict future warranty claims and avoid high services costs and product recalls
17

18 What s transforming? Equipment Deep & Continuous Engagement
 Agent Gateway Event Hub & Azure Service Bus ISS (Intelligent Systems Service) Complex Event Processing & Rules Engine Tables BLOBS SQL Azure HDFS IF {condition} THEN")
19 Microsoft IoT Services Architecture : ISS+AzureML Customer Relationship Design & Engineering Manufacturing & Supply Chain Service & Maintenance Azure Service Bus Industrial Equipment ID ISS (Intelligent Systems Service) Agent Gateway Event Hub & Azure Service Bus ISS (Intelligent Systems Service) Complex Event Processing & Rules Engine Tables BLOBS SQL Azure HDFS IF {condition} THEN {action}


20 IoT transformation with new business models Connected Product Innovation Connected Operations Connected Marketing, Sales, Services Intelligent products Examples: Product performance and utilization patterns X-functional information into R&D from Customer and Marketing, Sales or Services Operational excellence Examples: Predictive Maintenance Asset Performance Management Energy Management Condition based Maintenance Service-centric relationships Examples: Event-driven marketing campaign and spent Customer and Sentiment analytics Predictive Maintenance
21 Microsoft Azure Intelligent Systems Service - Manufacturing MANUFACTURING PLANT GLOBAL FACILITY INSIGHT CUSTOMER SITE GLOBAL OPERATIONS Monitor production flow in near-real time to eliminate waste and unnecessary work in process inventory. Manage equipment remotely, using temperature limits and other settings to conserve energy and reduce costs. Transmits operational information to the partner (e.g. OEM) and to field service engineers for remote process automation and optimization. Management I can see my production line status and recommend adjustments to better manage operational cost. Implement conditionbased maintenance alerts to eliminate machine down-time and increase throughput. Aggregate product data, customer sentiment, and other third-party syndicated data to identify and correct quality issues. Provide cross-channel visibility into inventories to optimize supply and reduce shared costs in the value chain. R&D Field Service I gain insight into usage patterns from multiple customers and track equipment deterioration, enabling me to reengineer products for better performance. I know when to deploy the right resources for predictive maintenance to minimize equipment failures and reduce service cost. THIRD-PARTY LOGISTICS
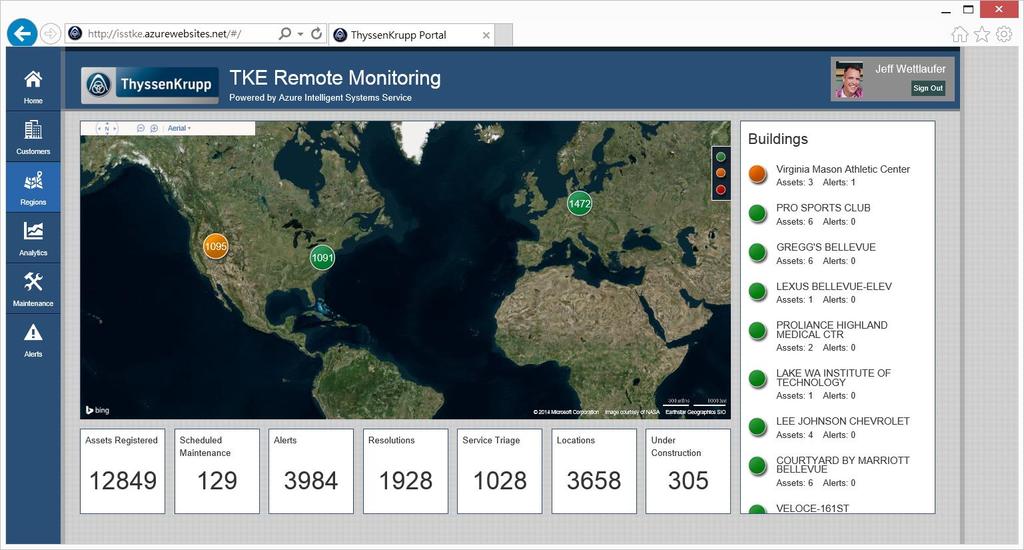
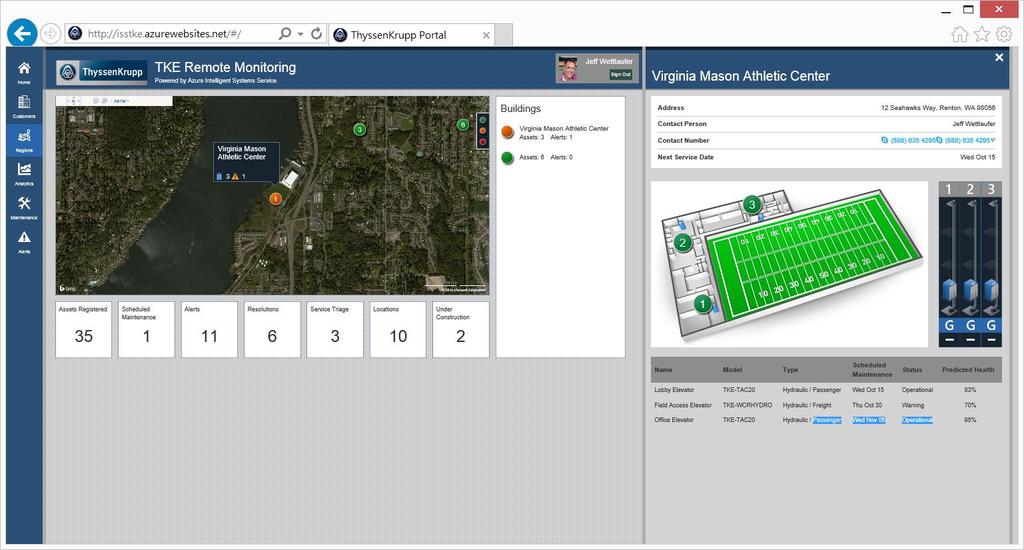
22 Microsoft IoT with Machine Learning Case Study ThyssenKrupp Elevator: ThyssenKrupp Elevator is one of the world's leading elevator companies. With sales of 6.2 billion and more than 49,000 employees at 900 locations CHALLENGE SOLUTIONS BENEFITS Leading global manufacturer ThyssenKrupp Elevator maintains more than 1.1 million elevators worldwide, including those at some of the world s most iconic buildings. ThyssenKrupp wanted to better compete in their industry by offering dramatically increased uptime, taking preventative maintenance a step further to predictive and even preemptive service. ThyssenKrupp teamed up with Microsoft and CGI to create a connected, intelligent asset monitoring system based on Microsoft Azure Intelligent Systems Service, Power BI for Office 365, and Microsoft Azure Machine Learning. The solution connects thousands of sensors and systems in its elevators to the cloud and draws this data into a dashboard available on PCs and mobile devices for a real-time view of key performance indicators. Increases reliability through predictive maintenance and rapid, remote diagnostic capabilities Reduces costs for ThyssenKrupp and their customers Rich, real-time data visualization Data continually feeds into dynamic predictive models Two-way flow of data enables diagnostics mode and remote elevator commands
23

24