Pitney Bowes Investor Relations Overview
|
|
|
- Beryl Goodwin
- 5 years ago
- Views:
Transcription

1 Pitney Bowes Investor Relations Overview
2 Forward-Looking Statements This document contains forward-looking statements about the Company s expected or potential future business and financial performance. Forward-looking statements include, but are not limited to, statements about its future revenue and earnings guidance and other statements about future events or conditions. Forward-looking statements are not guarantees of future performance and involve risks and uncertainties that could cause actual results to differ materially from those projected. These risks and uncertainties include, but are not limited to: declining physical mail volumes; competitive factors, including pricing pressures, technological developments and the introduction of new products and services by competitors; our success in developing new products and services, including digital-based products and services; obtaining regulatory approvals, if required, and the market s acceptance of these new products and services; changes in postal or banking regulations; changes in, or loss of, our contractual relationships with the United States Postal Service or posts in our other major markets; changes in labor conditions and transportation costs; macroeconomic factors, including global and regional business conditions that adversely impact customer demand, foreign currency exchange rates, interest rates and tariffs; economic tensions between governments and changes in international trade policies, Brexit and other factors as more fully outlined in the Company's 2017 Form 10-K Annual Report and other reports filed with the Securities and Exchange Commission. Pitney Bowes assumes no obligation to update any forward-looking statements contained in this document as a result of new information, events or developments. 2
3 Use of Non-GAAP Measures The Company's financial results are reported in accordance with generally accepted accounting principles (GAAP); however, in its disclosures the Company uses certain non-gaap measures, such as adjusted earnings before interest and taxes (EBIT), adjusted earnings before interest, taxes, depreciation and amortization (EBITDA), adjusted earnings per share (EPS), revenue growth on a constant currency basis and free cash flow. The Company reports measures such as adjusted EBIT, adjusted EPS and adjusted net income to exclude the impact of special items like restructuring charges, tax adjustments, goodwill and asset write-downs, and costs related to dispositions and acquisitions. While these are actual Company expenses, they can mask underlying trends associated with its business. Such items are often inconsistent in amount and frequency and as such, the adjustments allow an investor greater insight into the current underlying operating trends of the business. In addition, revenue growth is presented on a constant currency basis to exclude the impact of changes in foreign currency exchange rates since the prior period under comparison. Constant currency measures are intended to help investors better understand the underlying operational performance of the business excluding the impacts of shifts in currency exchange rates over the period. Constant currency is calculated by converting our current quarter reported results using the prior year s exchange rate for the comparable quarter. This comparison allows an investor insight into the underlying revenue performance of the business and true operational performance from a comparable basis to prior period. A reconciliation of reported revenue to constant currency revenue can be found in the Company s attached financial schedules. 3
4 Use of Non-GAAP Measures The Company reports free cash flow in order to provide investors insight into the amount of cash that management could have available for other discretionary uses. Free cash flow adjusts GAAP cash from operations for capital expenditures, restructuring payments, unusual tax settlements, special contributions to the Company s pension fund and cash used for other special items. A reconciliation of GAAP cash from operations to free cash flow can be found in the Company s attached financial schedules. Segment EBIT is the primary measure of profitability and operational performance at the segment level. Segment EBIT is determined by deducting from segment revenue the related costs and expenses attributable to the segment. Segment EBIT excludes interest, taxes, general corporate expenses not allocated to a particular business segment, restructuring charges and goodwill and asset impairments, which are recognized on a consolidated basis. The Company has also included segment EBITDA as a useful measure for profitability and operational performance, and an additional way to look at the economics of the segments, especially in light of some of the Company s more recent, larger acquisitions. Segment EBITDA further excludes depreciation and amortization expense for the segment. A reconciliation of segment EBIT and EBITDA to net income can be found in the attached financial schedules. Pitney Bowes has provided a quantitative reconciliation to GAAP in supplemental schedules. This information can be found at the Company's web site 4
5 Recent Transactions On July 2, 2018, the Company completed the sale of DMT Production Mail and supporting software to Platinum Equity. As a result of the sale, the DMT Production Mail and supporting software operations have been classified as discontinued operations and prior period amounts have been reclassified to conform to this presentation. On January 31, 2019, the Company announced that it signed a definitive agreement to sell its SMB direct operations in six smaller European countries to BAVARIA Industries Group AG. 5
6 A Different Company From A core Mailing business with the option to grow Digital Commerce Solutions To A Commerce Services growth company with the option to expand our opportunity with our SMB client base 6
7 A Different Company that has Moved to Growth Longer Term Pitney Bowes Revenue Growth (4%) 2%* 4% to 6% % Revenue from Growth Businesses Growth All Other 83% 17% 44% 56% 34% - 38% 62% - 66% * 2018 based on proforma, as reported revenue 7
8 A Different Company that has Moved to Growth Longer Term % Revenue from Shipping vs Mailing* Shipping Mailing 2% 98% 65% 35% 49% - 53% 47% - 51% Pitney Bowes EBIT Margin 17% 13% Mid Teens * Revenue excludes Software Solutions 8
9 Strategy Value Stabilize Mailing Improved North America Mailing equipment sales trend Exited non-core markets and products Transitioned go-to-market Improved digital client experience Launched new products (SendPro, Relay ) Operational Excellence Improved balance sheet paid down $500MM in debt Launched Enterprise Business Platform Reduced SG&A by nearly $300MM Improved working capital through reduced gross inventory levels Maintained competitive dividend Grow Digital Commerce Achieved double-digit growth in Digital Commerce Services Acquired Borderfree; divested Imagitas Expanded cross-border clients Launched new products and services Expanded Software indirect channel Acquired Newgistics
10 Strategy Value Reduce Complexity of Shipping Domestic and cross-border Outbound and returns Multi-carrier solutions Spend and delivery time optimization End-to-end tracking visibility Operational Excellence 2018 debt reduction of $565MM Expense optimization $150MM+ gross spend reduction Network efficiency and scalability Client experience Leverage Economies of Scale and Experience Technology Expand commerce cloud capabilities Data / Data Management Client Mailing / Shipping services Expanded financing services Postal / Carrier relationships Core Mailing Foundation Today Longer Term 10
11 Investment Thesis Go Forward End Markets with Stronger Growth Continued Operational Excellence for Profit Leverage Portfolio Balanced in Growth and Profitability Balanced Investment in Growth and Shareholder Return 11
12 Commerce Services


13 61% frustrated by holiday post-purchase experience Consumers have raised the bar on E2E EXPERIENCE SHIPPING RETURNS DOMESTIC CROSS-BORDER 13

14 Opportunity for Pitney Bowes to: Provide tailored solutions for retailers and marketplaces of all sizes to compete in a fast and free world globally Use our technology, data, and client experience as differentiators Bring more value to our 700+ retailers and marketplaces, 3,000+ Presort clients, and dozens of partners 14

15 Commerce Services Cross-border Solutions Shipping Solutions Fulfillment & Delivery Services Returns Services Presort Services BETTER TOGETHER Common technology and platforms Unparalleled client base Operating efficiencies Postal and carrier relationships 15
16 16

17 Cross-border Solutions The industry s most proven, capable, and scalable cross-border platform 17

18 Shipping Solutions Unlocking the secret to better shipping for retailers of all sizes 18

19 Fulfillment & Delivery Services A post-purchase experience that enhances your brand promise 19

20 Returns Services Turning customer returns into returning customers 20

21 Presort Services The industry leader in sorting out simplicity and savings 21

22 Commerce Services Priorities Grow Expand margins Capture synergies 22
23 Shipping APIs Gateway to Growing Set of Shipping Solutions International PB Carrier Network Data-Driven Express Delivery Guaranteed Delivery Integrated Multi-Carrier Tracking USPS Label Creation Newgistics Network Business Rules Engine Shipping API Flexible Payment Options Expanded Financial Services Tracking Multi-Carrier Label Creation Parcel Protection 2016 Presort Labels Cross-border Clearance & Duties


24 Significant Cross-Sell Opportunity 700+ Retail and Marketplace Clients for Cross-Sell 250+ PB Retail and Marketplace Clients 500+ Newgistics Clients Less than 50 24


25 Participating in China s Rapid Ecommerce Growth Helping U.S. Retailers Reach Chinese Consumers Providing Delivery Solutions for Chinese Merchants to Reach U.S. Consumers 25

26 Leveraging the Commerce Cloud to Move Faster and Expand Margins Carrier Library Label Creation Multi-Carrier Tracking Data Commerce Cloud Commerce Services API Platform Cloud Services Design System DevOps Data Data Science Practice Group Address Validation Location Intelligence APIs 26


27 Geographic Expansion Driving Growth and Margin 37 Presort Locations 11 Newgistics Locations In 2018: 4 new locations opened 2 locations consolidated 27


28 Targeted Automation Improves Margins and Accelerates Scale Palletizer Auto Sleever Automated Fulfillment 28


29 The path to sustainable profitability in Global Ecommerce 29
30 Global Ecommerce Has a Track Record of Delivering Growth +102% CAGR

31 Following a Proven Formula for Margin Expansion Presort Services Then Now Operating Centers Mail Volumes 2.5B 16.5B EBIT % 8% 14% Proven Formula Network Expansion Volume Growth Client Experience Focus Operational Excellence 31
32 Path to Profitability for Global Ecommerce Economies Growth + of Scale + Economies of Experience - Continued Investment Go-to-market execution Cross-sell New services and solutions Spread investments and fixed costs Transportation costs Capacity utilization Commerce Cloud Financial Services USPS/Carrier relationships Presort Playbook Scalability (Network + Tech) Operational improvements Expanded service offerings Go-to-market Automation Long Term Target = 10-15% EBIT; 15-20% EBITDA 32
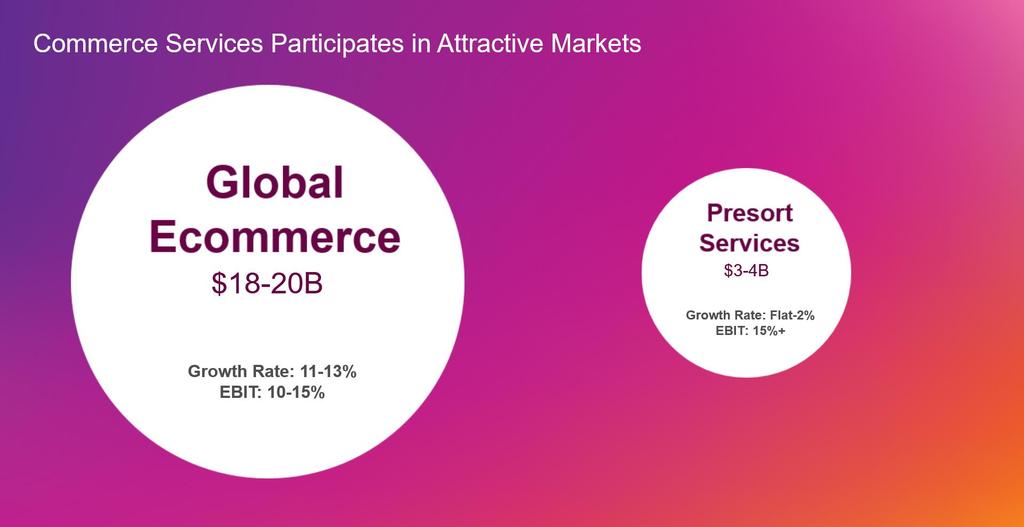
33 Commerce Services We are in attractive markets where we have proven we can win Focused on growth, expanding margins and capturing synergies The path to profitability is clear 33
34 Small and Medium Business (SMB) Solutions

35 SMB is in Our DNA Clients want cost effective, innovative solutions, tailored to small businesses, that help them take the complexity out of their business 35
36 Expanding Our Portfolio into the Growing Office Shipping Market Mailing + = Office Shipping Global SMB Long Term Market EBIT Margin 30% to 35% Addressable Market Long Term Market Growth Rate ~ $3B market ~ $1B market (4%) to (3%) 3% to 5% $3 - $4B (4%) to (2%) 36


37 The Pitney Bowes Commerce Cloud is a commerce enabler, providing access to solutions, analytics and APIs across the full commerce continuum 37 37

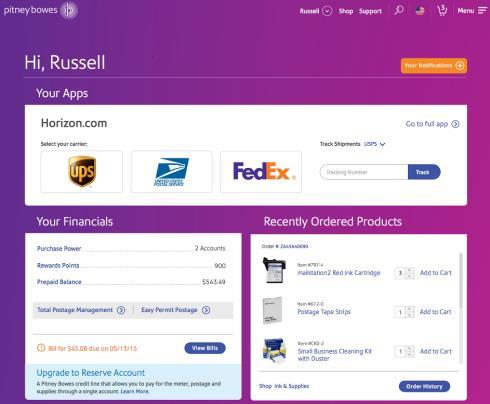


38 Digital Relationships are Dramatically Improving the Client Experience Pitney Bowes Commerce Cloud 38


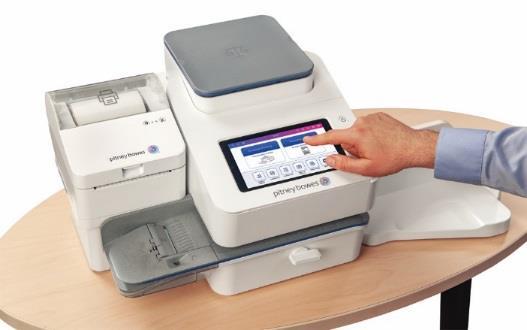
39 Delivering Additional Value with the SendPro Family of Products SendPro SaaS Shipping Solution Pitney Bowes Commerce Cloud SendPro P-Series SendKit SendPro C-Series 39


40 SMB Partner Program New Ecosystem of SMB Partners 40


41 SMB Shipping Ecosystem Pre-Shipping Post-Shipping Address Management Scheduler Insurance Tracking Customer Support Reporting & Analytics 41
42 Small & Medium Business (SMB) Solutions We are a business with new possibilities, extending our value proposition into shipping We can offer new opportunities to our small and medium business clients through a digitally connected, open platform that leverages partnerships with other innovative companies We have created a dramatically improved client experience and our greatest opportunity is still ahead of us 42
43 Software Solutions


44 We Are a Leading Software & Data Provider 24 out of the top 25 Insurers Uniform Data Specifications Across 250 Geographies 17 out of the top 25 Telecoms 1000s of Data Sets to Understand Customer Segments and Risk 30+ Years of Experience Processing Billions of Names and Addresses 22 out of the top 25 Healthcare Companies 16 out of the top 25 Commercial Banks 44


45 We Are Focusing on a $6B Segment within a $21-23B Addressable Market Opportunity CUSTOMER INFORMATION LOCATION INTELLIGENCE CUSTOMER ENGAGEMENT DATA ~ $5 Billion Focus Market ~ $1 Billion 8% - 10% Long-Term Market Growth Rate 15% - 20% Long-Term Market EBIT Margin 45


46 Software and Data is Leveraging Our Expertise in Addresses and Data Quality and Building on Market Success Leveraging Core Pitney Bowes Decades of Name and Address Expertise Billions of Verified Addresses Data Quality Focusing on our Strategic Portfolio Data Monetization Customer Information Location Intelligence Digital Customer Engagement Growing with Partners Global and Regional Systems Integrators Partners participating in nearly half our new business opportunities 46
47 Pitney Bowes Core: Addresses and Data Quality Location Intelligence Data: Worldwide coverage Helps organizations make decisions with confidence Thousands of data sets to understand customer segments and risk Identify boundaries, demographics, points of interest, streets Addressing and Enrichment Data: Worldwide coverage Premiere data for over 180MM North American addresses Easily enrich customer data with high-value information through the pbkey Contextual location data including demographics, insurance risk, and property attribution Software and Data Marketplace: Improved client experience through modernized digital data delivery Increased revenue through online sales of data products Improved client awareness through on-demand data visualization and exploration New client insights through product usage and client behavior insights 47


48 Our Verified Data is Driving Value Back into Pitney Bowes Global Ecommerce SMB Presort Mail Auto-populate and autovalidate addresses on ecommerce orders Simplify logic to make better customer communication decisions New workflow for return mail solution, and confident addressing to scale delivery Software Portfolio Commerce Cloud CUSTOMER INFORMATION CUSTOMER ENGAGEMENT DATA LOCATION INTELLIGENCE 48
49 Strategic Portfolio: Data We are evolving our data portfolio to link address knowledge to location and digital information in order to connect people, places and things Large Area Information Risk Tax information Nearby Information Neighborhood Age/Income Postal Code Drivetimes Property Information Square footage Year built Address Standardization Location Persona Household Demographic Business Firmographics Addresses Social Network Handles USE CASE: Competitive Pricing Determine PML Reduce Portfolio Exposure Lower Cost Ratios Improved Product Design Enhanced Financial Risk Model Better Rate & Filing Management Flood Risk Crime Risk Postcode Know Your Customer Customer Acquisition, Satisfaction, Retention Customer Insights & Analytics Investigate Fraudulent Claims 49


50 Strategic Portfolio: Customer Information & Location Intelligence Next-gen risk analysis using integrated location intelligence and information management Top 10 Reinsurance Company Analysis of risk exposure based on location International geocoding and data quality capabilities for cross-border comparison Cross-check customer-supplied data Geocoding analysis reduced from 8 hours to 1 hour Visualize client risk exposure through maps Reliable catastrophe modeling and precise risk estimation 50


51 Strategic Portfolio: Customer Engagement Large Motor Insurance Company 84% Viewers who said the video helped them learn about the policy 12% Higher renewal rate among customers who viewed the video 74% Of watchers now feel that Geoffrey Insurance cares for them 20% Increase in net promoter score with new customers 39% Increase in net promoter score with renewal customers 51
52 Evolving our Go-to-Market Strategy through the Channel Partner Identification Partner Recruitment Authorization ACTIVATE Client Engagement Opportunity Generation Co-selling Shift SELL 6 MONTHS 12 MONTHS YEAR 2 YEAR 3 RECRUIT Skills Development Solution Training Relationships TEAM New Client Acquisition Skills Specialization Independent Sales Lift Class of 2018 Class of 2016 Class of
53 We Bring Value to our Partners, our Clients, and Pitney Bowes Benefit to our Partners: Leader in Address Verification Data as a Product Services Opportunity Established Install Base Channel Program Benefit to our Clients: Access to diverse capabilities Support across two organizations Greater opportunity for innovation More quality data offerings Benefit to Pitney Bowes: Access to more markets Broader brand recognition Increase revenue with lower operational costs 53
54 Software Solutions Major focus areas to drive growth: Leveraging Core Pitney Bowes Focusing on Growth Portfolio Winning with Partners 54

55 Global Financial Services

56 GFS Offerings and Strategic Relevance Broad Solution Capability With Critical Relevance to Pitney Bowes Equipment Financing 1 Purchase Enabler: ~85% Equipment Finance Penetration Revolving Lines of Credit 2 Long-Term Client Relationships: 51 Months Avg. term Interest Bearing Bank Accounts + ++ Credit Card Issuer 3 Profitability Enhancer: Revenue EBIT Financed vs. Non-financed Sales Payment Processor 4 Postage Utilization Facilitator: ~75% of postage utilized by PB customers enabled by GFS 56
57 Unique Moment in Time - Opportunity to Grow Compelling Rationale 1 Unique access to large, proprietary small & medium size client base 2 Long standing customer relationships data driven insights 3 Growing customer need for capital 4 Excess Deposit Base capacity to lend 5 Broader portfolio possibilities with expansion of Pitney Bowes product set - Shipping Solutions - Software as a Service - Commerce Cloud - Retail Commerce - Software Solutions 6 Attractive risk adjusted return profile and compelling valuation driver 57
58 Pursuing Smart Adjacencies Launched shipping & parcel finance $5.00 Avg. Revenue Yield with Shipping 10X increase in spend Avg. customer spend with shipping 2.5X mail-only customers $ X mail-only Avg. Cost per Mail Piece Avg. Cost per Parcel Carrier agnostic payment capability 58
59 Shipping Driving a Diverse Monetization Opportunity Postage Spend Profile Examples: Small Consulting Company - $3,200 annual mail postage user Added Shipping Label Financing: - USPS Sender - Send: 12 packages / month - Average: ~$8 / package - Shipping Spend: ~$100 / month - Needed: 14 day terms Parts Retailer - $4,200 annual mail postage user Added Shipping Label Financing: - Multi Carrier Sender - Send: 216 packages / month - Average: $38 / package - Shipping Spend: ~$8,200 / month - Needed: 28 day terms Shipping Impact: $1.2K Annual Spend ~38% Increase in Customer Financing $98K Annual Spend 23X Increase in Customer Financing All delivered customer growth opportunities as we monetize shipping spend 59
 manufacturing equipment Continued Safe & Secure")


60 Opportunity: Third Party Equipment Finance Deposit-based, PB Bank funded financing activity inside our existing small & medium size client base to support customer acquisition of 3 rd party (non-pb) manufacturing equipment Continued Safe & Secure Approach + With Specific Relevance Select / targeted existing U.S. customers With proven credit history PB Bank deposit-based funding Critical use assets / specific collateral types Stable residual values 100% secured and perfected financing Non-competitive PB equipment Asset based underwriting approach Share of Wallet PB relevancy & differentiation Client Growth Capital Client success = PB success Retention Growth Important source of growth capital for small to medium-sized businesses on Main St. USA 60
61 Global Financial Services Facilitate Pitney Bowes capability / go to market Provide client capacity Enable strong fundamentals Create differentiation and competitiveness Deliver above market risk adjusted returns GFS is a core part of the fabric of the PB Value Proposition and a critical Shareholder Value enabler 61
62 Financial Update


63 Active Portfolio Management Combined with Organic Investments Portfolio Actions Sold Management Services Sold Nordic Furniture Sold Canada Digital Imaging Solutions Joint venture with Broadridge to form Inlet Sold Imagitas Acquired Borderfree Acquired Real Time Content Acquired Enroute Acquired Maponics Acquired Newgistics Presort Network Expansion Sold DMT Production Mail and its supporting software Sold SMB direct operations in 6 smaller European countries Organic Investments Expanded Cross-border offerings with ebay SMB go-to-market changes Invested in Global Carrier Services Library New Brand launched EPIC launched Partnered with Amazon Web Services North America Enterprise Business Platform SendPro P-Series & SmartLink launched Creation of Software and Data Marketplace Software Indirect Channel Commerce Cloud SendPro C- Series launched Shipping API platform & offerings Opened 4 new Newgistics facilities; consolidated 2 Launched new SendPro apps 63
64 Investments Position Us to Capitalize on Macroeconomic Trends and Address Clients Changing Needs Investments Macro Trend Client Needs Commerce Services Cross-border expansion Shipping APIs Commerce Cloud Acquisitions Parcel volume growth Ecommerce growth Competition: platforms, marketplaces, brands & retailers Retailers cost competitiveness Logistics, warehousing and returns Simplify global regulations SMB SendPro product family Relay Commerce Cloud Digital Relationship Partners First class mail volumes Parcel volume growth Physical and digital offerings All-in-one mail and parcels Flexible payment offerings Manage costs and cash flow Software Solutions Acquisitions Data Commerce Cloud Indirect Channel Location data and analytics Integrated communications Digital transformation Single view of the client Omni-channel engagement Analytics Master Data Management Third party data 64 64


65 Organic and inorganic investments in the portfolio lead us to the next chapter Reducing the complexity of shipping for our clients 65


66 While remaining focused on Operational Excellence to drive efficiencies and synergies Client Experience Network Efficiency & Scale Expense Optimization & Balance Sheet 66
67 With a Portfolio that is Leveraging Economies of Scale and Economies of Experience to Deliver Greater Value Commerce Services SMB Software Solutions Commerce Cloud Product Innovation Enterprise Business Platform One platform, common processes and policies, integrated client data globally 67


68 With a Portfolio that is Leveraging Economies of Scale and Economies of Experience to Deliver Greater Value Economies of Scale Economies of Experience 68
69 Pitney Bowes Portfolio
70 Reorganized Businesses in a Way that Best Positions Pitney Bowes to Capitalize on Growth Opportunities and Synergies Prior Reporting Structure Current Reporting Structure Digital Commerce Solutions Software Software Solutions Global Ecommerce Small & Medium Business North America Mailing International Mailing Commerce Services Global Ecommerce Presort Services Small & Medium Business North America Mailing International Mailing Enterprise Business Solutions Production Mail Presort Services Software Solutions 70
71 Market Size and Growth Rates Present Opportunity for Continued Growth Addressable Market Size ($B) Long Term Market Growth Rate Long Term Market EBIT Margin % Commerce Services Global Ecommerce Presort Services $18 to $20 $3 to $4 11% to 13% Flat to 2% 10% to 15% 15%+ SMB Mailing Shipping ~$3 ~$1 (4%) to (3%) 3% to 5% 30% to 35% Software Solutions $21 to $23 8% to 10% 15% to 20% 71

72 Financial Profile 72


 +2% +4%")


73 Portfolio is Shifting to Higher Growth Markets Imagitas 2% Production Mail 12% Commerce Services* 21% 2015 SMB 55% Commerce Services* 44% 2018 SMB 46% Commerce Services* 52%-56% Longer Term SMB 34%-38% Software 11% Software 10% Software 9%-11% Market Growth** (1%) +2% +4% to 6% * Commerce Services includes Global Ecommerce and Presort Services for all years; includes Newgistics beginning 4Q 2017 ** Market growth rate based on weighting of portfolio and long-term market growth rates during the stated period Note - Amounts may not sum due to rounding 73


74 Revenue Mix PBI Total Portfolio: Revenue PBI Revenue Longer Term Model Mid single digit growth Longer Term Commerce Services SMB Software Production Mail Organic revenue growth continues; 2018 driven by acquisition and organic Commerce Services growth $3,750 $3,500 Revenue Y/Y% 15% 10% Longer Term Revenue Model by Business $3,250 5% Commerce Services Low double digit growth $3,000 0% SMB Low single digit decline $2,750-5% Software Solutions Mid to high single digit growth $2, * 2018 proforma revenue grew 2% over 2017 * -10% 74

75 PBI Total Portfolio: Gross Margin and Operating Expense Revenue Gross Margin $ Gross Margin % OpEx Margin % Longer Term Model Mid single digit growth Growth Decline Improve $2,000 $1,800 Gross Margin dollars will grow $1,600 driven by revenue growth $1,400 $1,200 $1,500 Gross Margin percent will $1,400 decline due to $1,300 Newgistics acquisition along with the $1,200 portfolio mix $1,100 $1,000 Gross Margin Operating Expense* * Operating Expense includes S,G&A and R&D GM% OpEx% 60% 40% 20% 0% 50% 40% 30% 20% 10% 0% $200MM gross spend reduction Over $150MM recognized in includes 1 quarter of Newgistics OpEx; 2018 includes full year OpEx includes amortization of intangibles related to Borderfree and Newgistics of ~$34MM / annual 75 75
76 PBI Total Portfolio Trajectory Longer Term Model Revenue Gross Margin $ Gross Margin % OpEx Margin % EBIT $ EBIT % Mid single digit growth Growth Decline Improve Low to mid single digit growth Mid teens Shift of portfolio to higher growth markets 76
77 Commerce Services Cross Sell Opportunities, Operational Synergies, Overall Market Expansion and Competitive Offerings will Drive Continued Revenue Growth 100% 75% Cross- Border Ecommerce Marketplace Retail Commerce Services 2018 Longer Term Model 50% Presort Services U.S. Network Revenue $1.54 billion Low double digit growth EBIT $ $41 million Mid teen growth EBIT % 2.7% Low double digit 25% 0% Domestic Ecommerce Profile Newgistics Shipping Solutions Category EBITDA $ $129 million Mid teen growth EBITDA % 8.4% Mid teens Continued investment for growth Margin improvement with scale and efficiencies 77
78 SMB Shipping Products Provide Client Value 100% International 75% 50% 25% 0% North America Profile Recurring Streams* Equipment Category SMB 2018 Longer Term Model Revenue $1.6 billion Low single digit decline EBIT $ $534 million Low single digit decline EBIT % 32.5% 30% to 35% * Recurring Streams include Rentals, Financing, Supplies and Support Services revenues EBIT margin stabilizes on spend reductions and recurring revenue streams 78
79 Software Solutions Indirect Channel Enablement and Data Provide Growth Opportunities 100% Service Data 75% 50% Recurring Streams* Customer Engagement Customer Information Management Software 2018 Longer Term Model Revenue $341 million Mid to high single digit growth EBIT $ $47 million Low double digit growth EBIT % 13.8% Mid teens 25% License Location Intelligence 0% Profile Category * Recurring Streams include SaaS, Maintenance and Subscription revenues Revenue growth will drive profitability 79

80 Pitney Bowes Longer Term Model Reflects Evolving Portfolio Year-to-Year Change % Portfolio Revenue EBIT $ EBIT % Commerce Services 52% to 56% Low double digit growth Mid teen growth Low double digit SMB 34% to 38% Low single digit decline Low single digit decline 30% to 35% Software Solutions 9% to 11% Mid to high single digit growth Low double digit growth Mid teens Pitney Bowes Mid Single Digit Growth Low to Mid Single Digit Growth Mid Teens 80
81 Capital Allocation Strategy
82 Maintain Balanced Capital Allocation Strategy While Supporting Portfolio Transformation Dividends Paid to Stockholders $189MM $152MM $150MM $141MM $139MM 2018 $140MM Share Repurchase $0 $50MM $132MM $197MM $0 $0 Debt Reduced $681MM Reduced $94MM Reduced $278MM Increased $118MM Increased $465MM Reduced $565MM 82
83 Maintaining a Strong Balance Sheet Remains a Priority Total Debt $3.8B $3.2B $3.4B $3.3B $0.3 $1.4 $1.9 $2.5 $2.0 $1.5 $1.4 $1.3 $1.3 ($B) Finance Receivables-Related Debt* Implied Operating Debt PBIH Security * Debt allocated to finance receivables assumes 10:1 debt to equity ratio for 2015; assumes 8:1 debt to equity ratio per change in rating agency methodology 2017 debt levels reflect funding of Newgistics acquisition; 2018 reflects pay down of $565MM 83
84 De-Levering Balance Sheet Through Debt Pay Down Remains a Priority $1,000 Future Debt Maturities* $800 $500 $600 $400 $150 $5 $200 ($MM) $- $250 $300 $300 $600 $400 $400 $500 $36 $ Repaid/ Redeemed Early** Bonds Term Loan * Numbers above exclude term loan principal amortization of $20 million, $50 million and $55 million in 2018, 2019 and 2020, respectively ** In 2018, the Company repaid March 2018 note of $250MM at maturity and early redeemed $300MM of notes due March
85 Free Cash Flow Free Cash Flow $300 Capital Expenditures $400 $300 $200 $100 ($MM) $- $355 $200 $168 $ FCF $355 $318 Common Dividend $139 $140 Available FCF $216 $178 ($MM) ($MM) $100 $- $300 $200 $100 $ Depreciation & Amortization $180 $191 $ Capital Expenditures reflect investments for growth; includes incremental CapEx and D&A related to Newgistics
86 Capital Allocation Investment in Shipping and Related Capabilities Continued Portfolio Evolution Deleverage the Balance Sheet Optimize Shareholder Return 86
87 Pitney Bowes Transformation Portfolio mix is shifting to higher growth areas Growth in profitability Strong free cash flow Balanced capital allocation approach 87


88 A Different Company Logical Adjacency Long Term Value 88
89 Appendix
90 Consolidated Statement of Income (Unaudited, in thousands, except share and per share amounts) Revenue: Equipment sales $ 480,031 $ 476,691 $ 430,450 Supplies 241, , ,304 Software 325, , ,855 Rentals 410, , ,057 Financing 366, , ,778 Support services 329, , ,413 Business services 827,676 1,068,426 1,561,522 Total revenue 2,981,323 3,123,272 3,522,380 Costs and expenses: Cost of equipment sales 203, , ,766 Cost of supplies 65,509 66,302 60,960 Cost of software 96,151 95, ,681 Cost of rentals 74,457 82,703 86,330 Financing interest expense 55,241 50,665 48,857 Cost of support services 166, , ,271 Cost of business services 568, ,052 1,246,084 Selling, general and administrative 1,140,100 1,170,905 1,123,116 Research and development 107, , ,588 Goodwill impairment 148, Restructuring charges and asset impairments, net 60,295 56,223 27,077 Other components of net pension costs 5,276 5,413 22,425 Interest expense, net 88, , ,900 Other expense, net - 3,856 7,964 Total costs and expenses 2,779,534 2,901,357 3,310,019 Income (loss) before income taxes 201, , ,361 Provision (Benefit) for income taxes 106, ,383 Income (loss) from continuing operations 94, , ,978 Loss from discontinued operations, net of tax 17,036 39,978 23,687 Net income (loss) 111, , ,665 Less: Preferred stock dividends attributable to noncontrolling interests 19, Net income (loss) - Pitney Bowes Inc. $ 92,805 $ 261,340 $ 223,665 Amounts attributable to common stockholders: Net income (loss) from continuing operations $ 75,769 $ 221,362 $ 199,978 Loss from discontinued operations, net of tax 17,036 39,978 23,687 Net income (loss) - Pitney Bowes Inc. $ 92,805 $ 261,340 $ 223,665 Basic earnings (loss) per share attributable to common stockholders (1) : Continuing operations $ 0.40 $ 1.19 $ 1.07 Discontinued operations Net income (loss) - Pitney Bowes Inc. $ 0.49 $ 1.40 $ 1.19 Diluted earnings (loss) per share attributable to common stockholders (1) : Continuing operations $ 0.40 $ 1.18 $ 1.06 Discontinued operations Net income (loss) - Pitney Bowes Inc. $ 0.49 $ 1.39 $ 1.19 (1) The sum of the earnings per share amounts may not equal the totals due to rounding. 90
91 Revenue and EBIT Business Segments (Unaudited, in thousands) Revenue Global Ecommerce $ 552,242 $ 1,022,862 Presort Services 497, ,795 Commerce Services 1,050,143 1,538,657 North America Mailing 1,357,405 1,275,023 International Mailing 384, ,843 Small & Medium Business Solutions 1,741,502 1,642,866 Software Solutions 331, ,855 Total Revenue $ 3,123,272 $ 3,522,380 EBIT (1) Global Ecommerce $ (17,899) $ (32,379) Presort Services 97,506 73,768 Commerce Services 79,607 41,389 North America Mailing 498, ,268 International Mailing 48,531 63,820 Small & Medium Business Solutions 547, ,088 Software Solutions 33,818 47,094 Total Segment EBIT 660, ,571 Segment EBITDA Global Ecommerce $ 18,763 $ 28,667 Presort Services 124, ,606 Commerce Services 142, ,273 North America Mailing 563, ,518 International Mailing 67,093 79,962 Small & Medium Business Solutions 630, ,480 Software Solutions 42,796 56,634 Total Segment EBITDA 816, ,387 (1) Segment EBIT excludes interest, taxes, general corporate expenses, restructuring charges and other items, which are not allocated to a particular business segment. 91
92 Reconciliation of reported net income to adjusted earnings Reconciliation of reported net income to adjusted earnings 2017 Net income (loss) - Pitney Bowes Inc. 261, ,665 (Income) loss from discontinued operations, net of tax (39,978) (23,687) Restructuring charges and asset impairments, net 37,248 20,950 Tax legislation (38,774) (34,281) Goodwill impairment - - Impact of divestiture transactions - - Transaction costs 4,052 2,690 Gain on sale of technology (5,605) - Extinguishment of debt 2,375 5,933 Preferred stock redemption - - Acquisition related compensation expense - - Legal settlement - - Pension Settlement - 23,402 Investment divestiture - - Net income, as adjusted 220, ,
93 Reconciliation of reported diluted earnings per share to adjusted diluted earnings per share Reconciliation of reported diluted earnings per share to adjusted diluted earnings per share Diluted earnings (loss) per share $ 1.39 $ 1.19 (Income) loss from discontinued operations, net of tax (0.21) (0.13) Restructuring charges and asset impairments, net Tax legislation (0.21) (0.18) Goodwill impairment - - Impact of divestiture transactions - - Transaction costs Gain on sale of technology (0.03) - Extinguishment of debt Preferred stock redemption - - Acquisition related compensation expense - - Legal settlement - - Pension Settlement Investment divestiture - - Diluted earnings per share, as adjusted (1) $ 1.18 $
94 Reconciliation of reported net cash from operating activities to free cash flow Reconciliation of reported net cash from operating activities to free cash flow Net cash provided by operating activities $ 495,813 $ 392,262 Cash used in (provided by) operating activities - discontinued operations (29,006) 29,103 Net cash provided by operating activities - continuing operations 466, ,365 Capital expenditures (168,097) (191,444) Restructuring payments 37,454 52,974 Reserve account deposits 10,954 21,008 Transaction costs paid 7,396 14,203 Free Cash Flow - continuing operations $ 354,514 $ 318,106 94
95 Thank You