Oversight Reporting: Using Data to Make Practice-Level Decisions
|
|
|
- Christopher Lewis
- 5 years ago
- Views:
Transcription
1 Oversight Reporting: Using Data to Make Practice-Level Decisions Tim Proctor - PCC - tim@pcc.com Jenn Austin - PedsOne - jenn@pedsone.com Betsy Boyce - betsy@pedsone.com Users Conference 2018
2 Quick Brainstorm Which reports and data are most important to your practice? Which areas at your practice require the most oversight?

3 Agenda A glimpse of a couple dozen PCC and Dashboard reports useful for practice oversight Practice session
4 Take-Aways An understanding of specific PCC or Dashboard reports that are important to the health of your practice A recognition of the areas of your practice that need the most oversight and ways you can address those areas Experience running PCC oversight reports yourself, for your own practice
5 Types of Oversight Reporting Operational: Information necessary to oversee routine operations of the practice Strategic: Information related to the long-term growth and ongoing business aspects of the practice May be influenced by external mandates: PCMH, Pay-for-Performance, Meaningful Use guidelines, etc.
6 Routine Billing Oversight Reports
7 Review Charge Posting/Coding PCC dailycheck program Can identify whether providers or billing staff are missing any charges An experienced coder should run this, preferably not the person posting charges

8 Review Daily Charge Posting

9 Review Daily Charge Posting

10 Billing Error Report Also in srs Billing/ Collection Reports as Claim Error Report Identifies all claims with an error or rejected status (from internal PCC claim scrubbing, clearinghouse, or payor)

11 Billing Error Report

12 Claims Never Submitted Identifies all charges posted but not yet submitted on a claim or personal bill Is based on most recent payor responsibility Use date range ending when you last ran personal bills

13 Copay Collection Ratio srs Billing/Collection Reports - Copay Collection Ratio Percentage of expected copays that were collected Technically not collected at TOS but close if you run this each week


14 Visits by Billing Status Use to find all visits not yet billed in EHR Or use to find visits billed in EHR but not posted in Partner.

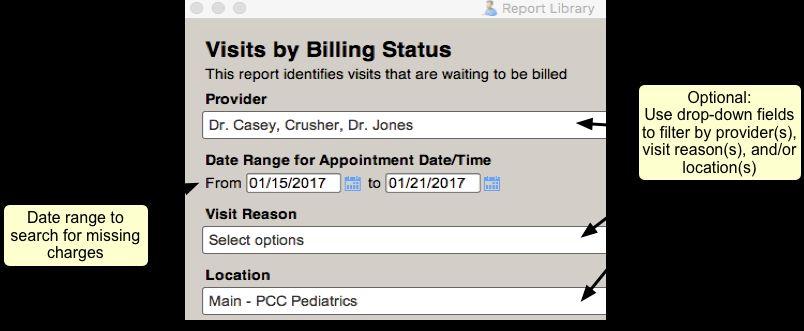

15 Visits by Billing Status

16 Visits by Billing Status
17 A/R Measure A/R Days Also available in Partner - type ardays from a UNIX prompt Approximates the length of time (days) it takes you to collect money that is owed to you Detailed A/R summary available in the Dashboard
18 Other A/R Measures Monitor A/R in each aging category compared to benchmarks Reflects % of total A/R that is specifically days old. A high % here may mean some A/R is approaching timely filing limits.

19 Insurance Aging Summary Monitor % of A/R in each aging category for each insurance group
 Compare % of A/R for each insurance group Monitor total A/R and total credits for the")
20 Insurance Aging Summary Generally most useful to run by Payor Date (date payor became responsible for the A/R) Compare % of A/R for each insurance group Monitor total A/R and total credits for the practice
?")

21 CARC Reporting How often are claims adjusted due to timely filing limits (CARC 29)? Which insurance plans have the most claims going to deductible or some other patient responsibility (CARCs 1, 2, 3, etc)?
22 Productivity Reporting Identify practice or provider productivity in terms of charges, payments, visits, RVUs E&M visit coding New patient volume
23 Four Productivity Report Data Sources # 1 - Daysheet-based reports Based on daily transaction logs of charges, payments, adjustments, and refunds. Best report for reflecting overall charges, payments, and adjustments attributed to a specified time period, by provider if desired. Useful for reconciling to bank account Very limited detail
24 Four Productivity Report Data Sources # 2 - srs Charge-Based Reports Based on PCC's charge database and show charges either transacted during a time period (transaction date) or physically posted into the system during a time period (posting date) Extensive subtotaling capabilities (provider, location, procedure group, etc)
25 Four Productivity Report Data Sources # 2 - srs Charge-Based Reports Also show payments made on the charges being reported Refunds are reflected as charges
26 Four Productivity Report Data Sources # 3 - srs Payment-Based Reports Based on PCC's payment database Useful for getting more detailed subtotals of payments (i.e., payments by check number) Generally recommended to run by transaction date (date attributed to payment by user)
27 Four Productivity Report Data Sources # 4 - srs Visit-Based Reports Based on PCC's charge database Based on transaction (service) date of visit Useful for counting visits and categorizing (sick, well, hospital, etc) Also shows payments made on the visits being reported Extensive subtotaling capabilities (provider, location, etc)

28 Practice Production srs Payment and Proving Out Reports - Daysheet Totals by Posting Month Add up Non service Charges and Service Charges for total charges Add up Cash, Check, and Credit Card for total payments


29 Provider Production Use 'daysheet' report sorted by provider Wide format Totals Only =Yes Omit relinks =No Contact Client Advocate if you prefer 'srs' version of this (useful for exporting to spreadsheet)

30 Provider Total Visits Srs Provider Productivity Reports Total Visits by Provider and Month
31 Include Only 'Revenue' Visits Non-Revenue Services such as no-show or form fees can inflate total visits. If you bill these, restrict the report to include only revenue services Add restriction criteria of VISIT Include Only Revenue Charges. This will report accurate visit totals
 Total Sick, Well, etc visits by")
32 Provider Visit Breakdown Srs Provider Productivity Reports Per-Visit Analysis by Provider (Grouped by Visit Type) Total Sick, Well, etc visits by provider
 Remember to mark appointments as missed (use inquire) Join No Show Reduction discussion Thu")
33 Missed Appointments srs Scheduling Reports - Appointment Totals by Status Missed Appointment Rate = # Missed / (# Total - # Cancelled) Remember to mark appointments as missed (use inquire) Join No Show Reduction discussion Thu 1:15-2:30
34 Missed Appointment Rate Benchmark Measure is included in the Dashboard Based on appointments over the past year and updated each month
35 Dashboard E&M Visit Coding Percentage of all established patient sick visits coded as level 4 or level 5

36 Dashboard E&M Visit Coding Provider breakdown accessible from the E&M Coding Distribution measure detail page
37 Dashboard E&M Visit Coding Choose Date Range E&M Coding Distribution with benchmarks for single or all providers Choose any Provider Print Version

38 # New Patients Added To Practice srs Clinical Reports - New Patients by Visit Type Based on visit codes: , , , , 99463

39 Patient Age Distribution Dashboard Patient Population Monitor total active patient trends for the practice or individual PCPs
40 Clinical Oversight Reporting


41 Phone Encounter Response Time Use this report to track how long it is taking for phone note tasks to be responded to Filter by task type to focus on response to just certain tasks (ie, Doctor s Attention Needed, etc)

42 Phone Encounter Response Time Optionally display user who took phone call, user who completed task, and other information

43 Portal Message Response Time Use this report to track the time between the receipt of the portal message from the patient and the response

44 Vaccine Inventory Reconciliation Use to compare vaccine inventory in PCC EHR vs what you actually have in the fridge Must be using new vaccine inventory features

45 Vaccine Inventory Reconciliation Documentation on PCC's Vaccine Inventory Management Tools


46 Prescription Count by Provider Identify generic vs brand name Rx volume for each provider

47 Orders by Visit Use this to generate a report of any order type generated within a date range

48 Orders by Visit Can show referrals, screenings, medical procedures, radiology, labs ordered with associated tasks
49 Strategic Oversight Reporting
50 Measures that relate to goal of Healthy Practice Dashboard Financial Pulse Revenue-per-Visit Revenue-per-CPT Pricing

51 Financial Pulse

52 The Dashboard directs you to the areas at your practice that may need extra attention
53 Revenue Analysis Why do it? Find out if you could be doing better Recognize trends in practice revenue Am I suddenly getting paid more or less than I used to? Homework for insurance negotiations
54 Revenue-per-Visit Measure of average dollars collected per patient visit. Revenue includes both insurance and personal payments (such as copays and deductibles.) Dashboard provides comparison with and without immunizations

55 Revenue-per-Visit by Payor srs Visit Reports Per Visit Analysis By Payor ('activity' style) Press <F8> to add restriction criteria of VISIT Amount Due for Visit and specify $0 to $0. This ensures you are only looking at paid visits.

56 Include Only 'Revenue' Visits Non-Revenue Services such as no-show or form fees can inflate total visits. If you bill these, restrict the report to include only revenue services Add restriction criteria of VISIT Include Only Revenue Charges. This will report accurate visit totals

57 Revenue-per-Visit by Payor Compare AVG Deposited Per Visit among payors. Which are your best and worst payors?

58 Payment Analysis by CPT Code srs Charge Reports Reimbursement Analysis by CPT Code When prompted, select your most common procedure groups Press <F8> to add restriction criteria of CHARGE Amount Due for Visit and specify $0 to $0. This ensures you are only looking at paid charges.

59 Are any insurance companies paying you at or near your charge amount? If so, it's time to raise prices!
60 Your Pricing Level Measure of your average pricing as a percentage of the current Medicare value A low percentage means that you are likely undercharging for your work srs RVU Reports Pricing Analysis report will show you which procedures you are undercharging for

61 Pricing Analysis Report Underbilled Amount = How much you have undercharged for the procedure.
62 Pricing Analysis Report Quickly eyeball the Underbilled Amount column to identify procedures for which you may be undercharging High negative numbers in this column indicate more drastic undercharging. Positive numbers or $0 indicate a sufficient price based on the level you chose
63 Measures that relate to goal of Healthy Patients Percentage of patients up-to-date on well visits Percentage of ADD/ADHD patients up-to-date on followup visit Percentage of patients up-to-date on immunizations Percentage of patients up-to-date on developmental screenings

64 Clinical Pulse
65 % of Patients Up-to-Date on Well Visits Indicator of recall effort and preventive care focus at your practice Only active patients (seen in past three years) are counted Patients with Inactive flags (on patient or account record) are omitted Low % of patients up-to-date indicates opportunity for more well visits Listing of overdue patients is also available in the Dashboard
 If the last question, Exclude these patients from reports is set to Yes, then patients with these flags are")
66 Inactive Flags Review your patient and account flag tables (#12 and #13 in ted.) If the last question, Exclude these patients from reports is set to Yes, then patients with these flags are excluded from Dashboard clinical measures

67 % of Patients Up-to-Date on Well Visits
68 % of Patients Up-to-Date on Well Visits


69 % of Patients Up-to-Date on Well Visits See breakdown of well visit rates by insurance or primary care provider Compare these results with your payor-reported performance
 Patients with Inactive flags (on patient or guarantor record) are")
70 Immunization Rates Immunization Rates Patients 2 Years Old (based on HEDIS measure) Patients with Inactive flags (on patient or guarantor record) are omitted

71 Childhood Immunization Rates

72 HPV Immunization Rates Based on new HPV series guidelines Two measures: Patients 13 years and years
73 Developmental Screening Rates Includes measure for active adolescents getting depression screening in past year or infants getting developmental screening between 6-12 months of age Based on billing codes (96127, 96110, G0444, or for adolescents) (96110, G0444, or for infants) Includes breakdown by provider (PCP)
74 Practice Session Identify 3 areas at your practice where you feel there is need for more oversight. What initiatives can you take to improve on those areas? Guided exercises Thank you! tim@pcc.com