Boosting process analytics at RHI Magnesita PI and Visual Computing
|
|
|
- Domenic Watson
- 5 years ago
- Views:
Transcription

1 Boosting process analytics at RHI Magnesita PI and Visual Computing Thomas REITERER, RHI Magnesita Harald PIRINGER, VRVis GmbH 1

2 RHI Magnesita at a glace 14,000 Employees spread over 40 countries 2.7bn 10, pro-forma Customers revenue served globally 35 Main production sites across 16 countries 180 Countries shipped Worldwide 10 Main raw material sites in 4 continents 37m Annual investment in Research 2
3 3
4 For what we use PI data? Track, analyze and understand current and historical process information and support the production process Availability of process data in real-time and historically Access to process data via the network and mobile Tool for production excellence (reporting, optimization projects, maintenance, quality, ) Additional data source for: Predictive Maintenance with SAP PM Operation-Reports in Microsoft BI 4 OEE Reporting
 Synchronization the data from China to Vienna (")
5 RHI Magnesita Key figures 26 connected plants, > 450 connected main machines, ~ PI-tags, One PI-Server in Vienna and one Dalian (CN) Synchronization the data from China to Vienna ( PI PI interface )
6 Key to our success: support structure Global & standardized central IT IT System Administration system devices licenses Installation guidelines Tag Administration Tag selection Tag configuration Calculated Tags Notifications OT PI Application Trainings Support Roll-Out Improvements System Administration Ensuring PI operation, Tag Administration Providing data PI Application Key User local Monitoring trouble shooting Tag selection support for local users sharing information system documentation contact central support 6


7 RHI Magnesita let s boost VISPLORE PI Vision PI Integrator PI AF PI AF PI Notification PI UFL PI ML PI ProcessBook PI DataLink Prototype First Applications Standard Applications Advanced Applications BOOST


8 PI Tools - ProcessBook The truth is visible in Process Book always have a look on real trend of data Basis for all other analysis (quick check, tag selection, corrections and outliers) Timeline of process data 8 SCADA - background Expert tools (e.g.: SQC)


9 PI Tools - DataLink Fast and powerful application of process data Interface to other standard analyzing tools Timeline of process data 9 Excel-Reports Expert Tools (Statistics, Visual 2018 Computing) OSIsoft, LLC
 AF-structure 10")
10 PI Tools AF-Structure & PI Vision Much easier tag-search Standardization (names, KPIs, structure, ) AF-structure 10 Notifications PI Vision


11 Example of standard application One original PLC-tag calculated tags Notification Excel Report 11

12 Example of standard application Longtime - perspective Measures taken by the plant Clear improvement 12


 13")

 Outliers")
13 Example of standard application Live trend in Process Book Calculated tags show the actual situation Statistics (Excel functionality) 13 Improved Visualisation in PI Vision What s about: Advanced statistics (per categories) Outliers Benchmarking Longtime

14 Visual Computing enlighten the data What have these data series in common? Human intuition and creativity are essential 14
15 Visual Computing speed up the analysis Ask the expert and you will here it takes time 15 Intelligent interfaces and programs easy to use Time for analysis Quantity of data Quality of data Number of KPI

16 Example of Visual Computing Longtime - statistics and benchmarking 16

17 Example of Visual Computing Comparison of categories 17
18 Example of Visual Computing Longtime - Batch comparison 18

19 Example of Visual Computing Complex correlation analysis 19

20 Competence in Visual Analytics Austria s leading center for Visual Computing Focus: joint R+D projects with the industry ~ 70 employees 20


21 Our goal: Empowering YOU for Enhancement by comprehensive knowledge of your process data Process optimization Fault detection Predictive models 21
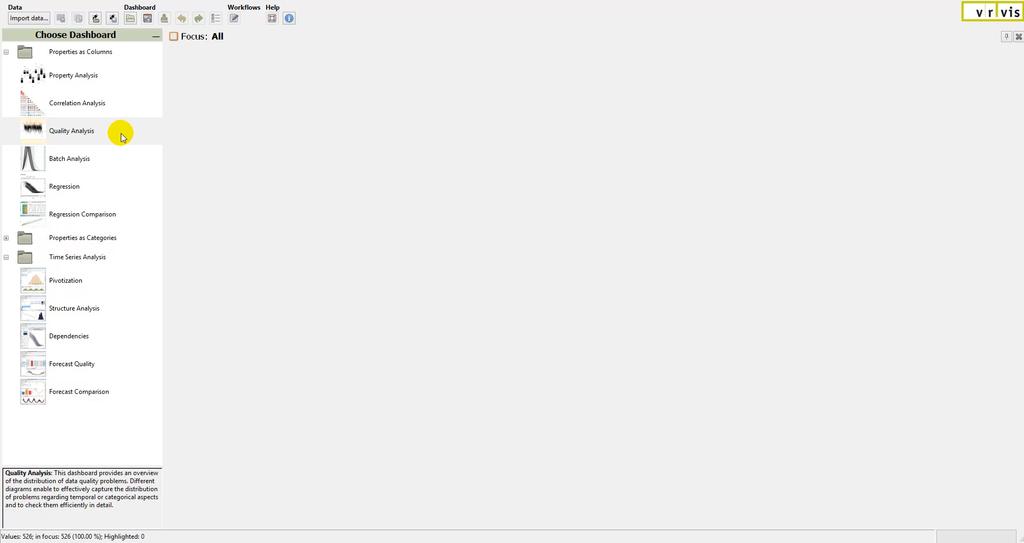
22 Visplore: Software for process data analytics Analytical visual tool suite for process experts, R&D engineers, data scientists Deeper than BI, simpler than statistics software Easy: pre-configured, task-tailored, linked views Efficient: from overview to details in milliseconds Dynamic: Delay-free feedback for millions of values Flexible: Comprehensive export and scripting options 22
23 Use Case Example: Batch Production Compare process parameter of batches from four plants Trace trends of user-defined KPIs per batch 23
24 24

25 Use Cases: Data Quality Find gaps and data quality problems Cleanse time series 25
26 Use Cases: Model Quality Discover correlations between sensors Identify dependencies and model sensitivities Optimize automated checks for fault detection 26
 Recognize the distribution of faults and")
27 Use Cases: Process Quality Discover anomalies and understand their root cause Compare recurrent patterns (batches, machinery health) Recognize the distribution of faults and alerts 27

28 Use Cases: Reporting Define summaries and pivot tables Copy&paste to Excel or other tools 28
29 Benefits Save time of experts for data exploration and preparation Identify unexpected opportunities for improvement Improve models and fault detection Simplify communication and training 29
30 Visplore: Status Pre-product phase RHI Magnesita early adopter and application partner Planned go to market Q2/2019 PI System integration development in progress Efficient searching and loading of data from PI System OSIsoft partnership approval process in progress 30

31 Data Flow PIMS / BI / VISPLORE 2018 also PI Excel and BI with PI Intregator 31


32 RHI Magnesita Boosting process analytics with PI and Visual Computing CHALLENGE Full potential of process data is not exploited because too timeconsuming and too complicated SOLUTION Tools for process experts and data scientists - combine human intuition with data & algorithms RESULTS Save expert time, increase data usage, find potentials for optimization Where to look at? >450 main equipment in PI Structured analysis Process expert or data scientist Central analysis & reports Missing tool between BI and Statistic Program central initiative New OSISoft - tools like PI Integrator and PI Vision Innovative ways for analyzing and reports: BI and VISPLORE Advanced analytics for everyone Higher process stability Optimization of processes (e.g.: energy reduction in a plant of /a) 32


33 Contacts Thomas REITERER Head of R&D Processtechnology RHI MAGNESITA Harald PIRINGER Head of Visual Analysis Group VRVis GmbH 33


34 Questions? Please wait for the microphone State your name & company Please rate this session in the mobile app! Search OSIsoft in your app store 34
35 35