Gabriel India Ltd Result Update Presentation
|
|
|
- Clare Skinner
- 5 years ago
- Views:
Transcription

1 Customer Relationships Quality Research & Development Successful Growth Gabriel India Ltd Result Update Presentation Q1FY19
2 Safe Harbour This presentation and the accompanying slides (the Presentation ), has been prepared by Gabriel India Limited (the Company ), solely for information purposes and do not constitute any offer, recommendation or invitation to purchase or subscribe for any securities, and shall not form the basis or be relied on in connection with any contract or binding commitment whatsoever. No offering of securities of the Company will be made except by means of a statutory offering document containing detailed information about the Company. This Presentation has been prepared by the Company based on information and data which the Company considers reliable, but the Company makes no representation or warranty, express or implied, whatsoever, and no reliance shall be placed on, the truth, accuracy, completeness, fairness and reasonableness of the contents of this Presentation. This Presentation may not be all inclusive and may not contain all of the information that you may consider material. Any liability in respect of the contents of, or any omission from, this Presentation is expressly excluded. Certain matters discussed in this Presentation may contain statements regarding the Company s market opportunity and business prospects that are individually and collectively forward-looking statements. Such forward-looking statements are not guarantees of future performance and are subject to known and unknown risks, uncertainties and assumptions that are difficult to predict. These risks and uncertainties include, but are not limited to, the performance of the Indian economy and of the economies of various international markets, the performance of the auto ancilliary industry in India and world-wide, competition, the company s ability to successfully implement its strategy, the Company s future levels of growth and expansion, technological implementation, changes and advancements, changes in revenue, income or cash flows, the Company s market preferences and its exposure to market risks, as well as other risks. The Company s actual results, levels of activity, performance or achievements could differ materially and adversely from results expressed in or implied by this Presentation. The Company assumes no obligation to update any forward-looking information contained in this Presentation. Any forward-looking statements and projections made by third parties included in this Presentation are not adopted by the Company and the Company is not responsible for such third party statements and projections. 2
 % on Y-o-Y basis 4,176 +23% 5,146 390 +26% 490 Key Highlights Q1FY18 Q1FY19 Q1FY18 Q1FY19 Revenue: Revenue led by Higher Volumes across all the segments PBT +31% PAT +31% PAT: Improved")
3 Financial Highlights Q1FY19 v/s Q1FY18 Revenue EBITDA (Rs. Mn) % on Y-o-Y basis 4, % 5, % 490 Key Highlights Q1FY18 Q1FY19 Q1FY18 Q1FY19 Revenue: Revenue led by Higher Volumes across all the segments PBT +31% PAT +31% PAT: Improved profitability due to control of expenses Q1FY18 Q1FY19 Q1FY18 Q1FY19 Note: Q1FY19 compared with Q1FY18 as per INDAS 3
4 Financial Highlights Q1FY19 v/s Q4FY18 (Rs. Mn) % on Q-o-Q basis Revenue EBITDA % PAT 5, % 9.5% % % % 5.2% EBITDA PBT PAT % Note: Q1FY19 compared with Q4FY18 as per INDAS 4
5 Revenue Mix Segment Mix Channel Mix 11% 11% 13% 13% 15% 100% 100% 100% 100% 4% 4% 4% 4% 3% 11% 13% 13% 11% 11% 26% 31% 32% 31% 27% 86% 83% 83% 85% 86% 63% 58% 55% 56% 58% FY15 FY16 FY17 FY18 Q1 FY19 FY15 FY16 FY17 FY18 Q1 FY19 2W/3W Passenger Vehicles Commercial Vehicles Note: FY17,FY18 & Q1FY19 data are as per INDAS OE Replacement Export 5
6 Profit and Loss Highlights Rs. Mn Q1FY19 % of Revenue Q1FY18 % of Revenue Y-o-Y% Q4FY18 % of Revenue Q-o-Q% FY18 % of Revenue Revenue (net of excise duty) 5, % 4, % 23.2% 4, % 3.6% 18, % Raw Material 3, % 2, % 3, % 13, % Employee Expenses % % % 1, % Other Expenses % % % % EBITDA % % 25.6% % 5.4% 1, % Other Income % % % % Interest 8 0.1% 7 0.2% 7 0.1% % Depreciation % % % % PBT % % 30.9% % 5.7% 1, % Exceptional Items 0 PBT After Exceptional Items % % 30.9% % 5.7% 1, % Tax % % % % PAT % % 30.9% % 4.1% % Other Comprehensive Income Total Comprehensive Income % % 10.5% % -10.9% % Cash PAT % % 24.1% % 2.6% 1, % Data are as per INDAS 6
7 Quarterly Performance Trend Revenue EBITDA PAT 18,331 1, Q4 Q3 Q2 14,355 3,457 3,576 3,828 13,941 3,634 3,528 3,739 15,206 3,882 3,721 3,919 4,968 4,471 4, , , , Q4 Q3 Q Q1 3,494 3,040 3,684 4,176 5, Q FY15 FY16 FY17 FY18 FY19 FY15 FY16 FY17 FY18 FY19 FY15 FY16 FY17 FY18 FY19 9.3% 9.6% 9.0% 9.4% 9.5% 4.9% 5.6% 4.8% 5.2% 5.2% Q1FY18 Q2FY18 Q3FY18 Q4FY18 Q1FY19 EBITDA PAT Note: FY17,FY18 & Q1FY19 data are as per INDAS 7 (Rs.Mn)
8 Key Business Updates Ranked among Top 100 Companies to work for in India (4th time in row) & best companies to work for in Auto Component Industry CRISIL Long term ratings : Long Term Rating : Improved from AA - to AA with Stable Outlook Fixed Deposit Rating : Improved from FAA to FAA+ with Stable Outlook Anand Management fee increased to 2% from 1.5 %, incorporated in Q1FY19 results This slide is 100% editable. Adapt it to your needs and capture your audience's attention. Won a Key business Y1K from Maruti Suzuki for Passenger Car Business Unit (PCBU) New Assembly Facility Inaugurated at Hosur to serve TVS Motors 8

9 Sustainability Award Mahindra Gabriel India awarded with Sustainability Award Automotive and Farm Division from Mahindra for our outstanding efforts in FY18

10 Gold Quality Award Bajaj Auto Gabriel Aurangabad Team won Gold Quality Award from Bajaj Auto for the third time in a row
 & best")


11 4th year consecutively : GREAT PLACE TO WORK 2018 Ranked among Top 100 Companies to work for in India (4 th time in row) & best companies to work for in Auto Component Industry 2017 Ranked among Top 100 Companies to work for in India 2016 Gabriel India Ranked #3 in Auto Component Industry Rank #70 among Top 100 Companies to work for in India 2015 Gabriel India Ranked #2 in Auto Component Industry Rank #43 among Top 50 Companies to work for in India 2012 Gabriel India Ranked #3 in Auto Component Industry Recognized among the Best Companies in its Industry


12 Events Annual Vendor Meet UDAAN 2018 Visit of Mr M. Shitara - Chairman & MD, India Yamaha Motors 'Certificate Of Appreciation' for Business Excellence through Learning & Development in BML Munjal Awards 2018 by Hero Enterprise

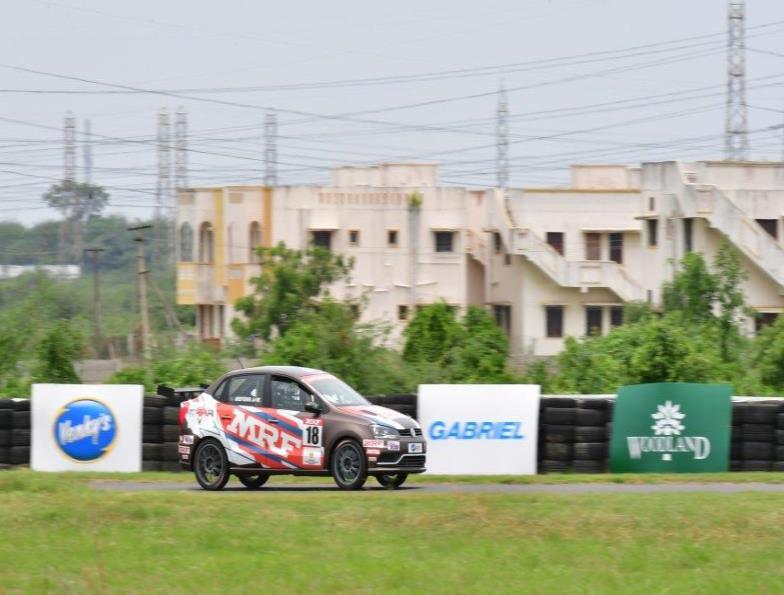

13 Branding Initiatives VW Ameo Cup 2018 Suzuki Gixxer Cup
14 Business Overview 14


15 Company at a Glance Incorporated Experienced & Professional Management The company, Gabriel India, in 1961 Pioneers of Shock Absorber manufacturing in India Innovation Strong R&D with over 58 patents filed in Products & Processes Strategically Located Strong manufacturing Capabilities built across India Only Player Present in all Segment 2/3 Wheelers, Passenger Cars and Commercial Vehicles with diversified OEM Base Significant Presence in all channels of sales OE, Aftermarket and Exports Received the Golden Peacock Eco Innovation Award in the year 2012 No OEM accounts for more than 20% of sales Ranked as a Great Place to Work in Auto Component Industry for last four years consistently 15

16 Pioneer of Ride Control Products 2/3 Wheeler Passenger Car CV & Railways Front Forks Cartridges Shock Absorbers Hydraulic Shock Absorbers Gas Shock Absorbers Cabin Dampers Gas Shock Absorbers McPherson Struts Seat Dampers After Market across all segments 16
 Segment Mix: FY18 18,331 2/3 Wheelers 58%")


17 with Diversified Revenue Revenue (Rs. Mn) Segment Mix: FY18 18,331 2/3 Wheelers 58% ,355 14,305 15,206 Commercial Vehicles 15% Passenger cars 27% Channel Mix: FY18 5,146 OE 86% Aftermarket 11% FY13 FY14 FY15 FY16 FY17 FY18 Q1FY19 Note: FY17,FY18 & Q1FY19 data are as per INDAS Exports 3% 17
18 Strategic Manufacturing Footprint Ashok Leyland Honda Cars Honda Motorcycles ICML Maruti Suzuki Suzuki Motorcycles SML Isuzu Tata Motors TVS Motors Yamaha India Manesar Parwanoo Khandsa GIL Presence GIL Plants GIL Satellite Locations AMW GM Tata Motors Honda Motorcycles Sanand Dewas Hindustan Motors Tata Motors Bajaj Auto GM Force Motors FIAT Mahindra Mahindra Trucks & Buses MAN Trucks Piaggio Skoda Volkswagen Volvo Eicher Pune Kumbalgodu Nashik Aurangabad Malur Hosur Ashok Leyland Bharat Benz Hindustan Motors Hyundai Royal Enfield Tata Motors Toyota Kirloskar TVS Motors *Maps not to scale. All data, information, and maps are provided "as is" without warranty or any representation of accuracy, timeliness or completeness. 18

19 Strategy Going Ahead 19


20 Strategic Business Unit Approach 2/3 Wheeler Quality & Process Technology Capacity Enhancement 01 Passenger Car Product Innovation Improving Market Share CV & Railways Product Technology New Product Devolvement Aftermarket Product Development Expanding Reach To derive benefits from Customer & Product Focus, Export Push and After market expansion 20


21 No OEM accounting for >20% of Sales 2/3 Wheeler Passenger Car CV & Railways 21
22 Key Drivers for Growth Exports Focus Inorganic Growth Global Manufacturing Footprint Sales Growth Customer Focus Debt Reduction Break Even Point (BEP) Reduction Simplification of Parts Efficiency Improvement Technology & Innovation Improvement in quality Automation R & D Focus. Sustainable Manufacturing Innovation Culture 22
23 For further information, please contact: Company : Investor Relations Advisors : Gabriel India Ltd. CIN : L34101PN1961PLC Mr. Rajendran Arunachalam rajendran.arunachalam@gabriel.co.in Strategic Growth Advisors Pvt. Ltd. CIN : U74140MH2010PTC Mr. Jigar Kavaiya / Ms. Neha Shroff jigar.kavaiya@sgapl.net / neha.shroff@sgapl.net /