Using GIS to Prioritise Capital Investment for Water Main Renewals
|
|
|
- Erica Jackson
- 5 years ago
- Views:
Transcription

1 1 Using GIS to Prioritise Capital Investment for Water Main Renewals Presentation to the 2014 ESRI International User Conference (Jim Carlson-Jones, SA Water)

2 Presentation Outline SA Water Overview Asset Management Context SA Water Capital Plan Background SA Water Asset Information Framework Water Main Data Fundamentals Automated Valuation System Water Main Renewal Planning Models Key Performance Indicators Closing 2


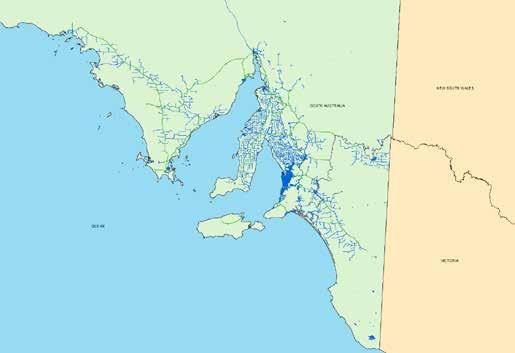
3 SA Water Overview Vision to deliver safe, sustainable and affordable water services for the community. Serving 1.5million residents 1500 employees $430 million capital expenditure 3

4 4
5 5
6 6
")
7 SA Water Infrastructure Assets (at 30 June 2013) 7

8 Key Asset Management Concepts 8
")


9 Optimised Life Cycle Decision Making (OLDM) Assets + Information + OLDM = Plans Capital Plan Risk LCC LoS Maintenance Plan Operating Plan

10 RBP2016 Capital Plan Asset Categorisation (Water) 10
")
11 Asset Programs Mapped to Strategic Key Performance Outcomes (Water) 11

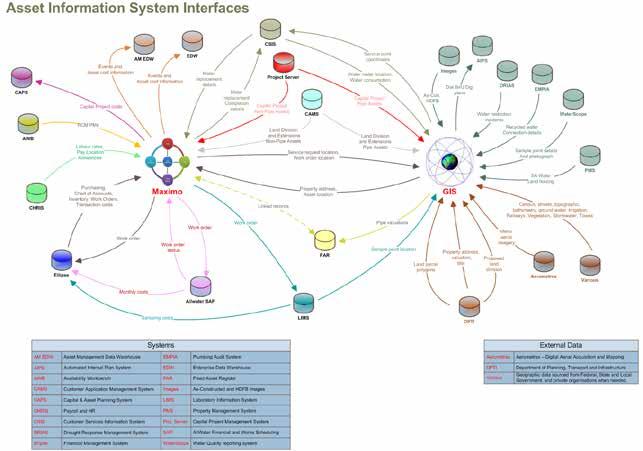
12 Asset Information Framework Asset Knowledge Standards Asset Information Systems Asset Data and Knowledge Asset Information Strategy Tuesday, 8 July 2014 Page 12


13 Asset Information Systems GIS Maximo Fixed Asset Register Enterprise Data Warehouse (EDW) River (SharePoint)
14 14
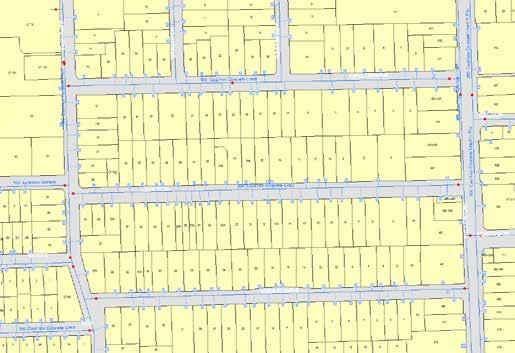
15 Some Fundamentals 15
16 Some Fundamentals 16
17 Some Fundamentals 17
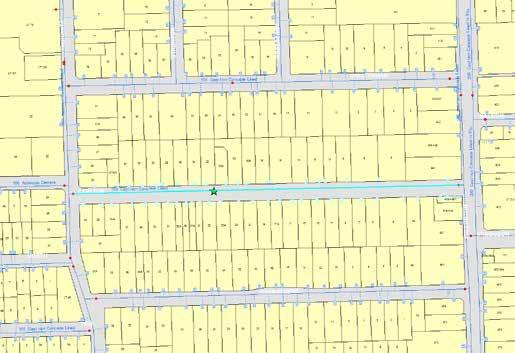
18 Some Fundamentals 18
19 Some Fundamentals 19

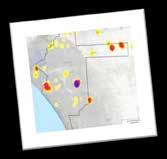
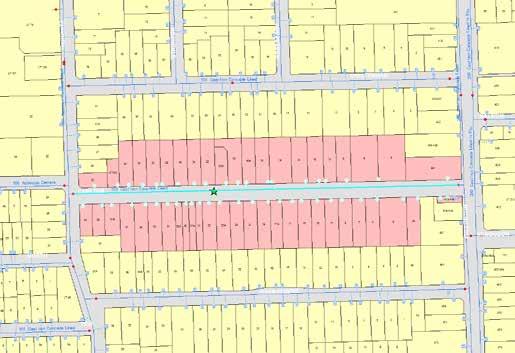
20 Poor Performing ShutOff Blocks 20

21 Poor Performing ShutOff Blocks 21

22 Automated Valuation System Calculates & Assigns: Gross Replacement Value Written Down Value Age Remaining Life Infrastructure Zones.and many other attributes For each pipe segment Approx. 1,000,000 segments 22
23 23
24 Reticulation Water Main Asset Renewals Background Two complementary models are in use In each case, a level of annual investment in pipe renewal is predicted over a set planning period. A Water Main Prioritisation Tool is then applied using actual failure performance to determine which mains should be prioritised for replacement. Tuesday, 8 July 2014 Page 24
25 Reticulation Water Mains - Tactical Asset Management Nessie and PARMS long term modelling - target length (and $) proposed from year to year Water Main Prioritisation Tool (WMPT) - water mains ranked in terms of priority for replacement. Problematic locations are identified using the GIS and Maximo WMS data. These locations are scrutinised in more detail to optimise the length to be replaced. Tuesday, 8 July 2014 Page 25

26 NESSIE - Water 26
27 Pipeline Asset Risk Management System (PARMS) CSIRO software known as PARMS (Pipeline Asset Risk Management System) has been brought up to modern computer language through WSAA Asset Management Project PPS10 Water Main Renewal Planning. PARMS enables various long term expenditures to be modelled and assess impact on failure rates PARMS used for long term renewal forecasts and identification of short term priorities to justify expenditure to the regulator using best practice software. 27
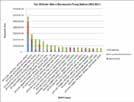
28 Reticulation Water Main Assets PARMS Forecast v Actuals 25 Metro Length of Water Main Replacements to Maintain Constant Failure Rate (Indicative Only) Regional Length of Water Main Replacements to Maintain Constant Failure Rate (Indicative Only) Annual Length Replaced (km) Annual Length Replaced (km) PARMS Estimated Length to Keep Failure Rates Constant (km) Actual Lengths Replaced (km) PARMS Estimated Length to Keep Failure Rates Constant (km) Actual Lengths Replaced (km) Tuesday, 8 July 2014 Page 28
29 Reticulation Water Mains - Tactical Asset Management Water mains are identified for WMPT scoring via 2 primary methods: Shutoff block reporting: Spatially joins water main failures to pipes; count of number of failures by a shutoff block; any shutoffblock with >= 3 failures in a rolling 12 month period are considered Maximo burst reports: Count of number of failures by Maximo location WMPT scoring ranks these mains until the annual target length of WMR is reached. The higher the WMPT score, the higher the priority for replacement. Tuesday, 8 July 2014 Page 29

30 Reticulation Water Mains - Tactical Asset Management Tuesday, 8 July 2014 Page 30
31 Water Main Performance - Adelaide y = x x x x R² = Monthly Water Main Failure Rates Average (past 11 years) Poly. (Average (past 11 years)) Number of Failures Jul Aug Sept Oct Nov Dec Jan Feb Mar Apr May Jun Month Tuesday, 8 July 2014 Page 31
32 Water Main Performance - Adelaide Drought Tuesday, 8 July 2014 Page 32

33 Corporate KPI Water Network 33
34 Water Main Performance - Adelaide Tuesday, 8 July 2014 Page 34

35 Closing 35

36 My Contact Details Jim Carlson-Jones Manager, Asset Information South Australian Water Corporation 36