Aligning financial services IT to the business through the use of dashboards
|
|
|
- Austin White
- 5 years ago
- Views:
Transcription


1 Aligning financial services IT to the business through the use of dashboards Respond to Ever-Increasing Regulatory, Performance, and Market Demands Samarendra Raiguru 2008 IBM Corporation
2 Financial Services: Fundamental Business Challenges Customer Satisfaction Customer Acquisition, Retention & Expansion Regulatory & Compliance Requirements Competitive Pressures of Globalization & Consolidation Most firms are standing at a crossroad. Financial institutions and insurance firms are mired by inflexibility legacy applications, processes, and channel infrastructure that are unable to adequately respond to ever-increasing regulatory, performance, and market demands. Maggie Scarborough, Research Manager - Corporate Banking Financial Insights An IDC Company Legacy Modernization in Banking and Insurance: The Road to Performance October 2005

3 Financial Services Executives Agree: Drive for Performance Improvement Comes from the Top
4 Effective Performance Management Requires: Corporate Vision & Strategy Identifiable metrics derived from strategies Alignment & cascading of strategies/metrics to employees Tools to measure progress, collaborate & take action If you want to teach people a new way of thinking, don't bother trying to teach them. Instead, give them a tool, the use of which will lead to new ways of thinking. Buckminster Fuller Inventor, Futurist

5 Performance Management Market Priorities are Shifting Focus to Dashboards and Scorecards AMR Research Reports Performance Management Spending Will Near $23B in
6 IBM Software Lab Dashboard- Are they all different? Business analytics Business intelligence Analytic applications Business performance management Data warehousing Enterprise reporting Data Mining Dashboards Management Reporting KPIs Scorecards OLAP Reporting
7 IBM Software Lab Reporting Landscape Strategic Operational

8 IBM Software Lab Operational vs. Strategic Strategic Geared toward business analysts Trend analysis Highly integrated data OLAP multi-dimensional analysis Data latency acceptable Discovery of business trends Tens of users Tactical Geared toward middle management Connect to data marts & transaction systems Actuals vs. forecast Operational Geared toward individual contributors Call-center cross-sell Metric based management by exception Real-time data requirements Monitoring business process as they occur Management by exception Thousands of users
9 IBM Software Lab Dashboard Foundation Approach On Demand Integrated Analytics Data Warehousing Information on Demand Information for the masses Actionable Embedded Extended Enterprise Analysis Cross Value Chain Information Advanced Analytics Integrated Performance Management Aggregated Information Access Integrated Consistent Transactions Transaction Data Granular Operational

10 What is a Portal = Single User Experience Role Based CRM Teller Personalization Content Management Customization Security Collaboration Navigation ehr Syndicated Rates Integration at the Glass Single Sign On Claims

11 IBM Dashboard Framework Brokerage Third Party products Liability products DB App MIS CRM DB App DB App DB CRM DB App DB App MIS CRM DB App ETL Extract WebSphere Information Server Analysis WebSphere & Portal Modelling Server Cube Engine IFW Scorecards DB2 Alphablox LDM Congnos Data store Mgmt dashboard Scorecards Asset products Advisory Services DB CRM DB CRM App DB App DB DB App MIS App Cleanse, Standardize, Load Lotus Presentation Active Insight DB2 DWE Ops dashboard IBM Change Real Data time Capture Integration (Data Mirror Acquisition) OTHER SYSTEMS R&C Fin Mktg Channel Port. Mgmt BPMS Doc Mgmt


12 Financial Services Executives Need Real-Time Information from Across the Enterprise to Improve Performance Building the capability to be able to consolidate and report data beyond compliance demands by regulatory authorities is likely to be a key differentiator between winners and followers by 2010 internal controls should be integrated into the overall management dashboard to bring greater clarity to performance and risk management. 1 Source: Economist Intelligence Unit Survey Results Business 2010: Financial services Embracing the challenge of change April Deloitte Financial Services in 2010: Hallmarks for Success


13 Performance Dashboards properly implemented provide a valuable tool for executives to improve their decision-making and business execution Alert s Data Filters Hi-Fidelity Charts Drill Downs Utilities (Export, Print)
14 The IBM Performance Dashboard Solution The most effective way to link corporate objectives with relevant business information Drive Alignment around a common, visible set of performance goals Automate today s manual or resource-intensive processes with personalized, graphical UI tailored to each job role Access performance information wherever it resides with integrated, real-time views Take Action Intuitive views enable proactive response to issues via WebSphere Portal s rich collaboration and workflow integration Cut Costs using rapid assembly tools that dramatically cut the time, cost and skills required to build dashboards


15 Drive Alignment and Accountability Graphical UI instantly shows areas that need attention Shows dependencies and potential performance gaps Clarifies goals, targets and measures for an organization and the individual Assigns concrete, measurable targets at all levels of an organization


16 Link Real-time Key Performance Metrics to an Organization s Goals and Objectives Drill down for additional insight and information about an objective Status Map Dashboard Drill Down


17 Automate Manual Processes with Customized and Secure Role-Based Views Division Manager Alerts personalized Regional Manager Data filter adapts Branch Manager Graph displays revenue for selected office Scorecard shows regional info only Scorecard shows office info only


18 Access Information Wherever it Resides Based on an Open Standards, Services Oriented Architecture Web Service SAP SAP, Siebel Pre-built extensions help organizations leverage data and processes from diverse systems and sources Real-time, integrated views display in a context the end can easily respond to Use one data service to drive display of multiple portlets Domino Siebel Deliver SOA-based, composite views dynamically without additional coding! Reuse existing assets Reuse same UI with different data services


19 Dashboard KPI Catalog No Charge Financial Services KPIs! Banking/Lending KPIs Loan Portfolio Distribution by Geography Processing Costs By Geography IT costs FTE costs At Risk Internal Processing Issues Loan Revenue Net Charge Offs Loan Count Non-performing loans Average Transaction Size Loan Type Allocation Mortgage Heloc Auto Loan Processing Time By Geography by Loan Type By quarter Total Loan Count History By Geography Total Finance Issue Summary Severity Level Customer Representative Date Insurance KPIs Worldwide Premiums Revenue Revenue Growth by Channel Retail Banks Full Service Brokers Independent Advisors Revenue Transactions by Channel Retail Banks Full Service Brokers Independent Advisors Worldwide Average Transaction Size At Risk Measures Market Share Number of New Policies Underwriting Speed Underwriting Analysis Expense by Region Lapse Ratios by Geography Days Sales Outstanding By Geography By Channel Claims Processing Issues Severity Level Customer Representative Date

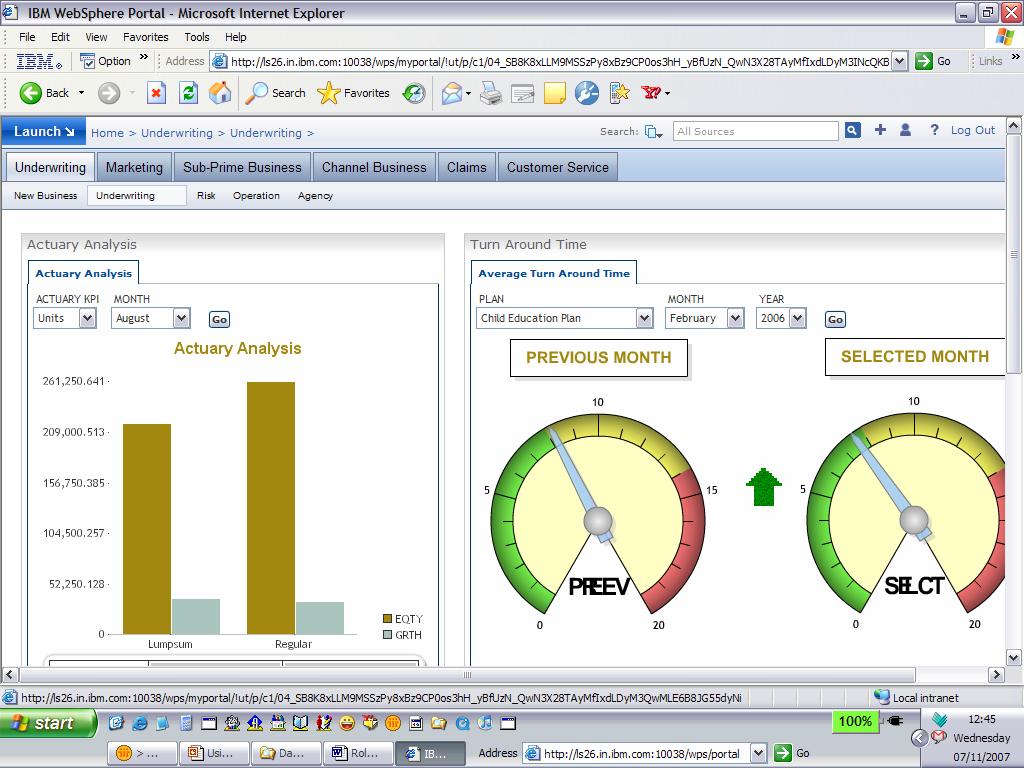


20 The look and feel
21 ?? Q & A????