Studying Distribution System Hydraulics and Flow Dynamics to Improve Water Utility Operational Decision Making
|
|
|
- Clinton Arnold
- 5 years ago
- Views:
Transcription
1 Studying Distribution System Hydraulics and Flow Dynamics to Improve Water Utility Operational Decision Making UNIVERSITY OF KENTUCKY (Principal Investigator) Lexington, Kentucky Lindell Ormsbee, Sebastian Bryson, Scott Yost UNIVERSITY OF CINCINNATI (Collaborating University) Cincinnati, Ohio Jim Uber, Dominic Boccelli UNIVERSITY OF MISSOURI (Collaborating University) Columbia, Missouri Robert Reed, Enos Inniss WESTERN KENTUCKY UNIVERSITY (Collaborating University) Bowling Green, Kentucky Jana Fattic Andrew Ernest (University of Alabama) 1
2 Advisory Board DHS Water Sector (John Laws) USEPA NHSRC (Robert Janke) USEPA Water Security Division (Katie Umberg) Kentucky Division of Water (Terry Humphries) American Water Company (Nick Santillo) (3) Large Water Utilities NKYWD (Amy Kramer) Louisville (Jim Brammell) Denver (Arnold Stasser) (1) Medium Sized Water Utility Nicholasville KY (Tom Calkins) (1) Small Water Utility Paris KY (Kevin Crump) Sandia Laboratory (William Hart) ATSDR (Morris Maslia) University of Louisville (Jim Graham) KY/TN AWWA (Mike Bethurem) ERDC-CERL-IL (Mark Ginsberg) 2
3 Utility Partners Large Water Utilities NKYWD (Amy Kramer) 28.2 MGD* Louisville (Jim Brammell) Denver (Arnold Strasser) Medium Sized Water Utilities Nicholasville KY (Tom Calkins) 4.4 MGD Richmond KY (Danny Pearson) 6.3 MGD Small Water Utility Paris KY (Kevin Crump) 1.8 MGD Berea KY (Donald Blackburn) 2.9 MGD * Average Daily Demand 3
4 Utility Partners NKYWD LWC Paris Nicholasville Richmond Berea 4
5 Project Goal To assist water utilities in improving the operation of their water distribution systems in support of: Normal operations Emergency operations Natural events Man made events Research Knowledge Tools


6 WDS Operational Objectives Maintain Adequate Flows and Pressures Minimize Water Quality Problems Minimize Operational Cost Schedule Maintenance Emergency Response 6

7 7
8 Needs Assessment/Technology Gaps Gap 1: No synthesis document exists that provides a state-of-the-art assessment and a state-of-the-practice for SCADA systems across the drinking water industry. Objective 1: Develop a comprehensive report assessing the current state of SCADA systems (including hydraulic and water quality sensors) across the drinking water industry for use in support of real time operational modeling. 8
9 Needs Assessment/Technology Gaps Gap 2: A simple modeling tool is needed to help utilities understand basic system hydraulics during normal operational flow conditions and also during abnormal flow patterns resulting from unanticipated events. Objective 2: Develop software that will provide a graphical representation of a water distribution system along with the flow directions in the pipes for a specified operating condition. 9
10 Needs Assessment/Technology Gaps Gap 3: An understanding of the sensitivity of water quality measurements to variations in system flow dynamics is needed in order to be able to distinguish between possible incursions and operational fluctuations. Objective 3a. Develop laboratory scale model of medium sized utility water distribution system to evaluate the ability of existing software to adequately characterize the flow dynamics and water quality characteristics of the system. Objective 3b: Calibrate a large-scale network model against a historical record of operational changes stored in SCADA, and use this model to understand the sensitivity of network flows and flow paths (and thus water quality) to changes in system demand and operation. 10
11 Needs Assessment/Technology Gaps Gap 4:Guidance is needed for optimal placement of hydraulic sensors in order to better assist utilities in understanding their system s flow dynamics. Objective 4. Develop guidance for optimal placement of hydraulic sensors based on results of flow dynamics model and operational constraints of the utility. 11
12 Needs Assessment/Technology Gaps Gap 5: Most utilities lack guidance with respect to how to use SCADA and modeling data in support of their system operations, and in particular with regard to responding to potential incursion events. Guidance is needed for optimal placement of hydraulic sensors in order to better assist utilities in understanding their system s flow dynamics. Objective 5. Develop a decision-support toolkit which will allow utilities to select the appropriate level of operational tools in support of their operational needs. 12

13 Water Distribution System Operations Hierarchy Real Time Operations On-Line Water Quality Model On-Line Hydraulic Model System Analytics Integration Operator Interface Telemetry/Communication Systems RTUs/PLCs Hydraulic /Water Quality Sensors Off-Line Water Quality Model Off-Line Hydraulic Model Spatial Visualization Model Physical Map of System Hardware Site Specific Software Total System
14 The potential exists for real time on-line network models to produce a more sophisticated event detection filter SCADA On-Line Network Model Hyd. Model WQ Model Measured Chlorine + Estimated Chlorine Event Detection filter Prediction Error Hydraulic Sensor (P, Q, Pump Status, ) Quality Sensor (Cl, Sp. Cond., TOC, ) 14
15 Water Distribution System Operations Hierarchy Real Time Operations On-Line Water Quality Model On-Line Hydraulic Model System Analytics Integration Operator Interface Telemetry/Communication Systems (1) SCADA Survey RTUs/PLCs Hydraulic /Water Quality Sensors Hardware Site Specific (2) SCADA Guidelines

16 16
17 Water Distribution System Operations Hierarchy Real Time Operations On-Line Water Quality Model On-Line Hydraulic Model System Analytics Integration Sensor Placement Issues Off-Line Water Quality Model Model Calibration Issues Off-Line Hydraulic Model Spatial Visualization Model Graphical Flow Model Physical Map of System Software Total System
18 Utility Partners Paris Nicholasville Berea 18
19 Water Distribution System Operations Hierarchy Real Time Operations On-Line Water Quality Model On-Line Hydraulic Model System Analytics Integration (1) Real-time modeling and hydraulic accuracy (2) Real-time evaluation water quality accuracy (3) Real-time data analytics
20 Utility Partners NKYWD 20


21 Water Distribution System Operations Website PURPOSE: To assist water utilities with operation. Operational Applications Normal Operations Emergency Response Management Water Quality Management Energy Management Event Detection 21
22 WDS Operational Decision Support Tool User Defined Decisional Process User Assisted Decisional Process 22
23 Studying Distribution System Hydraulics and Flow Dynamics to Improve Water Utility Operational Decision Making Hardware Issues: SCADA Dr. Robert Reed, University of Missouri Dr. Enos Inniss, University of Missouri 23
 SCADA Survey RTUs/PLCs Hydraulic /Water Quality Sensors Hardware Site Specific (2) SCADA")
24 Water Distribution System Operations Hierarchy Real Time Operations On-Line Water Quality Model On-Line Hydraulic Model System Analytics Integration Operator Interface Telemetry/Communication Systems (1) SCADA Survey RTUs/PLCs Hydraulic /Water Quality Sensors Hardware Site Specific (2) SCADA Guidelines
 across the drinking water industry for use in support of real time operational")
25 Hardware Issues: (1) SCADA Survey Objective: Develop a comprehensive survey assessing the current state of SCADA systems (including hydraulic and water quality sensors) across the drinking water industry for use in support of real time operational modeling. 25
26 Hardware Issues: (1) SCADA Survey Significant Accomplishments: 26 responses from 4 states Data indicated major uses: System security Equipment status monitoring Historical trend analysis Monitor water usage Maintenance prediction 26
27 Hardware Issues: (1) SCADA Survey Products/Deliverables: SCADA Survey Report Understanding of need for: Training on SCADA uses in water distribution systems Support for SCADA use in water distribution systems 27
28 Hardware Issues: (1) SCADA Survey Significant Findings Most common uses of SCADA identified Results directly supporting this project Data use for operations & management: reduced personnel time for equipment monitoring & remote control generating bills forecast equipment maintenance, repair, replacement increase facilities security alarm conditions notification more consistent knowledge of water quality & hydraulics SCADA benefits reported = uses 28
29 Hardware Issues: (2) SCADA Guidelines Objective: Develop a comprehensive report assessing the current state of SCADA systems (including hydraulic and water quality sensors, data collection/telemetry, RTUs/PLCs, communication options, SCADA master, etc) across the drinking water industry for use in support of real time operational modeling. 29
30 Hardware Issues: (2) SCADA Guidelines Significant Accomplishments: SCADA equipment and use information is very fragmented, difficult for individual utilities and designers to learn. One report is not sufficient. Incorporation of information from this project into on-line training is under development at MU. Development of SCADA Survey and Guidelines yielded understanding of need for basic SCADA training and support for water supply industry. 30
31 Hardware Issues: (2) SCADA Guidelines Products/Deliverables: SCADA Guidelines Report Basic SCADA use information & training needs to be more readily available and delivered to the water supply industry. 31
32 Hardware Issues: (2) SCADA Guidelines Significant Findings Rapidly changing technology of SCADA changes complexity just as quickly Sensor technology stable, communications rapidly advancing, driving down costs Cyber security is major issue, function of telemetry Equipment, material costs difficult to obtain 32
33 Studying Distribution System Hydraulics and Flow Dynamics to Improve Water Utility Operational Decision Making Software Issues Dr. Lindell Ormsbee, University of Kentucky Dr. Scott Yost, University of Kentucky Dr. Sebastian Bryson, University of Kentucky 33
34 Water Distribution System Operations Hierarchy Real Time Operations On-Line Water Quality Model On-Line Hydraulic Model System Analytics Integration (3) Sensor Placement Issues Off-Line Water Quality Model (2) Model Calibration Issues a) Lab b) Field (1) Graphical Flow Model Off-Line Hydraulic Model Spatial Visualization Model Physical Map of System Software Total System

35 Software Issues: (1) GFM Task Objective: Develop software that will provide a graphical representation of a water distribution system along with the flow directions in the pipes for a specified operating condition. 35


36 Graphical Flow Distribution Model Use readily available network data from the Kentucky Infrastructure Authority website to build network model of selected system. Provide ability to add pipes or nodes. Provide total system demand and distribute demands among nodes. Input pump station discharge and tank levels and visualize flows and flow distribution. Provide access to data via table functions. Graphical Flow Distribution Model GIS Datasets KYPIPE, EPANET, etc 36
37 Personnel Software Issues: (1) GFM Ben Albritton (Research Associate) Joe Goodin (Graduate Research Assistant) Stephen Hoagland (Undergraduate Student) 37
38 Software Issues: (1) GFM Significant Accomplishments. Partnered with KYPIPE to produce graphical flow model that integrates online mapping and network databases Facilities management database Graphical display of network components Graphical display of flows and pressures Upgradable to KYPIPE or EPANET Presented overview of program at 2012 EWRI Water Congress Presented overview of program at 2013 KY Small Operators Conference Published journal article in ASCE JWRPM (2013) 38
39 Software Issues: (1) GFM Products/Deliverables: Graphical Flow Model Software Graphical Flow Model User s Manual 39
40 Significant findings Software Issues: (1) GFM A significant number of smaller utilities do not have a network model The proposed graphical flow model should help such utilities better manage their system operations 40
41 Software Issues: (1) GFM Future Directions: Continued partnership with KYPIPE Small utility partnership program Future workshops KY SWWOA KY/TN AWWA 41
42 Studying Distribution System Hydraulics and Flow Dynamics to Improve Water Utility Operational Decision Making Task 6: Model Calibration Joe Goodin Dr. Lindell Ormsbee University of Kentucky 42

43 Software Issues: (2a) Lab Calibration Task Objective: Calibrate network models for a small and medium sized system and determine general guidelines for calibration that will be useful in improving the performance of such models in evaluating the performance of the actual systems. 43

44 Software Issues: (2a) Lab Calibration Personnel: Myagmar Dashaa Brody Clark Anna Zhidkova Tyler Mahoney Brendan O Brien Craig Ashby Matt Jolly 44
45 Software Issues: (2a) Lab Calibration Accomplishments: Fully Functional Lab Model with pressure, flow and water quality sensors. Archived information on lab model design, construction and calibration 45
46 Software Issues: (2a) Lab Calibration Products/Deliverables: Physical Model Design Report Physical Model Construction Report Physical Model Analysis Report 46
47 Software Issues: (2a) Lab Calibration Significant Findings Multi data sets with different conditions are required for optimum calibration. Using both velocity and pressure measurements produce better verification results. The use of one source of data (e.g., velocity) in the calibration can distorts the verification results of the other data (e.g., pressure) Lab model minor loss dominated which puts greater emphasis on accurate minor loss coefficients. Lumped C values can vary significantly in the Lab model. Significant diffusion of the tracer in the lab model. 47
48 Software Issues: (2a) Lab Calibration Future Directions: Plans to refit and upgrade laboratory model Plans to perform additional experiments educing minor loss coefficient variation due to variation in construction Refined calibration procedures for minor loss components. 48

49 Software Issues: (2b) Field Calibration Task Objective: Calibrate network models for a small and medium sized system and determine general guidelines for calibration that will be useful in improving the performance of such models in evaluating the performance of the actual systems. 49

50 Software Issues: (2b) Field Calibration Personnel: Joe Goodin Reese Walton Stacey Schal Brody Clark Anna Zhidkova Brendan O Brien Craig Ashby Matt Jolly 50
51 Software Issues: (2b) Field Calibration Significant Accomplishments: Provided the Utility partners a greater understanding of the behavior and characteristics of their systems. Improved physical inventory records and data collection Produced field data sets for distribution system software calibration Produced a first cut at an operational model for small utility partner 51
52 Software Issues: (2b) Field Calibration Products/Deliverables Sampling QAPP Hydraulic Calibration Report (Paris and Nicholasville System) Water Quality Calibration Report (Nicholasville System) Fire Hydrant Information Phone Application 52
53 Software Issues: (2b) Field Calibration Significant findings Models need to be calibrated prior to use. Calibrated models can be used to help facilitate operational decisions (e.g. Nicholasville and Paris). Use of a conservative tracer (i.e. fluoride) is feasible and useful in verifying travel times across the system. Work in Nicholasville confirm the fact that water quality transport involves both advective and dispersive components. 53
54 Software Issues: (3) Sensor Placement Task Objective: Develop guidance for optimal placement of flow and pressure sensors based on results of flow dynamics model and operational constraints of the utility. Use the guidance to recommend hydraulic and water quality sensor placement for the small and medium sized utility. 54
55 Software Issues: (3) Sensor Placement Personnel: Stacey Schal (Graduate Research Assistant) Amanda Lothes (Graduate Research Assistant) Matthew Jolly (Graduate Research Assistant) 55

56 Software Issues: (3) Sensor Placement Developed a database of 12 hydraulic models Performed a baseline analysis of hydraulic models using TEVA-SPOT 56


57 Software Issues: (3) Sensor Placement KY 13 Developed 3 additional hydraulic models Developed sensor placement tool in KYPIPE Minimizes time to detection Places up to 5 sensors Enumeration methods KY 14 KY 15 57
58 Software Issues: (3) Sensor Placement Used KYPIPE sensor placement tool to find optimal sensor locations 12 systems 15 contamination scenarios 1 and 2 sensors Used results to derive general placement guidelines 58

59 Software Issues: (3) Sensor Placement Products/Deliverables: Hydraulic model database Database paper TEVA-SPOT analysis report KYPIPE Sensor placement tool TEVA-SPOT/KYPIPE report Sensor placement report KYPIPE paper Graphical method paper Simple method paper 59
60 Software Issues: (3) Sensor Placement Significant Findings: TEVA-SPOT not widely adopted in the industry Simpler methods needed for smaller utilities Complete enumeration strategy sufficient for limited number of sensors A comparison of the average times to detection for the placement of one and two sensors in the WDS networks revealed that the average time to detect did not significantly decrease with the addition of a second sensor, so deployment of only one water quality sensor in a small system may be sufficient. 60
61 Software Issues: (3) Sensor Placement Future Directions: Further research on this subject should investigate the impacts of other objective functions such as the percentage of contamination events detected or the length of pipe contaminated. Incorporation of simple graphical methods into KYPIPE 61

62 Studying Distribution System Hydraulics and Flow Dynamics to Improve Water Utility Operational Decision Making Task 7: Quantify Flow and Water Quality Dynamics Through Real-Time Modeling Dr. Jim Uber Dr. Dominic Boccelli University of Cincinnati 62
63 Water Distribution System Operations Hierarchy Real Time Operations On-Line Water Quality Model On-Line Hydraulic Model System Analytics Integration (1) Real-time modeling and hydraulic accuracy (2) Real-time evaluation water quality accuracy (3) Real-time data analytics
64 Integration Issues: (1) Real Time Modeling and Hydraulic Accuracy Evaluation Task Objective: Analyze the ability of real-time network models to represent field-scale hydraulic variability as expressed through existing SCADA data by leveraging and extending the USEPA RTX real-time modeling platform (USEPA, National Homeland Security Research Center; Rob Janke, PI) 64
65 Integration Issues: (1) Real Time Modeling and Hydraulic Accuracy Evaluation Significant Accomplishments Configure real-time hydraulic model for Northern Kentucky Water District Harvest SCADA data and Implement strategy for real-time SCADA data analysis Extend Epanet-RTX real-time modeling platform (demand zone delineation, code robustness, water quality simulation) Conduct real-time hydraulic simulations with automatic model calibration; quantify variability and errors 65
66 Integration Issues: (1) Real Time Modeling and Hydraulic Accuracy Evaluation Products/Deliverables Real-time simulation configuration and flow dynamics report - Detailed description of the field site and realtime SCADA data processing for the large utility (Northern Kentucky Water District). - Detailed comparison of SCADA data with automatically calibrated real-time hydraulic model predictions RTX Model and Calibration Report 66

67 Field Site Evaluation SCADA Data Water levels in tanks and clearwells Suction / discharge pressures at pump stations Discharge flows at pump stations and treatment sources Runtime meters at individual pumps Upstream /downstream pressures and flows at key pressure regulating valves Several metered demands 150 SCADA timeseries Infrastructure Junctions Pipes 20 Tanks 43 Pumps 33 PRVs 28 MGD (3 WTP)


68 RTX real-time simulation steady-state model extended period simulation tank curves tank curves configure SCADA Billing Historian.csv SCADA export access diurnal curves transform simulate generate DMAs assign DMA demands assign pump statuses assign boundary H, Q, C control rules batch simulate persist


69


70
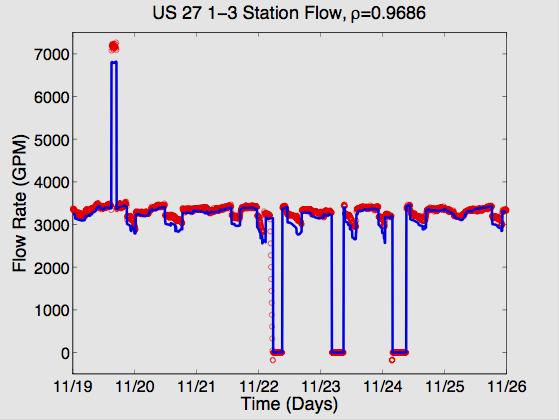
71 Integration Issues: (1) Real Time Modeling and Hydraulic Accuracy Evaluation Significant Findings: Noisy SCADA data can be effectively filtered using realtime algorithms, and used to drive autonomous network simulations Network hydraulic models developed for master planning purposes can be leveraged for real-time simulation of network-wide pressures, water levels, and flow rates, sufficiently accurate for many practical purposes Automated data processing and model calibration achieved through real-time simulation software technology (RTX) is efficient and accurate compared to standard, manual, oneoff calibration strategies 71
72 Integration Issues: (2) Field Evaluation of Realtime Simulation Water Quality Accuracy Task Objective: Perform a field-scale tracer monitoring study as a severe test of the ability of real-time calibrated models to represent water quality transport variability. 72

 Dead End Mains (7) Tank inlet")
73 Integration Issues: (2) Field Evaluation of Realtime Simulation Water Quality Accuracy Focus on smaller distribution mains - 6 diameter (7) - 8 diameter (10) - 10 diameter (8) Dead End Mains (7) Tank inlet piping (5)
74 Integration Issues: (2) Field Evaluation of Realtime Simulation Water Quality Accuracy Statistical error summary No model calibration performed beyond real-time data processing; no adjustments of parameter values, or micro-calibration Median travel time error = 3.88 hours Median pulse dispersion error (IQR) = 1.46 hours Median area under curve error = 37 %
75 Average. 3 Worse. 3 Better. 3
76 Integration Issues: (2) Field Evaluation of Realtime Simulation Water Quality Accuracy Significant Accomplishments: Conducted field-scale tracer test in Northern Kentucky Water District distribution system Complete analysis and reduction of tracer study data Conducted real-time water quality simulations to compare with tracer study dataset, quantified variability and errors First such analysis of transport prediction errors reported for automated, real-time network water quality models
77 Integration Issues: (2) Field Evaluation of Realtime Simulation Water Quality Accuracy Products/Deliverables: Real-time water quality model calibration report - detailed description of field monitoring and salt injection - detailed analysis comparing SCADA data with calibrated water quality model predictions
78 Integration Issues: (2) Field Evaluation of Realtime Simulation Water Quality Accuracy Significant Findings: Network models developed for typical master planning purposes can be leveraged to produce automated and real-time estimates of water travel times, system-wide, and these estimates can be sufficiently accurate for a variety of presumed operational uses 78
79 Integration: (3) Real Time Data Analytics Objective: Evaluate uses of real-time predictive analytics that bring benefits to water utilities 79

80 Integration: (3) Real Time Data Analytics

81 Early Leak Identification: Analytics on DMA demands correlate with sudden pump operating point shift gpm Event Detected: 3:22 am DMA 1080 Minimum Nightly Flow Change Event Detected: 2:34 pm DMA 876 Average Demand Change


82 1080 ft 876 ft Discovered failed control valve near pump station $80,000/year in wasted energy + Cost of excessive pump motor/impeller wear Unnoticed for 2 years until discovered through retrospective data analytics Enhanced situational awareness brings value to utilities
 Estimated Quality Prediction Error Event Detection filter Hydraulic Sensor (P, Q, Pump Status, ) Quality Sensor (Cl, Sp. Cond.")
83 Real-time network models could improve prediction accuracy and reduce false-positives, producing a robust event detector Updated Demands / Real Control Actions Real-Time Network Model SCADA Real-Time Hyd. Model Real-Time WQ Model Measured Quality + (Improved) Estimated Quality Prediction Error Event Detection filter Hydraulic Sensor (P, Q, Pump Status, ) Quality Sensor (Cl, Sp. Cond., TOC, )
, where T is the detection threshold. 3.")
84 Simple Event Detection Procedure 1. Create filtered signal Sˆ from original signal to be processed, S, using a standard moving average filter with averaging time window W s 2. Create binary status signal B = (Sˆ > T ), where T is the detection threshold. 3. Raise alarm if status B consistently equals 1 within a detection time window W d ; otherwise no alarm is raised.
85 Integration: (3) Real Time Data Analytics Significant Findings: Using model-based event detection, median threshold ratio is 0.69, indicating half the monitoring locations allow a decrease in the detection threshold (a tightening of the threshold used to trigger an alarm) of 30% or greater This decrease should lead to increased sensitivity to actual contamination events, while leaving the false positive rate unaffected These results indicate a potential for increasing sensitivity of event detection when processing real water quality signals from contamination warning systems
86 Studying Distribution System Hydraulics and Flow Dynamics to Improve Water Utility Operational Decision Making Operational Guidance Dr. Lindell Ormsbee Ben Albritton Christie Oliver University of Kentucky 86
87 Water Distribution System Operations Hierarchy Real Time Operations On-Line Water Quality Model On-Line Hydraulic Model System Analytics Integration Operator Interface Telemetry/Communication Systems RTUs/PLCs Hydraulic /Water Quality Sensors Off-Line Water Quality Model Off-Line Hydraulic Model Spatial Visualization Model Physical Map of System Hardware Site Specific Software Total System
88 Distribution (1) Operational Guidance Objectives: Develop a user directed website to provide access to project products and deliverable as well as guidance on water distribution system operations. 88
89 User Defined Decisional Process (Guidance) User Defined Decisional Process User Assisted Decisional Process 89
90 Distribution (1) Operational Guidance Future Directions: Continued upgrade and maintenance of site Expanded content Access to technical papers Potential partnership with ASCE/AWWA Potential commercial functionality Potential portal functionality 90

91 Studying Distribution System Hydraulics and Flow Dynamics to Improve Water Utility Operational Decision Making Operational Toolkit Jana Fattic Western Kentucky University Dr. Andrew Ernest, Abdoul, Oubeidllah University of Alabama 91
92 Water Distribution System Operations Hierarchy Real Time Operations On-Line Water Quality Model On-Line Hydraulic Model System Analytics Integration Operator Interface Telemetry/Communication Systems RTUs/PLCs Hydraulic /Water Quality Sensors Off-Line Water Quality Model Off-Line Hydraulic Model Spatial Visualization Model Physical Map of System Hardware Site Specific Software Total System
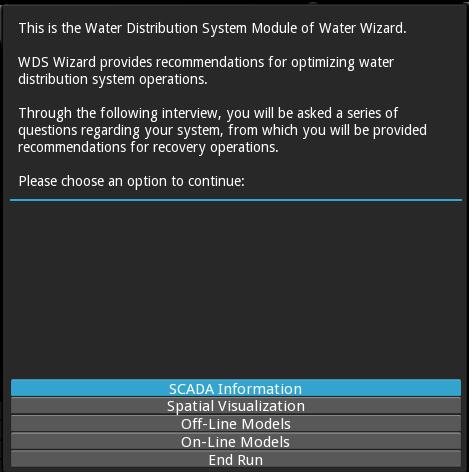
93 Distribution (2) Water Wizard Toolkit Objectives: Develop an expert system based toolkit that will incorporate knowledge-base acquired from Tasks 1-3 and provide an interview-style user interface that will guide users through rule based queries to assist them in the design of a monitoring and control system for their water distribution networks. 93
94 Distribution (1) Water Wizard Toolkit Personnel: Andrew Ernest (Principle Investigator) Jana Fattic (Project Director) Alanna Malone (Reporting) Abdoul Oubeidillah (Post Doc) Joseph Gutenson (Graduate Student) 94
95 Semantic Knowledge Development Hardware Software Integration If Then. Rules 95

96 User Assisted Decisional Process (toolkit) User Defined Decisional Process User Assisted Decisional Process 96


97 WDS Toolkit
98

99


100
101 Distribution (2) Water Wizard Toolkit Significant Accomplishments: Initiation (Water Expert) C Language Integrated Production Systems Proof of Concept (Water Wizard) Java Expert System Shell Commercialization (WDS Toolkit) Python Knowledge Engine 101

102 Distribution (2) Water Wizard Toolkit Products/Deliverables: Toolkit renamed WDS Wizard to reflect integration with Water Wizard suite Beta versions made publicly available Windows and Android 102
103 Distribution (2) Water Wizard Toolkit Significant Findings: Water System Personnel are overtly sensitive to Data Security - Standalone DSS are likely to be more accepted that cloud-based data storage. Python is the preferred application development language of choice, ensures the broadest applicability across platforms Aesthetics content such as Graphics and orther visuals are necessary for broader adoption of the DSS. 103

104 Distribution (2) Water Wizard Toolkit Future Directions: 104

105 Distribution (2) Water Wizard Toolkit Future Directions: 105
106 Studying Distribution System Hydraulics and Flow Dynamics to Improve Water Utility Operational Decision Making Technology Deployment Lindell Ormsbee University of Kentucky 106
107 Technology Deployment Demonstration Implementation Workshop Revisions Revisions Feedback 107
108 Workshops Northern Kentucky (May 27, 2014) Paris Kentucky (June 12, 2014) Nicholasville Kentucky (June 25, 2014) Lexington Kentucky (August, ) Morehead State University (0.31 MGD) Carrollton Utilities (0.74 MGD) Bath County Water District (0.95 MGD) Laurel Water District #2 (1.17 MGD) Leitchfield Utilities (1.55 MGD) Bardstown Municipal Water (3.95 MGD) Morehead Utility (4.22 MGD) Kentucky American Water Company (30 MGD) 108


109 Utility Participants 109
110 Project Resources Hardware Options Workshop Agenda Sensors and controllers SCADA interface Communication options Operator interface Design & build options Sensor placement Guidance Software 110
111 Software Options Workshop Agenda Data Requirements Graphical Flow Model Overview Data management features Pipe break analysis Flow/pressure analysis Model calibration KYPIPE Extended period analysis Water quality analysis 111
112 Workshop Agenda Hardware/software integration Utility survey Data analytics Real time operation 112
113 Survey Results At least 70% indicated they would likely use the website. The smaller utilities did not have a computer program but all indicated an interest in the partnership/student intern program. 100% of the respondents saw potential use of the GFM for their utility. 70% indicated that being able to analyze water quality with GFM would be a useful feature. The majority of the participants found the hands-on workshop with the GFM to be the most useful part of the workshop. 70% indicated water quality modeling was important. Most utilities have a historical SCADA database. 70% indicated real time modeling was important. 113
114 How Useful was today s workshop? 1. Very Useful 2. ** 3. *** 54% 4. **** 5. ***** 6. ****** 7. ******* 23% 8% 15% 8. ******** 0% 0% 0% 0% 0% 9. Not Useful Very Useful ** *** **** ***** ****** ******* ******** Not Useful


115 Sustainability Model Real Time Operations On-Line Water Quality Model On-Line Hydraulic Model System Analytics Integration Operator Interface Telemetry/Communication Systems RTUs/PLCs Hydraulic /Water Quality Sensors Hardware Site Specific Off-Line Water Quality Model Off-Line Hydraulic Model Spatial Visualization Model Physical Map of System Software Total System Open Environment Citi-Logics


116 Sustainability Model Real Time Operations On-Line Water Quality Model On-Line Hydraulic Model System Analytics Integration Operator Interface Telemetry/Communication Systems RTUs/PLCs Hydraulic /Water Quality Sensors Hardware Site Specific Off-Line Water Quality Model Off-Line Hydraulic Model Spatial Visualization Model Physical Map of System Software Total System

117 Acknowledgments This research was funded through funds provided by the Department of Homeland Security, administered by the National Institute for Hometown Security Kentucky Critical Infrastructure Protection program, under OTA # HSHQDC , Subcontract # UK. This support was greatly appreciated. 117

118 Final Comments and Questions 118