Date: 11/09/2011 Time: 2:30pm- 3:45pm Location: 090-Marina - Westin 4th Floor
|
|
|
- Conrad Richards
- 5 years ago
- Views:
Transcription

1 Date: 11/09/2011 Time: 2:30pm- 3:45pm Location: 090-Marina - Westin 4th Floor
2 Introduction of Santa Ana Team: Alexandra Ito, Director of Education Technology Ricardo Enz, Director of Technology Mobashir Mohammad, Assistant Director of Technology Bob Chavez, Manager of Network & PC Support R 2
3 Description of Presentation Data Warehouse will enhance the use of data that is currently gathered and maintained by the district by making early-warning predictive data analysis reports for students accessible in an easy-tounderstand format through a dashboard interface from one data warehouse. These reports will be available to monitor progress and to strategically provide identified interventions or resources to support student success. R 3
4 Our Mission to fulfill the vision -- in collaboration and communications, in business continuity and data security, and in the efficient running of schools. -- with tailor-made solutions built on an in-depth understanding of our unique needs, strategies and objectives. -- solutions that provide easy access to information and fast effective communication among parents and staff. -- and improving quality of education. R 4
 Data Systems to Support Student Success A")
5 American Recovery and Reinvestment Act (ARRA) Enhancing Education Through Technology (EETT) Data Systems to Support Student Success A 5
6 ARRA EETT Competitive Grant Overview One of 8 California districts to receive $1,000,000 to implement use of data in support of student success Acquisition, maintenance and use of data to improve high school graduation rate and college and career readiness Funds for this program must be used to supplement and not supplant existing programs Federal grant: extensive reporting required to ensure transparency and accountability A 6
7 ARRA EETT Competitive Grant Requirements Data System Focus Data system development to analyze data/graduation, college and career readiness. Ability to disaggregate data and produce individualized reports Professional Development Teacher/administrator use of data in support of graduation rate and college, career readiness Community and Partners Input by community and partners in decision-making, input from colleges and partners for college and career readiness Program Evaluation/Sustainability External evaluator (OCDE) Program sustained through funding and knowledge transfer Program replication on a statewide basis Year Two Year two support through obligations Evaluation due end of year two A 7
8 August 2008 Early Warning Systems: Setting the Stage Some indicators are usually strong predictors In the high-poverty districts, we have not found one district where grades, credits, and attendance are not highly predictive Johns Hopkins University Chicago Public Schools graduates and dropouts were accurately identified 80 percent of the time using an on-track indicator. San Jose Unified School District Graduation rate is 2nd in the nation for Urban Districts their district-wide early warning system is attributed with being a significant factor in increased graduation rate. A 8
9 Using Early-Warning Indicators at the School and District Levels Early-warning systems provide data that can align students with specific interventions. This data is useful for those charged with improving school outcomes and for the policymakers interested in targeting resources to the schools that face the most significant academic challenges. Can be used to assess the effectiveness of strategies in a timely manner. Provides a way to demonstrate whether an entire school is on track to improving graduation rates. A 9
10 Predictive Analytics: Ability to anticipate with great clarity what students will need when they'll need it Student Success how they'll need it R Giving educators the ability to shift from blunt-force "prepare for everything" approaches to the more productive and effective model of focusing their efforts on the precise opportunities and outcomes that analytics can provide. 10
11 ARRA/EETT Grant Implementation NOV DEC JAN FEB MAR APR MAY JUNE JULY AUG SEPT OCT Grant Award Planning: Review Historical Data to Identify Indicators and Align Resources Technology: Acquire and install hardware and software, configure to indicators Staff Development User Support Grant Completion R 11

12
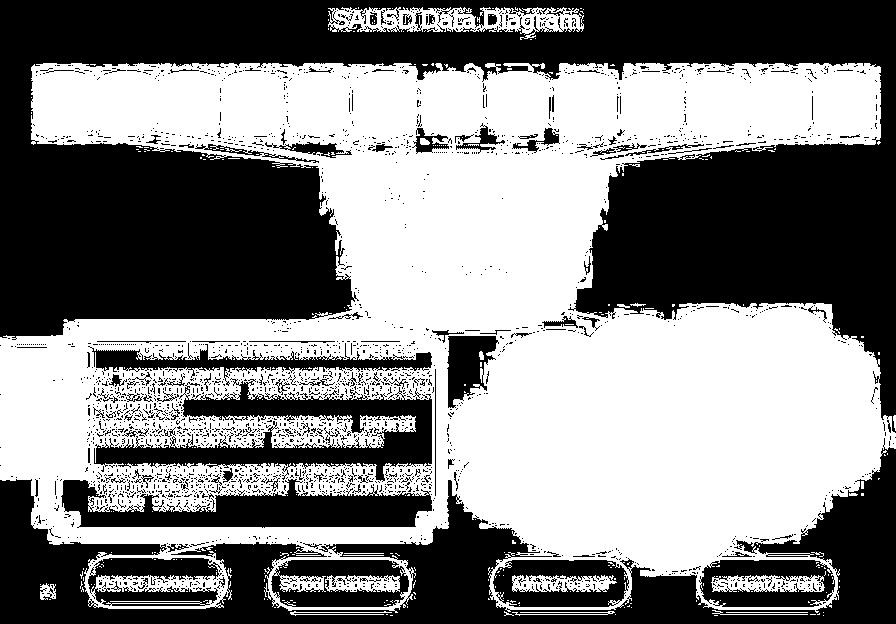
13 Reporting and Analytics Business systems Look up and edit individual records. Execute tasks and record transactions. Operational data stores Access data from one business domain. Create production reports. Financial Aeries Data Director Oracle SQL MySQL Integrated data environment (EDW) Correlate data across systems. Report on historical data over time. Create longitudinal-level reports. Analytics Create metrics based on institutional goals Monitor performance using dashboards. Conduct institutional research. R 13
14 Integrated data environment Data stores Extraction, transformation, and load (ETL) Integrated data environment Consistent access controls Reporting tools Contains data extracted from many business domains, stored over time. Some data is transformed to make key data consistent across domains. Multiple reporting tools should be supported. The same access controls should be enforced across all reporting tools. Access control is inherently less fine-grained than underlying business systems to enable broader vision. Reporting is constrained by how the data was originally collected and stored. R 14
15 Student-Centric Data Technology Applying Analytic Technology to Enterprise Data Data Warehouse Infrastructure Data Warehouse Hardware & Software Education Data Warehouse Data Analytics & Presentation Creation of Student Success Metrics Analytics Reports & Dashboard B 15

16 Data Warehouse Infrastructure: Hardware Compellent Storage SAN B 16
17 Data Warehouse Infrastructure: Hardware Dell Servers B 17
18 Data Warehouse Infrastructure: Software Red Hat Linux Standardization on Red Hat Enterprise Linux provides the flexible, secure, and stable environment to get the most out of your applications and staff. It creates a limitless operating environment to support your organization's standout ideas while reducing your total cost of ownership (TCO) B 18
19 Data Warehouse Infrastructure: Software Oracle Database Oracle Database 11g delivers industry leading performance, scalability, security and reliability on a choice of clustered or single-servers running Linux. It provides comprehensive features to easily manage the most demanding business intelligence and data warehouse applications. B 19

20 Data Warehouse Infrastructure: Schema The escholar Complete Data Warehouse for PK-12 is a comprehensive software product which enables state and local education agencies to gather, integrate and manage key education-related data from a wide variety of operational systems and data sources. B 20
21 Data Warehouse Infrastructure: Analytics Oracle Business Intelligence Enterprise Edition 11g (OBIEE) is a comprehensive business intelligence platform that delivers a full range of analytic and reporting capabilities. Designed for scalability, reliability, and performance, OBIEE 11g delivers contextual, relevant and actionable insight to everyone in an organization, resulting in improved decision-making, better-informed actions, and more efficient business processes B 21
22 Data Warehouse Infrastructure: Reporting Stoneware's webnetwork 6 is a software solution that allows organizations to deploy their own private and hybrid clouds. webnetwork is installed inside of the data center on servers and creates a secure cloud that provides users with access to data center applications and resources through a desktop built in a browser. B 22
23 Student-Centric Data Technology Applying Analytic Technology to Enterprise Data Data Warehouse Infrastructure Student Success Metrics Establish data dictionary Identify Metrics Establish Indicators Analytics Reports & Dashboard R 23
24 There are a multitude of complicating issues: Complexity of cataloging all data fields Complexity of authorization: the Who sees what? Complexity of access: the How do I see what? Regulatory issues Data security Data accuracy issues Confusing concepts and vocabulary R 24


25 Cycle of Inquiry: Goal->KPI->Analytics Institutional, program, and project goals Performance metrics Research questions Dashboards District Principal AP Counselor Analytics Scenarios Projections R Goals must be defined to establish measurable performance metrics and research questions. An analytics environment provides dashboards that show current status compared with a defined goal. An analytics environment also provides the ability to run hypothetical scenarios and projections for institutional research. 25
26 Role of the Core Team (Data Owners) Phase 1 1 st Data Interview: provide data to establish data dictionary, identify existing analytics (March 12) Bi-weekly Monday morning meetings Identify Metrics (ESBOCES live demo, April 27) 2 nd Data Interview (week of May 2) Finalization of EWI s by 7/31 Phase 2 Verifying Data Professional Development Intervention Alignment A 26
27 Attendance Indicator Weight Sub- Indicator 30% Attendance rate (days present) < 95% for the current year 30% 3 or more days absent in the current year Excused & Unexcused absences combined -OR- 3 or more tardies in the current year 20% 3 or more consecutive days absent in the current year (consistent with the A2A program) 20% 10 or more days absent in the current year A 27
28 Assessments Indicator Weight Sub- Indicator 30% 9 th grade indicator: Failing mock CAHSEE score -OR- 10 th grade (+) indicator: Failing CAHSEE score 40% CELDT: deviations in proficiency (past 5 years) EL student with 9+ years in an EL program, with a CELDT score or Advanced or Early Advances, and Reading and Writing Subsections 2 levels below overall score EL student with 9+ years in an EL program, with a CELDT overall score of Intermediate, and Reading and Writing subsections below Intermediate. 30% CST deviations in proficiency: assessment score or proficiency level tracked over the past 3-5 years. A 28
29 Academics Indicator Weight Sub- Indicator 40% GPA < 2.4: based on 6 week progress reports 30% 1 or more courses failed in the current year -OR- Any course grade F or D 30% Student did not pass both semesters of Algebra: List of Algebra classes provided as supplement* -OR- Core course failed in the current year: List of core courses provided as a supplement* A 29
30 Discipline Indicator Weight Sub- Indicator 40% 3 or more infractions for the current year 60% Level of severity: Highest -OR- Types of infractions: List of infractions below Mobility Indicator Weight Sub- Indicator 100% 3 or more moves during the current school year: counted by entry records in enrollment A 30

31 Student-Centric Data Technology Applying Analytic Technology to Enterprise Data Data Warehouse Infrastructure Student Success Metrics Analytics Reports & Dashboard Professional Development Use Analytic Reports Align Resources, Interventions Assess Progress A 31
32 Project Arrow Professional Development Plan Introduction: Data warehousing concepts and early warning system predictors Train the Trainer: The school expert will understand the basics of the data warehouse, the source systems that supply the data, the early warning system predictors & current research. Interpreting Reports to Drive Instructional Decisions. Review Early Warning indicators and apply these measurements to current student data. Applying predictive analysis to the data in support of student success Mechanics of Reporting: School site training on accessing reports; navigating through the reports system; running reports on current students. On-site, job imbedded training: School visits to target individual skills, extend learning for advanced users and to support widespread, masterful use of the data. 2-4 days per site. Enrollment to escholar U: (online learning resource) A Administrators & core team from all sites School designee, district designee Administrators & core team from all sites Administrators & core team from all sites Administrators & core team from all sites Administrators & core team from all sites June 21st-June 23rd June27-29, August 1 August 2-4 September/ school visits /school visits
33 Overall Reports Overall Indicator view shows total combined score of all Early Warning Indicators for a student Total risk score is currently made up of 5 main indicators: 1. 35% of score Attendance 2. 20% of score Assessments 3. 20% of score Academics 4. 15% of score Discipline 5. 10% of score Mobility A 33


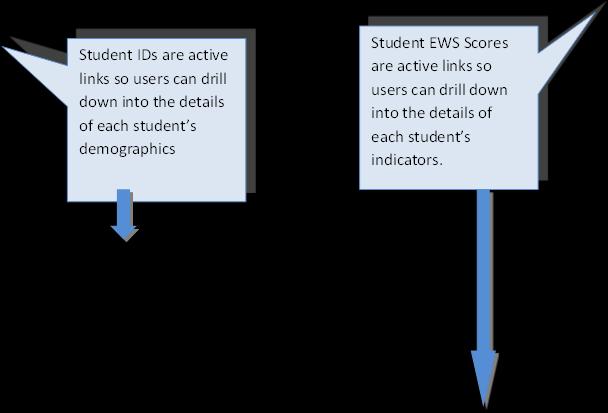
34 Overall Reports A 34

35 Overall Reports The user will see the EWS Overall scores broken down by years in the bar graph. The graphs are interactive & will filter the student list below: A 35

36 Attendance Reports & Dashboard A 36


37 Assessment Reports Test Version: Year of Administration Status: See chart below Y or N Indicators on Assessments Test Description: CAHSEE, CELDT or CST Item Description: English, Math, or Writing & the Admin Date. Standard Achieved: NP, N/A or P A 37


38 Academics Dashboard # of Students with Course Failed OR- D or F Grade # of Students who Failed Algebra OR- Failed a Core Course. A 38


39 Discipline Reports & Dashboard # of Students with 3 or more Infractions # of Students with 1+ infractions with a High Severity Level OR- Designated Infraction Type. A Discipline Infractions & codes defined by SAUSD. 39


40 Mobility Reports & Dashboard A Enrollment Codes, Enrollment Start Dates and District- Defined Entry Enrollment Comments. Exit Codes, Enrollment End Dates and District- Defined Exit Enrollment Comments. 40


41 Cloud Reports for Student Provides student with access to data report and resources through a desktop built in a browser Students/Parent login to access graduation and college readiness reports R 41


42 Cloud Reports for Student R To get to the report, click on the WN cloud box in the lower left and go to Start > Reports > Select the Graduation Flowchart and Educational Options - Admin 42


43 Cloud Reports for Student Student has not passed the CAHSEE and is at risk of not graduating Student lacks credits to graduate R 43

44 Demonstration of Reports & Dashboard Log on to: a. Enter username: ProjectArrow1 b. Enter password: sausd M 44