21 st Annual Needham Growth Conference
|
|
|
- Meryl Houston
- 5 years ago
- Views:
Transcription


1 21 st Annual Needham Growth Conference Greg Woods, President and CEO David S. Smith, CFO January 16, 2019
2 Forward-looking Statements Information included in this presentation may contain forward-looking statements within the meaning of the Private Securities Litigation Reform Act of Forward-looking statements are not statements of historical fact, but rather reflect our current expectations concerning future events and results. These statements may include the use of the words believes, expects, intends, plans, anticipates, likely, continues, may, will and similar expressions to identify forward-looking statements. Such forward-looking statements, including those concerning five-year operating model targets and growth through acquisitions, involve risks, uncertainties and other factors, some of which are beyond the Company s control, which may cause the Company s actual results, performance or achievements to be materially different from those expressed or implied by such forward-looking statements. These risks, uncertainties, and factors include, but are not limited to, those factors set forth in the Company s Annual Report on Form 10-K for the fiscal year ended January 31, 2018 and subsequent filings AstroNova makes with the Securities and Exchange Commission. The Company undertakes no obligation to publicly update or revise any forward-looking statements, whether as a result of new information, future events or otherwise. Investors are cautioned not to unduly rely on such forward-looking statements when evaluating the information in this presentation. 2


3 Innovative, Differentiated Products Unifying Core Technology Data Visualization AstroNova products convert analog and digital data into text, graphics, digital signals High recurring revenue stream Proprietary consumables Diverse global markets Aerospace Product Identification Test & Measurement 3


4 AstroNova Financial Snapshot (Stock price and yield as of 1/9/2019) Russell Microcap Index Recent Price $ Week Range $ $23.95 Market Capitalization $134.9 million Common Stock Outstanding 6.9 million Enterprise Value $150.5 million Book Value per Share (1) $9.73 Annualized Dividend $0.28 per share Yield 1.44% Q3 FY 2019 Financial Highlights Revenue: $34.2 million, up 19% y/y Operating income: $2.4 million, up 45% y/y Operating margin: 6.9%, up 120 bps y/y Diluted EPS: $0.20, down 5% y/y Bookings: $34.2 million, up 10% y/y Backlog: $24.5 million, up 15% (1) (1) As of 10/27/2018 vs. 10/28/2017 (1) As of 11/21/18 4
5 49-Year History of Innovation 1975 First data acquisition recorders 1994 First color label printer 2001 First Aerospace printer 2012 First color inkjet label printer 2013 AOS launched 2015 AstroNova REBRANDING yr accelerated growth plan 1969 Company founded 1983 Nasdaq listing 1994 Grass Technology acquired New Growth Strategy Implemented FY13 Calendar years 2013 Grass Technology divested 2014 Miltope acquired 2015 RITEC acquired 2017 TrojanLabel acquired 2017 Honeywell acquired 5
6 Strategic Transformation ($ thousands) 140,000 ALOT Revenue FY19 Q2 TTM 120, ,000 New Growth Strategy Implemented 80,000 60,000 40,000 20,000 - FY 1992 FY 2002 Fiscal Year FY 2012 FY


7 AstroNova Operating System (AOS) Continuous Improvement Innovation Through operational excellence and lean initiatives, we consistently strive to increase efficiency and enhance margins Stage-Gate methodology accelerates and streamlines product development process One Global Team Building Value We work as a unified organization in a data-driven environment that fosters mutual trust and respect Our customer-centric philosophy ensures we deliver superior quality, delivery, cost and growth 7
8 Financial Highlights 8
9 Revenue Per Employee $450 ($ in thousands) $400 $368 $350 $300 $267 $286 $310 $326 $250 $216 $200 $150 $100 $50 $0 FY 2014 FY 2015 FY 2016 FY 2017 FY 2018 TTM Q3 FY19 AOS Drives Productivity Improvements 9
10 Five-Year Revenue History $140 ($ in millions) Annual Revenue $132 $120 $113 $100 $88 $95 $98 $80 $68 $60 $40 $20 $0 FY 2014 FY 2015 FY 2016 FY 2017 FY 2018 TTM Q3 FY19 10
11 Recent Revenue Growth Annual ($ in millions) ($ in millions) Quarterly $98.4 $ % +29% +23% +19% $32.7 $31.5 $27.5 $25.7 $24.5 $33.8 $34.2 $28.8 FY 2017 FY 2018 TTM Q3 FY 19 Q4 Q1 Q2 Q3 FY'17 FY'18 FY'19 11
12 Q3 FY 2019 Revenue Profile Revenue by Product Type Revenue by Channel ($ in millions) ($ in millions) Service/Other 9% $3.0M International 37% Hardware $13.1M 38% 53% Supplies $18.1M $12.7M 63% Domestic $21.5M Large Recurring Revenue International Revenue +19% y/y 12

13 Worldwide Reach 165 Dealers, Customers in 154 Countries 13

14 Worldwide Installed Base 14
15 Business Overview Reporting Segments Business Units 15
 $67.1 $69.9 $59.8 $49.1 $43.6 10.0% 10.5% 12.1% 13.9% 14.1% $81.7 13.")
16 Product Identification Segment Tabletop and Light Production Label Printers, Specialty Printers, Software, Consumables, and Service Segment Revenue and Operating Profit Margin FY Revenue CAGR: 13.4% $100 $80 $60 $40 $20 ($ in millions) $67.1 $69.9 $59.8 $49.1 $ % 10.5% 12.1% 13.9% 14.1% $ % $0 FY 2013 FY 2014 FY 2015 FY 2016 FY 2017 FY


17 Digital Package Printing: Large, Attractive and Growing Market Advantages of Digital Package Printing Short-run On-demand Ease of data variability Personalization Lower cost 17


18 New Product - Kiaro! QL-120 Launched Worldwide in January 2019 Professional tabletop digital label printer Compact design Highest throughput available in a desktop color label printer Exceptional color accuracy Wide range of capabilities Proprietary CQL Pro advanced labeling software Low total cost of ownership User Friendly. Flexible and Productive. Cost Effective. 18
19 ($ in billions) Digital Package Printing: Disrupting the Packaging Industry Projected Growth of Digitally Printed Labels and Packaging $25.0 $20.0 $15.0 $10.0 $5.0 $13.2 $23.2 $ Source: Smithers Pira, AstroNova Labels represent ~ 15-20% 19

20 Expands Addressable Product ID Market QuickLabel TrojanLabel 20


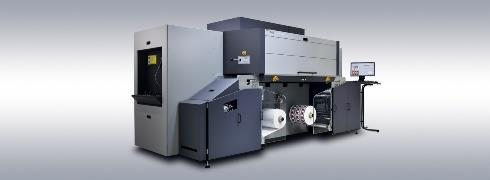
21 TrojanLabel Acquired in February 2017 European manufacturer of digital color label presses and specialty printing systems Products focused on a broad range of end markets Strong presence in EMEA and Asia 50 dealer partners worldwide Profitable and growing Robust R&D pipeline 21

22 Food Safe, Flexible Packaging Solution Introduced at PACK EXPO 2018 Designed for use with the entire range of the TrojanLabel printers Opens new opportunities in food, medical and pharmaceutical packaging markets Flexible packaging lowers material cost, reduces waste, increases consumer convenience and enhances brand differentiation 22


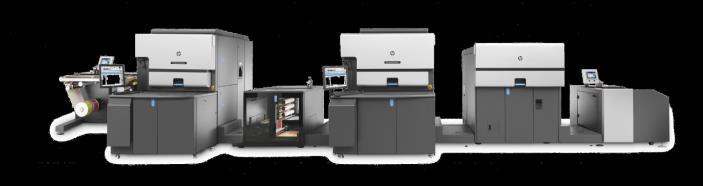
23 Market Leading Portfolio Digital Color Label Printers & Supplies 23


24 Test & Measurement Segment Airborne Printers, Networking Hardware and Data Acquisition Systems Segment Revenue and Operating Profit Margin $40 FY Revenue CAGR: 12.5% $35 $30 $28.6 $27.5 $28.6 $31.7 $25 $20 $17.6 $19.5 $15 $ % 13.6% 19.7% 13.3% 15.4% 11.8% FY18-up 11% over FY17 $5 $0 FY 2013 FY 2014 FY 2015 FY 2016 FY 2017 FY


25 Aerospace Products: Significant Worldwide Opportunity Graphical flight deck and cabin printers Growth Catalysts: Global Aircraft Demand (Upgrades, Service, Supplies) Avionic networking products PMA certified products, parts, supplies Certified FAA repair facility Military Commercial Business/ Regional Jet In-flight Entertainment Leading Customers 25


26 Honeywell Aerospace Product Line Acquisition: Significant Growth Driver ANI to manufacture Honeywell s narrow-format commercial flight deck printers Primarily used on Boeing 737 and Airbus A320 Covers production of new printers as well as repair, support services and supplies Expected to be accretive in first full year of ownership 26

27 14,300 B737s and A320s currently in service 10,000 Entering into service in next 10 years Source: Customer estimates 27
28 B737 and A320 Estimated Annual Production Rate , , , B737 A320 B737 + A320 ~60% of all commercial deliveries Source: Customer estimates 28


29 Real-time Data Acquisition & Analysis Growth Catalysts: Regulatory, Safety Compliance and Quality Assurance New Products Primary Markets Aerospace, transportation, energy, industrial, telemetry Applications Aircraft equipment qualification and certification Monitoring rail and automotive performance Validating fixed plant control instrumentation Wireless remote monitoring and data acquisition Everest EV-5000 TMX DDX100 SmartCorder Daxus DX
30 ANI FY19 Priorities Complete Honeywell & TrojanLabel Integrations Accelerated use of AOS to drive operating income improvements Transition to a unified Global IT and Logistics platform 30
31 Five-Year Growth Strategy (est. FY16) Near-Term: 1-2 Years Accelerate product launches and channel build out Innovate game-changing, technology-based products Automate key processes Build management team depth Pursue smaller bolt-on acquisitions FY17 FY18 Longer-Term: 3-5 Years Focus AOS on improving operating margins and FCF Broaden product lines and recurring revenue opportunities Increase global presence Pursue larger bolt-on acquisitions FY19 FY20 FY21 31
32 Five-Year Operating Model FY 2018 (actual) FY 2021 (targets)* Revenue $113.4M $250M 5-year CAGR 13.1% 17% Operating Margin 4.8% 15% Strategic Driving Force End Market Focus Growth Strategy Management Approach Data Visualization Technology Aerospace, Data Acquisition, Industrial Fast-Moving Consumer Goods (Organic growth of current platforms) + (bolt-on M&A) AstroNova Operating System *Targets dependent on additional acquisitions FY 2021 targets as established in FY

33 Reasons to Invest Leading market positions and brands Continuous improvement culture Expanding global footprint Robust product development pipeline Recurring revenue >50% Track record of successful M&A High Barriers to Entry 33
34 THANK YOU 34
35 Financial Overview 35
36 Q3 and 9M FY 2019 Financial Results Summary In Thousands Except for Per Share Data (Unaudited) Three Months Ended Nine Months Ended October 27, 2018 October 28, 2017 October 27, 2018 October 28, 2017 Revenue $34,196 $28,760 $99,490 $80,701 Gross Profit 13,908 11,794 39,417 31,359 Gross Profit Margin (%) 40.7% 41.0% 39.6% 38.9% Operating Income 2,362 1,632 5,791 3,281 Operating Margin (%) 6.9% 5.7% 5.8% 4.1% Net Income 1,417 1,419 3,425 2,657 Net Income per Common Share Diluted $0.20 $0.21 $0.49 $0.38 Weighted Avg Number of Common Shares Outstanding Diluted 7,167 6,821 7,056 7,078 Dividends Declared per Common Share $0.07 $0.07 $0.21 $
37 Select Consolidated Balance Sheet Data Amounts In Thousands (Unaudited) October 27, 2018 January 31, 2018 Cash and Cash Equivalents $7,816 $10,177 Current Assets $59,877 $62,948 Total Assets $116,056 $122,313 Current Liabilities $21,891 $25,912 Long-Term Debt, net of current portion $14,068 $17,684 Royalty Obligation, net of current portion $10,408 $11,760 Shareholders Equity $67,408 $63,647 37
38 THANK YOU 38