Goals/Mission statement Dynamic Traffic Assignment (DTA) Subcommittee created by the MTF in May, 2010 Merger of DTA and Toll Modeling Subcommittees;
|
|
|
- Osborne Freeman
- 5 years ago
- Views:
Transcription


1 November 7,

2 Goals/Mission statement Dynamic Traffic Assignment (DTA) Subcommittee created by the MTF in May, 2010 Merger of DTA and Toll Modeling Subcommittees; Advanced Traffic Assignment Sub-committee formed in October, 2011 ATA webpage 2

3 By Neelam Fatima ATA Sub-Committee Chair 3
4 Workshop/Survey Development of the requirements (testing criteria) Testing based on selected networks Running the network in Static and dynamic environments Development of ISSTA tool Started calibration of I-95 network Time line 4
5 A. Hypothetical Networks B. Jacksonville Regional Network C. I-95 between Golden Glades and SR 836 with Parallel Arterial Sub-area Network in Miami-Dade County 5

6 Selected by the DTA Sub-committee Extracted from Statewide Model 151 sq. mile 1294 number of nodes 2805 number of links 143 number of zones Running time of Static Assignment VS Dynamic Assignment (Cube Avenue, Transim and DynusT) 6

7 Static Model SERPM sq. mile 1193 number of nodes 2573 number of links 247 number of zones Comparison of run time but also used as case study in the use of ISSTA and calibration 7

8 General Hardware General Software Shortest Path and Path Choice Traffic Flow Model Network Demand Specification Modeling of Advanced Strategies Transit Modeling 8
9 Static Environments Cube Voyager Dynamic Environments Cube Avenue Transims DynusT 9
10 Signal control modeling Traffic measures TAZ representation for DTA modeling Fine grained OD estimation Calibration Convergence Running Time 10

11 11
12 12
13 13 ITS Modeling and Dynamic Traffic Assignment By Mohammed Hadi, Ph.D., PE Florida International University Presented at the Advanced Traffic Assignment Meeting November 7, 2011
14 14 Background Need to assess the benefits and costs of ITS for operations and planning in Florida FITSEVAL developed in Funded by FDOT Research Center A joint FDOT System Planning Office and FDOT ITS Section effort Based on static assignment and analytical models Being extended to include DTA and analysis based on real-world data
15 15 FITSEVAL Overview A tool developed as part of the FSUTMS environment FSUTMS is the approved demand modeling environment in Florida No need for file conversion Use calibrated regional models Flexible and extendable evaluation environment Up-to-date methods and parameters Powerful data management, modeling, and interfaces
16 16 FITSEVAL Utilization FITSEVAL can support FDOT and MPO decisions Benefits of ITS versus other alternatives such as geometry improvements as part of the long range and short range plans It can also be used to assess ITS agency operation benefits The original FITSEVAL is a sketch planning evaluation tool but has some advanced modeling capabilities For example it utilizes queuing theory and allow the users to enter the incident management attributes in the region More detailed operational and data analysis being introduced for design and operation purposes
17 17 Evaluated ITS Deployment Ramp Metering Incident Management Systems Highway Advisory Radio (HAR) and Dynamic Message Signs (DMS) Advanced Travel Information Systems Managed Lanes (HOT and tool lanes) Smart Work Zones Road Weather Information Systems Signal Control Transit Vehicle Signal Priority Emergency Vehicle Signal Priority Monitoring and Management of Fixed Route Transit Transit Information Systems Transit Security Systems Transit Electronic Payment Systems
18 18 Performance Measures Vehicle miles of travel (VMT) Vehicle hours of travel (VHT) Average speed Number of accidents Fatality Injury Property damage only Fuel consumption (gallons) Monetary benefits to users and/or agency, as appropriate Emission (gm) Hydrocarbon Carbon monoxide Oxides of nitrogen
19 19 Evaluation Methods A method developed for each component based on review and assessment of methods used in the past Default ITS impact parameters derived based on a review of previous evaluation studies, USDOT benefit database and the values used in existing ITS planning tools Costs were obtained based on surveys of agencies in Florida The user can change the default ITS impact parameters and perform sensitivity analysis

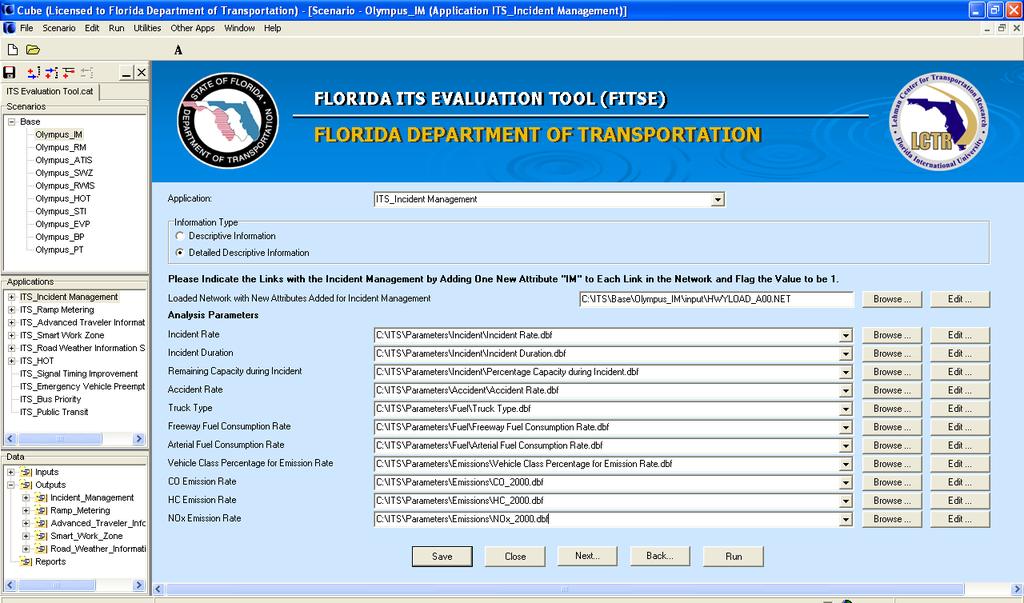
20 User Interface 20

21 Visualization of Performance 21
22 22 Original Development Status Project completed in December 2008 Presentations, webinars, and four day workshop completed. A second workshop planned for 2012 Integrated with the SERPM model the largest model in Florida Integration with other regional models is being automated by FDOT
23 23 Recent Application FDOT D4 required B/C analysis for information sharing with FHP and arterial DMS Other components of FDOT D4 had already been evaluated The two components were not originally coded in FITSEVAL The tool was easily modified to allow the evaluation Additional information of the use of information was gathered from FHP The tool allowed very effective and efficient evaluation
24 24 Extended FITSEVAL On-going effort Utilization of archived data combined with simulation/dta to estimate the performance of the transportation systems with and without ITS Extension initially only applied Freeway ITS modules Inclusion of EPA MOVE model parameters for environmental impact estimations Expected completion: Summer 2012
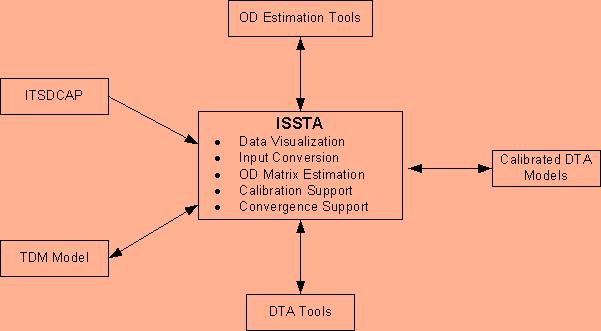
25 25 Data Capture Tool ITSDCAP ITS Data Capture and Performance Management Tool Capture, archive, and analyze data from multiple sources Provide support of FITSEVAL and model calibration and validation Estimate parameters based on ITS data Incident management parameters Managed lane parameters Ramp metering benefits Work zone and weather impacts DMS benefits
26 26 Data from Multiple Sources SunGuide data (TSS, TVT data, incident, DMS, etc.) Central data warehouse Statistics office data Weather data D4 RWIS, road weather agencies Managed lane dynamic congestion pricing rates Work zones Crash data/car System 511 data


27 27 DTA/Simulation Support Currently investigating replacing static assignment with Dynamic Traffic assignment in some ITS applications Allows more detailed analysis and decision support of traffic operations


28 28 ITSDCAP Data (Future) Transit Arterial IntelliDrive Private Sector Data Evaluated ITS and Benefit-Cost Enhanced FITSEVAL Traffic Models Demand Macro Meso Micro Data (Current Project) ITS Traffic Detectors Statistic Office Pricing Data Work Zone Data Events Weather Incident Data Crash Data DMS/HAR Activation 511 Data RCI Data ITSDCAP FITSEVAL Support Data Capture DSS Support Traffic Modelling Support Visulization Performance Measures Delay Travel Time Travel Time Reliability Safety Environment Others Strategies Toll Lane Incident Management Traveler Information Smart Workzone Ramp Metering RWIS Special Events Future - Transit - Arterial - IntelliDrive Data Fusion Performance Measurements Strategy Assessment and Recommendations Standard Location Referencing Future Decision Support Tools Existing Products MOVE SSAM SHRP2 Safety Analyst IHSDM
29 Questions/Comments 29