EVALUATION OF AN ONLINE INTELLIGENT TRANSPORTATION SYSTEM (ITS) ASSET MANAGEMENT SYSTEM
|
|
|
- Bertram Marshall
- 6 years ago
- Views:
Transcription

1 Clemson University TigerPrints All Theses Theses EVALUATION OF AN ONLINE INTELLIGENT TRANSPORTATION SYSTEM (ITS) ASSET MANAGEMENT SYSTEM Tahera Anjuman Clemson University, Follow this and additional works at: Part of the Civil Engineering Commons Recommended Citation Anjuman, Tahera, "EVALUATION OF AN ONLINE INTELLIGENT TRANSPORTATION SYSTEM (ITS) ASSET MANAGEMENT SYSTEM" (2009). All Theses. Paper 746. This Thesis is brought to you for free and open access by the Theses at TigerPrints. It has been accepted for inclusion in All Theses by an authorized administrator of TigerPrints. For more information, please contact
2 EVALUATION OF AN ONLINE INTELLIGENT TRANSPORTATION SYSTEM (ITS) ASSET MANAGEMENT SYSTEM A Thesis Presented to the Graduate School of Clemson University In Partial Fulfillment of the Requirements for the Degree Master of Science Civil Engineering by Tahera Anjuman December 2009 Accepted by: Dr. Mashrur A. Chowdhury, Committee Chair Dr. Jennifer H. Ogle Dr. Scott Brame
3 ABSTRACT Intelligent Transportation System (ITS) enhances the performance of modern transportation systems by improving the reliability of travel times and reducing the risk of collisions and injuries. Recently, many public agencies have expressed a need for an ITS asset management system that will effectively and efficiently meet their requirements of managing associated resources, which often includes technologically sophisticated devices, computer hardware and software, and communications infrastructure. To address this need, the author evaluated different asset management systems for their potential efficacy to support public agencies requirements for an ITS asset management system. These requirements were identified through a nationwide survey of public agencies. This thesis included an evaluation of NexusWorx, a customized ITS asset management system along with the Enterprise Based GIS and Microsoft Access, based on a case study conducted on a selected site in Spartanburg, South Carolina. Multi-attribute utility analysis was performed to identify the relative utility of these three potential ITS asset management system. The capabilities of three systems were evaluated based on their performance and finally, a comprehensive evaluation was performed considering system capabilities and costs. The multi-attribute utility analysis revealed that Enterprise based GIS received the highest rating in terms of ii
4 system capability. In the comprehensive evaluation, Nexusworx and Enterprise based GIS have received similar utility. This study concludes that if an agency has an Enterprise based GIS system, it would be effective to use ITS asset management on top of its existing system. If any agency does not have Enterprise based GIS system, they can either adopt a customized ITS asset management system or they might consider to develop an Enterprise based GIS supported asset management system for ITS, which will eventually be useful for managing other assets as well. House of Quality (HQ) analysis was performed as another evaluation method that visually demonstrated similar findings as the multi-attribute utility analysis. iii
5 DEDICATION This thesis is dedicated to my husband, Chowdhury Kawsar Arefin Siddiqui and my father Md. Idris and my mother Sufia Akhter. Their love and support was the driving force for my degree. iv
6 ACKNOWLEDGEMENTS I would first like to thank my advisor Dr. Mashrur Chowdhury for his guidance, encouragement, trust, support, and knowledge. Also I would like to thank Dr. Scott Brame for his guidance and showing me the directions of my research. I would like to show my gratitude to Dr. Jennifer Ogle for her valuable comments. I would also thank my parents for their faith on me and their patience and support. Also I appreciate my fellow students, Lee Tupper, Yan Zhou and Xueying Kang, for their kind support and help throughout my research. v
7 TABLE OF CONTENT Page TITLE PAGE... i ABSTRACT... ii DEDICATION... iv ACKNOWLEDGEMENTS... v LIST OF TABLES... xi LIST OF FIGURES... xii CHAPTER 1. CHAPTER: INTRODUCTION BACKGROUND Asset Management in Transportation Asset Management in ITS PROBLEM STATEMENT RESEARCH OBJECTIVES vi
8 1.4 THESIS OUTLINE CHAPTER: LITERATURE REVIEW ASSET MANAGEMENT FOR TRANSPORTATION Road and Highway Asset Management Pavement Asset Management Bridge Management Maintenance of Assets DIFFERENT MODELS FOR ASSET MANAGEMENT ASSET MANAGEMENT FOR ITS SUMMARY CHAPTER: METHODOLOGY DEVELOPING REQUIREMENTS FOR ITS ASSET MANAGEMENT SYSTEM CASE STUDY Network Design for WiFi and WiMax EVALUATION OF ITS ASSET MANAGEMENT SYSTEMS vii
9 3.4 EVALUATION OF DIFFERENT GROUPS OF ASSET MANAGEMENT SYSTEM AVAILABLE FOR ITS The Evaluation Team Development Study Site Selection Test Plan Development Testing the Systems The Rating of the Systems MULTI-ATTRIBUTE UTILITY MODEL ANALYSIS Finding the Goals Selection of MOE Defining Alternatives Multi-Attribute Utility Analysis Selecting the Best Alternatives QUALITY DEPLOYMENT FUNCTION ANALYSIS Customer Requirements Technical Requirements Planning Matrix viii
10 3.6.4 Interrelationship Matrix Technical Correlation Matrix Technical Properties and Target CHAPTER: ANALYSIS REQUIREMENTS FOR ITS ASSET MANAGEMENT SYSTEMS CASE STUDY FOR COMMUNICATION SYSTEM WiFi Infrastructure Network WiFi Mesh Network WiMAX Infrastructure Models WiMAX Mesh Network EVALUATION OF ITS ASSET MANAGEMENT SYSTEM Evaluation Based on System Capabilities Cost Evaluation MULTI-ATTRIBUTE UTILITY ANALYSIS Performance Rating for the MOEs The Utilities of MOE s Total Utility ix
11 4.5 SUMMARY OF MULTI-UTILITY FOR ALTERNATIVES QUALITY FUNCTION DEPLOYMENT CHAPTER: CONCLUSIONS AND RECOMMENDATIONS CONCLUSIONS RECOMMENDATIONS APPENDICES A: The Initial Survey Questionnaire for the requirements development B: The As-Built Drawing for the Study Site C: Cost Estimation Details for NexusWorx REFERENCES x
12 LIST OF TABLES Table 3.1 Rating Scale for the Systems Table 4.1 The Requirements for an ITS Asset Management System Table 4.2 Example of the Calculation of Distance between Nodes (in miles).. 68 Table 4.3 The Summary of the WiFi Network Table 4.4 The Summary of the WiMAX Network Table 4.5 Relative Ratings for the System Capabilities Table 4.6 Annual and Capital Costs for Different Options Table 4.7 Annual Costs for Different Options Table 4.8 Cost and Relative Ratings Table 4.9 Relative Rating for Costs Table 4.10 Performance Rating for MOE s Table 4.11 The Utilities for the MOE Considering System Capabilities Table 4.12 Utilities for the MOE (Considering Costs) Table 4.13 Multi-Attribute Utility Analysis (Considering System Capabilities). 94 Table 4.14 Multi-Attribute Utility Analysis (Considering Comprehensive Evaluation) Table 4.15 Summary of the MUA for the Alternatives xi
13 LIST OF FIGURES Figure 1.1 System Components for Transportation Asset Management... 3 Figure 3.1 Research Methodology Figure 3.2 The MOEs for the Evaluation of NexusWorx Figure 3.3 As-Built Drawing For the ITS Facilities (Source: SCDOT) Figure 3.4 The Process for Multi-Attribute Utility Model Figure 3.5 A sample template for House of Quality Figure 4.1 Traffic Surveillance Devices in Spartanburg, South Carolina Figure 4.2 WiMAX Network Design for the Traffic Surveillance Devices in Spartanburg, South Carolina Figure 4.3 WiFi Infrastructure Network for Spartanburg, South Carolina Figure 4.4 WiFi Mesh Network for Spartanburg, South Carolina Figure 4.5 WiMAX Infrastructure Network for Spartanburg, SC Figure 4.6 WiMAX Mesh Network for Spartanburg, SC Figure 4.7 Performance Rating (PR) for the MOEs Figure 4.8 Summary of Multi-Attribute Utility Analysis Figure 4.9 The House of Quality for NexusWorx xii
14 1. CHAPTER: INTRODUCTION 1.1 BACKGROUND Intelligent Transportation System (ITS) enhances the performance of modern transportation systems through improved reliability in travel times and in the reduction of the risk of collisions and injuries. Indeed the recent expansion of ITS infrastructure has attracted the attention of public agencies wishing to purchase systems for ITS asset management. ITS asset management differs from traditional asset management applications in its features and characteristics, specifically with the inclusion of electronic devices and communication systems. The general transportation asset management (TAM) comprises the traditional components of assets for transportation such as highways, pavements, bridges, etc. The decades old TAM plan currently in use by public agencies is not entirely applicable for the ITS asset management. Therefore, according to Small (2000), there is a need for a customized asset management system that can serve ITS operations and maintenance and can be integrated with other asset management systems (e.g. integration of road and bridge asset management). Many agencies have been proactive in identifying or adopting an effective asset management system that will accommodate existing infrastructure and manage their planned ITS infrastructure expansion. 1
15 1.1.1 Asset Management in Transportation The present transportation network has a great responsibility to reduce congestion, cater to the increased need resulting from increased vehicle miles of travel and the increased rate of demand for the facilities. Such a road network infrastructure encompassing roadside elements, control devices, lights, etc. requires proper maintenance and management. Consequently, such an extensive transportation asset network requires forward looking management policies to not only adequately manage these assets, but to reduce the overall life-cycle cost for operation and maintenance. Transportation Asset Management (TAM) is one of the major challenges for the transportation agencies. According to the American Association of State Highway and Transportation Officials (AASHTO) Subcommittee on Asset Management, "Transportation asset management is a strategic and systematic process of operating, maintaining, upgrading, and expanding physical assets effectively through their life cycle. It focuses on business and engineering practices for resource allocation and utilization, with the objective of better decision making based upon quality information and well defined objectives" (NCHRP, 2002). This definition of TAM highlights the purpose of this system as focusing all aspects of traditional asset management systems into a single methodology, and also addresses the integration between decision makers 2


16 and practitioners. TAM requires an integrated approach among all stakeholders to make the best use of existing traffic management assets. An Asset Management Primer, developed by the FHWA in 1999, described the characteristics of a transportation asset management as a systematic, fact-based, and reproducible decision-making approach for analyzing the tradeoffs between investments and improvement decisions at the system and project levels. Figure 1.1 shows the generic asset management components that can be the initial point for any TAM. This matrices also supports both the decision making process at various project levels and the budget allocation process. Figure 1.1 System Components for Transportation Asset Management Source: Asset Management Data Collection for Supporting Decision Processes, FHWA 3
17 The TAM assists in sustaining the present operational and maintenance demands while the practitioners and decision makers plan for supporting future demand at a minimal cost. Consequently, TAM, with its broad-based and flexible design, should be applied during every step of the planning process as it enables decision makers to frame their decision making so as to best allocate specific resources at different sectors of transportation infrastructure. The TAM during the planning process has the potential to maximize the performance of the transportation systems, minimize the overall life cycle costs of the infrastructures, provide cost effective and efficient decision making, generate better use of existing transportation facilities and allocate facilities to meet future needs Asset Management in ITS ITS constructed modern transportation systems perform proficiently in many facets including the applications for incident management, collision avoidance and traveler information systems. ITS is a relatively new concept in transportation and there is no nationwide standard for ITS asset management. Though the general asset management procedure for transportation systems can be followed to some extent for the ITS facilities, some elements require specialized treatment. Because of these limitations, the general TAM is not entirely applicable for asset management use in the ITS sector. 4
18 The major concern of asset management use in ITS is to support users in collecting ITS asset inventory and inspection data, in formulating networkwide preservation and improvement policies for use in evaluating the needs of each site or location in a network, and in developing recommendations for identifying projects to include in an agency's capital plan for deriving the maximum benefits from limited funds. Additionally, it is important to integrate both user convenience, preservation of investment to produce budgetary, maintenance, and program policies, and to provide a systematic procedure for the allocation of resources to the preservation and improvement of the network ITS assets. Some of the major expectations of a typical asset management system for ITS are listed below. Specifically the system should: Enable deployment of an ITS Facility Management application capable of documenting the wide variety of these system components (assets) that can support an enterprise based environment. It should also be compatible with the legacy database system as the agencies may need to integrate different databases for decision-making purposes. Permit incorporation of the functionality of the telecom systems in ITS facility management application with the ability to track electrical systems and wireless connectivity. Telecom facility management products are designed to document communication network assets but are designed to support the type of assets used in ITS subsystems such as camera, radar, dynamic 5
19 message signs, and wireless networks. Therefore such systems must be modified for use on intelligent transportation systems. Ensure that the asset management application is capable of tracking physical and logical connectivity (defined as connections within the cable with logical fibers defined as a circuit activated on physical fibers within the network) through the network and provide the user with a simple method to follow circuits from the origination point to the termination point. Augment the ability to track communication circuits to assist with managing circuit utilization. Cable complements or cable counts must be summarized in a typical ITS asset management system. Cable complements provide an easy method to follow circuits from the origination point to the termination point, resulting in useful information. Cable complements are the time-tested standard format used by telecommunication companies to manage complex cable networks. Cable complements provide sheath-count information as well as: cable sheath data such as actual cable length, year installed, direction to the regional traffic management center (RTMC), total strand quantity, and conductor type; cable sheath-count position; optical fiber circuits; fiber origination location and patch panel position; and 6
20 other fiber data, such as reserved fiber reference information, idle fiber (splice through from other cables but not activated), and dead fiber (not spliced to other cables). Provide the ability to manage equipment rack space and a means to quickly identify equipment placements and to associate the facility management applications with the communications equipment to a specific equipment site (e.g., RTMC or communications shelter), the equipment location (row or bay within the equipment room), the specific equipment rack, and the equipment position within the rack. Provide the ability to link items such as detailed as-built drawings, typical or detail drawings, and pictures to graphical features within the product. Utilizing this functionality to manage as-built drawings will save the organization time by providing quick access to the most current information available for a specific item or location. Provide the organization the ability to manage the occupancy of both fiber optic and electrical conduits supporting the ITS field equipment. Provide the ability of facility management applications to identify individual conduits and multi-cell (inner duct) associated with a multi-conduit system, as well as associates a fiber optic cable to a specific conduit or inner duct. Provide the ability to associate access points to conduits and link access point details to the feature. Access points consist of splice vaults and pull boxes and provide access to the fiber optic and electrical conduit subsystems. 7
21 Access point detail drawings (butterfly or lay down drawings) provide specific information about the facility including structural information, duct assignment, splice-case placements, and a location map. These drawing files should be linked to the feature for quick reference. ITS organizations need the ITS Facility Management application to identify the location of fiber breaks or cuts. The application must trace logical fibers and optical circuits, highlight the damaged network features, and present a fiber trace span detail listing all connected features. The ITS application needs to have the ability to store actual loss data to allow for electronic storage of test results that will allow the system to edit or make changes to fiber optic cable features stored in the system. Some changes may result from emergency restoration caused from cable cuts. Emergency repairs can require the placement of new splices or the insertion of new cable segments to complete a repair. In general an asset management tool for ITS should have the capability to make the system more efficient and cost effective with greater performance capability. These capabilities will help an organization managing their assets in a more systematic way and will facilitate access by authorized personnel. 1.2 PROBLEM STATEMENT ITS consists of field devices, including telecommunication and information systems, and various subsystems. These subsystems consist of 8
22 large complex cable networks, electronics and communication devices, wireless networks, radar, cameras (close circuit television known as CCTV) and other field devices. These subsystems and field devices are often replaced due to maintenance or required updates and system expansion. A large regional ITS infrastructure with various subsystems requires the proper management and integration among the subsystems in order to make them perform effectively and efficiently. Otherwise, the quality of the ITS system will be substantially degraded requiring more time to troubleshoot the system, increase the frequency of interruptions, and raise operating costs. ITS facility management can help with these issues and assists in a timely manner to expand and rearrange the system s performance to a desired level. A web based asset management system will be most effective as it will allow instantaneous access to the database. It will also allow immediate updates of the database that will keep the database more useful. ITS facilities require an asset management system which will compile information regarding the entire network s asset. This will help in managing the assets, maintaining and operating the system, and in decision making about expansion and rearrangement. One of the major requirements for the asset management tool is its capability for deployment in the enterprise-wide environment. Most agencies need this flexibility for their system as they often need access to the same database for planning and decision making purposes. 9
23 There is no doubt that an asset management (AM) system is an obvious requirement for the ever-expanding ITS systems. The support of an expanding and changing ITS infrastructure requires the selection of an appropriate asset management system that satisfies users requirements. An evaluation of available ITS asset management system would facilitate the adoption of these systems by public agencies. In particular, a web based asset management system with the capability of supporting enterprise based environment would be desirable for the decision makers possessing ITS systems. The Florida Department of Transportation (FDOT), evaluated three applications supporting asset management for ITS and determined that the NexusWorx fiber management tool for Intelligent Transportation system (FMT- ITS) would best serve their need for managing the ITS features. NexusWorx was found to have more capabilities than the other two applications to support ITS asset management. Basically introduced as a geospatial solution for the telecommunications and utility industries, NexusWorx was later customized for the ITS asset management (FDOT, 2006). However, there is a need to evaluate NexusWorx as a representative of customized ITS AM system for its suitability in the enterprise based environment in contrast to Enterprise based GIS systems and general data management systems such as Microsoft Access. Enterprise based GIS with some plug-ins to support ITS asset management could be a viable alternative to customized ITS AM systems as 10
24 most agencies already have deployed Enterprise based GIS tool. Microsoft Access could serve as a data management system when only data inventory is of interest. 1.3 RESEARCH OBJECTIVES This focus of this study was the evaluation of a customized ITS AM system in addition to other potential alternatives for ITS. NexusWorx, a representative of customized ITS asset management system previously known as FMT-ITS, was evaluated along with Enterprise based GIS and Microsoft Access. This study encompassed the following three objectives: Development of requirements for an ITS asset management system for efficient planning, design and operations. Development of a case study depicting ITS assets for a wireless communication network. Evaluation of an ITS asset management system in contrast to an Enterprise based GIS system and a widely used data management system. 1.4 THESIS OUTLINE This thesis synthesizes the research conducted through a literature review, and analysis to support research objectives. The remaining parts of the thesis are organized as follows. Chapter Two concerns a literature review, which synthesizes relevant studies on traditional asset management in 11
25 transportation, various models for transportation asset management and asset management approaches for ITS. Chapter Three discusses the research methodology utilized to evaluate a web based customized ITS AM system next to an Enterprise based GIS options and typical data management system. Chapter Four provides the evaluation outcomes and Chapter five presents the conclusion and recommendations. 12
26 2. CHAPTER: LITERATURE REVIEW Asset management is a strategy to cost effectively managing transportation systems that incorporate operation, maintenance and renewal of new facilities in a systematic manner. Transportation systems consist of different components and divisions, such as highways, pavement, airports, waterways, bridges, and intelligent transportation systems. In order to manage the assets of a transportation system, it is necessary to consider the system as a whole. Asset management is an integrative management process that is developed for individual divisions of transportation systems, such as pavement management, highway management or bridge management. Still there is a room for improvement of the entire system by coordinating different divisions. In this respect, asset management not only focuses on the incorporation of the areas of transportation but it also allows for a multi-year perspective to achieve the goal of asset management for the entire transportation system. Asset management is defined by the Federal Highway Administration (1999), as a business process and a decision-making framework that covers an extended time horizon, draws from costs as well as engineering, and considers a broad range of assets. The asset management approach incorporates the economic assessment of trade-offs among alternative investment options and uses this information to help make cost-effective investment decisions It is clear that asset management is a multi-disciplinary 13
27 field where it blends the knowledge of the engineers, planners, decisionmakers and even economists to achieve the goals of developing an efficient and systematic management system. Generally, the transportation industry consists of expensive infrastructure which requires maintenance over a period of time. Furthermore, infrastructure maintenance requires efficient management for decision making, repair, installation, and renewal of infrastructure components (AASHTO, 2009). Identification of these processes became one of the major challenges for the management of the transportation industry with financing as the major constraint to consider. Without adequate financing, it is not possible to maintain the system in a timely and appropriate fashion. This is where asset management can play a critical role in managing and maintaining the system in an efficient and effective manner to meet the needs of the future. Such a system will allow the maintenance of the assets throughout their life cycle. Proper management will facilitate the allocation of future expansion and development of assets. Local and federal agencies responsible for transportation infrastructure such as federal administrations, municipalities, Council of Government (COGs), Metropolitan Planning Organization (MPOs), and Department of Transportation (DOT s) should understand the present and future conditions of their assets. 14
28 According to the Governmental Accounting Standards Board (GASB) statement 34 FHWA (2000), GASB requires that governments maintain an inventory of infrastructure assets including a condition assessment at least every three years, and estimates of the annual amount needed to maintain the assets. These requirements are intended to identify disinvestment in public infrastructure assets. GASB also requires that the government agency document that it is providing sufficient maintenance effort to preserve infrastructure assets. The FHWA (2000) statement basically emphasizes that all local and state agencies should begin to report the values of their assets to the government and to accomplish this agencies should have a systematic asset management process which will enhance the reporting system. Presently, engineers and decision makers are facing the challenges of managing transportation system assets throughout the world. plans and strategies should be made to avoid the limitations of inadequate funds and resources that will result without proper management. The best way to do is through the asset management approach. An asset management system has the potential to handle current and future challenges of managing and integrating transportation applications (AASHTO, 2009). 2.1 ASSET MANAGEMENT FOR TRANSPORTATION For more than a century, building a new facility or constructing a new roadway was the major response to meet the increasing demand of the 15
29 transportation industry (AASHTO, 2002). Billions of dollars have been spent toward these efforts, but now operation and maintenance issues have became paramount as the infrastructure has begun to age. The transportation industry needs a systematic and cost effective approach to maintain and operate existing and future infrastructure. The industry has no choice except to adopt a modern, system-wide approach to maintain and operate the current infrastructure. Considering that asset management is a new concept, especially in the transportation industry, a system wide approach to coordinate and develop this type of management is very important. The understanding of these concepts of asset management also varies between decision makers and organizations, thus making implementation more difficult (AASHTO 2002). Engineers can play a significant role in overcoming this obstacle by developing a systematic approach that seeks inputs from policy makers, field personnel, budget and accounting officers and planners. Asset management can be applied to any type of management system. To better understand these diverse transportation divisions, it is essential to define transportation asset management. According to the American Association of State Highway and Transportation (AASHTO) Officials', Subcommittee on Asset Management, transportation asset management is a strategic and systematic process for operation, maintenance, upgrade, and 16
30 expansion of physical assets effectively throughout their lifecycle (AASHTO, 2006). Transportation asset management also focuses on business and engineering practices for resource allocation and utilization. This focus enhances the decision making process based on quality information and well defined objectives. It is evident that AASHTO gives significant emphasis on the maintenance of the assets to make it efficient, and serve their purposes in a better way throughout their life cycle. The goal of transportation asset management is to achieve the satisfaction of the users throughout the lifecycle of the infrastructure by providing the desired level of services in a cost efficient manner. This research is mainly focused on surface transportation asset management which consists of the roadway, pavement, bridge, highway, traffic operations infrastructures, and intelligent transportation system components. These surface transportation components comprise an expensive infrastructure. This infrastructure requires proper management and planning if future expansion and operation hopes to achieve the user s desired outcome. Since surface transportation infrastructure is administered by a significant number of diverse transportation organizations, there is an urgent need for an integrated and coordinated approach to manage all of the available resources. It also requires a robust plan to meet the future demands of the users while at the same time managing the limited resources available 17
31 according to Larson et al. (2000). This raises the issue of managing available resources in an efficient and organized manner to maximize the user s satisfaction. In order to meet these requirements the managers of the transportation system need to provide more attention to managing the huge infrastructure already in place. If these existing facilities are not managed in a systematic way, it will be difficult to meet the future demand on the infrastructure. Therefore, maximizing the benefits of a management system has become an absolute must to maintain and operate the present and future assets of surface transportation. The transport system consists of several divisions, and each division is made up of various facilities and assets. All the assets of a division are subject to decay and deterioration with time and as a result these divisions require significant attention to manage their assets. However, these assets are very different from each other and require varying approaches to manage efficiently Road and Highway Asset Management The USA interstate highway system compared to other countries is complete and capable of providing coverage to the whole nation. Therefore, prevention, maintenance and operation of the existing roadway system are more important than building new roadways. According to Better Roads Publications (2000), the nation s focus has been shifted to cost effective asset management process in order to maintain, operate, expand or allow for the 18
32 timely replacement of the existing highway system. The authors of Better Roads Publications (2000) also emphasized the distribution of proper resources and planning ahead to achieve these goals. Engineering knowledge along with the management, operation and planning for the assets to meet future demand is the key feature for maintaining the current transportation infrastructure. Typically, the assets consist of highways, pavement, vehicles, and construction resources as well as human resources. For proper management, analysis of the cost, performance and the consequences of past, present and future conditions are the major issues for asset management systems Pavement Asset Management Pavement asset management is another major division of roadway asset management. Pavements are subjected to rapid wear and tear as most of the pavements are used on a regular basis. With the intention to provide users a desired level of service; a comprehensive maintenance and operational strategy are required in a timely fashion. In order to make this strategy a reality, AASHTO (2000) prioritized and identified the investment areas by considering budget constraints. AASHTO also proposed a peer exchange approach for pavement asset management systems. This approach involves sharing knowledge with peers in order to evolve new technologies and programs such as software for effective asset 19
33 management programs. In addition to this, they also proposed other guidelines to develop various procedures to obtain reliable information. These guidelines will strengthen pavement links with maintenance and operations. Implementation of pavement management tools will utilize program and technologies for future planning of the agencies. In this aspect, the approach will also have the capability to support the decision making process by using different engineering applications to address the pavement asset management for present and future requirements. According to Dewan and Smith (2003) asset management reports can be prepared from local agency pavement asset management system as one of the major components of asset management is documenting asset inventory and their condition. Dewan and Smith(2003) has claimed that this reporting scheme will help the pavement management agency to attract the attention of taxpayer and lawmakers, which will eventually provide the agency adequate funding to maintain their assets at a desirable state Bridge Management Bridges are one of the most expensive pieces of infrastructure that make up the surface transportation system. Recently, bridge management systems are getting more attention. At the time of placement it was typically assumed that the bridges would serve their life cycle sufficiently without much repair and renewal work. Most of the maintenance work for the bridges were ignored or 20
34 avoided and due to the increased traffic, the existing bridges need to be maintained to prevent rapid deterioration. The enormous cost associated with the building and maintenance of these bridges makes bridge management critical and only a proper asset management system can address these issues. Recently, Godzwon (2004) stated that an effective bridge asset management strategy focuses on treatment strategies, deterioration modeling, present and future cost modeling, life cycle cost analysis, bridge inspection, budget analysis and allocations. The application of modern technologies like GIS plays a crucial role in achieving bridge asset management strategies. Furthermore, the strategy for emergency management and adequate planning should be conducted in advance. Additional care and steps should be taken to enhance the rehabilitation and retrofitting which will ensure the usefulness of the bridges throughout their life cycle. The bridge management strategy should confirm timely repair and maintenance to avoid major reconstruction. Regular inspections of bridges are an important bridge management strategy that can play a vital role in the early detection of damage or needed repairs. The inspections should be integrated into a proper monitoring schedule of the overall bridge condition. In addition to this, emphasis should be given to the analysis of cost, life cycle costs and the ease of prioritization of budget funds for the bridge asset management so that future extension of bridge becomes easier. 21
35 2.1.4 Maintenance of Assets Preservation of assets is one of the major tasks in managing the assets of any industry. Most of the agencies have changed their focus to maintain the resources rather than building new facilities. In this way, agencies cope with the demand of traffic and travel. Maintenance and repair will keep the facilities effective throughout their life cycle and improve their performance as well. Previously, various studies have been performed on transportation management systems to observe the effect of maintenance on this process as mentioned by Purvis (1999). This process also integrates the maintenance work of different facilities and is tested for the improvement of the overall asset management system. In the past, bridge maintenance programs were considered a very expensive process and often ignored. Today agencies pay more attention to managing and making the bridges effective throughout their anticipated life time. A study by Purvis (1999) showed that it will be beneficial if preventive maintenance management can be integrated into a traditional bridge management system. The author also described the factors that should be considered in developing cost effective preventive maintenance decisions for the maintenance of bridges. In addition, it is necessary to develop some modifications in traditional bridge management systems that will allow implementing the preventive maintenance successfully. 22
36 Similarly, Small (2000) demonstrated an integrated approach for the management of bridge and pavement asset management systems. This study illustrated the necessity of an integrated approach for coordination among the different divisions rather than individual asset management systems. Given the variety of challenges for typical asset management systems, a major administrative issue is budget allocation. Tools and an appropriate framework for the decision makers are required for them to efficiently allocate funds. A framework for decision makers was presented by Small (2000) that shows how to develop the basics that will reflect the decision variables for comprehensive and integrated asset management for transportation assets. Zhang and Gao (2008) presented a robust optimizing process applicable at the project level for maintenance budget planning. They showed that proper planning of the maintenance budget at the project level can eliminate substantial uncertainties that are most common and often responsible for failure to support the maintenance of the facility. They presented an approach to estimate the future budget for an optimal maintenance and repair of pavement by using a robust optimization technique. They claimed that the robust optimization method is computationally traceable and the solution generated from the method can deliver realistic budget estimation. 23
37 2.2 DIFFERENT MODELS FOR ASSET MANAGEMENT Asset management is a very complicated process as it involves personnel and input from different and diverse backgrounds. There have been a lot of studies for developing models to support asset management for different divisions of transportation systems. Some studies considered single divisions and some models integrated various divisions together in order to provide a better decision support system for budget allocation, maintenance, and overall asset management systems. Performance measurement of infrastructure and overall maintenance minimization of the system is another vital part of an asset management system. Durango-Cohen (2006) developed a framework based on time series analysis to predict the performance and to optimize the maintenance of the infrastructure. The author claimed that in developed countries most infrastructures reaches its lifespan and needs repairs and maintenance, but limited budgets become a major constraint. Therefore, an optimization in maintenance and repair is essential. Considering these facts the author has proposed a framework to support the resource allocation efficiently. This framework shows how inspection technology can be effective on minimizing the overall life cycle cost of infrastructure. Based on the condition of the asset and the cost forecasting, proposed framework can guide the maintenance and repair decisions for transportation facilities. 24
38 Different agencies are considering integrating different asset management systems and sharing a common database. This is mainly because of scare resources and its proper allocation. If all the agencies are integrated, then it will be easier to make maintenance and repair decisions based on the overall condition of resources and assets and then prioritize them. Often it becomes cost effective to do a secondary asset management task with a primary one. For example, while conducting bridge maintenance it is often easier and effective to conduct pavement maintenance simultaneously. Gharaibeh et al. (1999) has developed a methodology for a prototype for integrating highway maintenance activities. They have used Geographic Information System (GIS) based software for integrating different highway infrastructure data and maintenance priorities. The authors also have shown through a case study with integrated pavements, bridges, culverts, intersections and signs using their existing database and maintenance priorities. The case study results showed that integration was useful for the highway agencies. The authors have shown that integration of different highway infrastructure components at network level and project level along with higher coordination and comprehensiveness is more efficient and useful for agencies. GIS was used for the integration, spatial query, and analysis with visualization capabilities for better decision making. 25
39 Over time and with the demand for the increasing future travel needs, asset management became an important sector of the transportation industry. There was also an urge to integrate asset management into a common and easily assessable manner. Recently, Hall et al. (2005) showed that an enterprise based spatial data integration of the legacy system could be one of the best tools for decision support, planning and operation of transportation systems. It has the capabilities to allow the existing transportation assets to generate the space for future modifications. According to the authors most of the agencies have different databases in various formats and are not integrated. Hall et al. (2005) have different identifiers and referencing systems as well. This situation creates a significant impediment for the decision making process and complicates locating spatially based information. Hall et al. (2005) further used a main frame database system to integrate different databases using ArcInfo and building a node-link system. This system assumes that physical location that will be the same even if the milepost is changed or modified. They also suggested using the Spatial Database Engine (SDE) from Environmental Systems Research Institute (ESRI) for better accessibility of spatially related information. With the modernization of information technology systems, there is consideration for the transportation agencies to move the database and asset inventory to an easily accessible location such as the internet and intranet. 26
40 Since many of the different agencies are required to use the same database for different purposes, it is even more important to have an online system or web based system suited to their needs. The main benefits of web based systems will be 1) ease to access, 2) ease to manage, and most importantly 3) they can be run on any computer with a web browser and an internet connection. Previously, Ozbay and Mukherjee (2001) have presented a web based expert geographical information system (GIS) developed as a prototype for the incident management decision support system (DSS). The study showed that using Java and Web enabled GIS system has the potential to provide flexible and cost effective information dependent ITS systems such as traveler information and incident management. The authors also claimed that this web based system can significantly enhance the real time incident management decision support system. Financial reporting can play an important role in the profitability analysis for the transportation infrastructures and eventually enhance the asset management of the system. Gifford and Stalibrink (2000) have presented the importance of enterprise based financial reporting for transportation asset management. They proposed two approaches for the financial analysis. The approaches are 1) benefit cost analysis and 2) productivity studies for the transportation infrastructure. They focused on enterprise based financial reporting that has the potential to facilitate profitability analysis. These 27
41 analyses will help guide in managing public assets for which the analysis was performed. Enterprise based reporting systems were considered to be useful for the analysis of the contribution of an entity which may not arise with historic financial reports. Currently, historic financial reports detail the justification of raising money as well as where and how it was spent. With enterprise based reporting system, individual entities profitability will be highlighted along with entities who have historic reports, and the decision making procedure will be easier for transportation asset management. Traditionally, benefit cost analysis has been the most commonly used economic analysis to select or prioritize projects. Since some benefits or costs are difficult to be quantified and converted into monetary value, multi-criteria decision analysis can serve a better role in these situations. Sinha and Li (2004) have shown a methodology for multi-criteria decision making in highway asset management systems. They proposed the methodology to be used for the trade-off involved in the decision making process for different projects. This methodology can be used for the project selection under risk and uncertainty. Furthermore Sinha and Li (2004) have shown a step by step procedure for a multi-attribute utility model analysis for highway assets and developed utility functions for each highway asset management program. Additionally Sinha and Li (2004) have shown how to make the decision to select the best highway asset management program based on the trade-off analysis. 28
42 2.3 ASSET MANAGEMENT FOR ITS Asset management for ITS is still a new concept in the transportation industry. Within a short time ITS has played a great role in the improvement of the overall performance of transportation operations with higher efficiency, safety and better performance. Due to ITS s fast growing nature with a variety of system components, asset management for ITS is gaining importance and attention from public agencies. Despite this fact, very few studies have been conducted addressing ITS asset management systems. The Florida Department of Transportation (FDOT), (2006) has evaluated three systems for ITS facility management. The three customized tools for ITS asset management were OSPInSight, FiberTrak and FMT-ITS (NexusWorx). FDOT study showed that after comparing these three systems FMT-ITS is the most suitable for meeting the requirements of FDOT. FMT-ITS (i.e., NexusWorx) was introduced as a geospatial solution for the telecommunications and utility industries and later on was customized for ITS asset management. 2.4 SUMMARY The transportation system is complex and has various functional divisions to fulfill the need for travel. As the systems grew, their components became so large that an appropriate management system became essential. The system has very different divisions along with various assets and they all 29
43 need different approaches for management. Over time asset management systems have developed for each division, including pavements, bridges and roads. Through these divisions, many methodologies have evolved for proper management of these assets as well as the integration of these divisions. However, ITS is relatively new in the transportation industry and it is a rapid growing division of the transportation system with a variety of components that has made asset management for ITS even more critical. Also, with a number of ITS asset management systems available, it is difficult to select the right one and the decision making becomes even more challenging with non-quantifiable requirements. Multi-criteria decision analysis has the potential to address this by providing the flexibility to consider quantifiable as well as non-quantifiable requirements. 30
44 3. CHAPTER: METHODOLOGY This chapter discusses the methods employed to achieve the objectives of the study, to evaluate ITS asset management systems for managing ITS assets. The methodology consists of four major steps as shown in Figure 3.1. The first step involves setting the requirements for developing the evaluation criteria for an ITS asset management system. The second step involves conducting a case study of a wireless system with different network designs that will facilitate future deployment. This step focuses on the network design for different wireless systems as an alternative to existing wired communication systems. In the third step, an evaluation of ITS asset management systems, including NexusWorx, Enterprise Based GIS and Microsoft Access, is conducted. To assess the capability of the three systems to meet the defined requirements, each system was individually evaluated and rated accordingly to their performance. Finally, the last step involves the evaluation of the three systems using multi-criteria decision analysis. Quality deployment function analysis was used to support the findings of the multi-criteria decision analysis with visual representation of system capabilities and deficiencies of the system. A multi-attribute utility model was used to perform multi-criteria decision analysis. 31

45 Figure 3.1 Research Methodology 32
46 3.1 DEVELOPING REQUIREMENTS FOR ITS ASSET MANAGEMENT SYSTEM The requirements were set based on previous work (Zhang and Gao 2008, FDOT 2006, Hall et al. 2005, NCHRP 2000, Larson et al. 2000, Small 2000, Gharaibeh et al. 1999) including information from the literature review. State agency officials from the South Carolina Department of Transportation (SCDOT) were also interviewed. The literature review helped to develop the basic understanding of the approach to address the ITS asset management requirements before the officials from the SCDOT were interviewed. Traffic engineers and Traffic Management Center (TMC) operators from SCDOT were interviewed. The engineers and operators also provided the research team with a better understanding of the assets that are typical of current ITS systems and helped to address future expected needs as well. The questions included in the survey are shown in Appendix A. 3.2 CASE STUDY Currently, most ITS surveillance systems are using an established wired network for communication. Most of the agencies surveyed are spending a significant amount of money for leasing a wired communication network because they don t have their own infrastructure to cover the demand. Due to the cost for leasing, the agencies have started to find alternatives to wired 33
47 communication systems to minimize their expenditure and need a system they can own and operate. Many agencies are considering deploying wireless systems for ITS traffic surveillance systems as a cost effective alternative to the leased wired communication system. Thus there is a strong possibility that the wireless system might be a part of the overall network system. For wireless communication system coverage area range and bandwidth are the major limiting factors, thus the wireless device locations are important. Network design allows the identification of controller (base station or HUB) locations that will be suitable for meeting the coverage area range and utilizing the bandwidth effectively. For efficient deployment of a wireless communication system, network design is very important. At present there is no such wireless system deployed in the study site. To address this, a case study for network design was performed and this case study fed into evaluating ITS AM systems (step three in figure 3.1). One of the major reasons behind network design is to minimize the cost associated with the deployment of wireless communication systems and to achieve the maximum efficiency from the network. Two wireless systems, WiFi and WiMax, are being considered as future communication systems with Mesh and Infrastructure based topologies. The network was designed for both topologies and wireless options as these could be a component of the total 34
48 traffic surveillance system along with the fiber connections. The network design will help to deploy the different wireless topologies in the evaluation of the ITS asset management system Network Design for WiFi and WiMax The study site is located in Spartanburg, South Carolina and was studied for both WiFi and WiMax wireless communication systems. A case study was conducted to identify the components of the wireless infrastructure needed to support the traffic surveillance system. Key components of the infrastructure also varied based on the topology and network system. While designing the wireless traffic surveillance system for WiFi, some assumptions had to be made. The study begins by determining the exact location of the cameras. The locations determine the distance between each camera since wireless connections can cover only a limited range. The bandwidth required to support the devices over the required distances is also crucial. Grouping, also called clustering, is conducted based on the bandwidth and the radio range to support the devices (camera, radar and dynamic message signs). The number and location of wireless groupings then allow a reduction in fiber cable connections which ultimately minimize the number of access points (controller location). 35
49 3.3 EVALUATION OF ITS ASSET MANAGEMENT SYSTEMS The evaluation of ITS asset management systems was conducted based on the requirements identified earlier and points learned from the case study. Three groups of systems were selected to be evaluated based on selected criteria such as visualization capabilities, data management, user interface, enterprise capability, learning curve and costs. Three systems represented by 1) ITS customized system, 2) an Enterprise based GIS system and 3) a typical database management systems were evaluated. NexusWorx, Enterprise based GIS (SDEGIS) and Microsoft Access were respectively chosen to represent these groups. Once the systems were selected, the criteria were applied. Based on the test results (step three) an evaluation was performed to see whether they could meet the requirements of an asset management system for ITS. Evaluation was based on two different scenarios in terms of communication network. They are Existing Network (Wired Communication System) and Proposed Network (Wireless Communication System) There is a strong possibility that ITS deployment agencies sooner or later will include wireless communication systems as a part of their ITS surveillance system. The asset management systems that are currently based on wired communications will be required to support the wireless network at that point. While evaluating asset management systems, these scenarios also need to be checked. In this study the wired communication network was 36
50 evaluated as the existing network. Currently the study site doesn t have any wireless communication networks deployed. In order to incorporate this issue, a network design of the wireless system is presented as a case study (step two). To start the evaluation measures of effectiveness (MOEs) were selected to evaluate the applications. Selection was based on the requirements of the ITS asset management system determined from the interviews. The MOEs served as the evaluation criteria as well, and all the applications were tested against these MOEs to fit into the multi-attribute utility analysis model. Figure 3.2 shows the MOEs selected for the project. The MOEs are broadly classified into two categories and each category was broken down based on the individual criteria s involvement with each category. Based on those MOE s, a test to evaluate all three systems with each criterion was created. The systems were then tested (step three) for ITS asset management. Based on the test evaluation of the systems they were rated. This rating was fed into the multi-attribute utility model as the value of the attributes and the relative importance of the MOEs were taken into consideration. The relative importance of the MOEs is reflected through the relative utility value of the attributes for the multi-attribute utility model. The relative utility was determined based on a survey taken by Department of Transportation (DOT) Personnel including ITS engineers, database managers, and GIS experts. 37
51 Figure 3.2 The MOEs for the Evaluation of NexusWorx 3.4 EVALUATION OF DIFFERENT GROUPS OF ASSET MANAGEMENT SYSTEM AVAILABLE FOR ITS The goal of this study is to find a system that will manage ITS assets in an efficient, cost effective and more convenient way. Since ITS systems consist of different devices and systems such as cameras, radars, variable 38
52 message signs, and wireless and wired communication systems, it becomes challenging to manage the network with traditional asset management systems. The three systems; Nexuswrox, Enterprise Based GIS, and Microsoft Access as representative of three groups of ITS asset management system were evaluated to determine their relative compatibility to meet the MOEs. The evaluation was performed by using a test based on the MOEs and a relative rating of each alternative The Evaluation Team Development An in-house evaluation team was developed considering the fact that team members should have exposure to all three systems. The team members attended a workshop on the NexusWorx for the ITS asset management after NexusWorx was selected as one of the ITS asset management system and the criteria for evaluation was set. All the members had some related course knowledge of GIS and have worked with GIS systems for various projects. Members were proficient in the use of Microsoft Access. Also for GIS capabilities, research team consulted with SCDOT and Clemson University GIS specialist. 39
53 3.4.2 Study Site Selection The site selected for the test is located on I-85 near Spartanburg, South Carolina. All the information for the study site was collected from South Carolina Department of Transportation (SCDOT) using as-built drawings of the study site. The as-built drawings contained all necessary information regarding ITS devices. A sample of an as-built drawing is shown in Figure 3.3, which depicts the study site with the ITS devices The highlighted portion in Figure 3.3 shows the study area that includes one HUB (router or similar device that connects many other devices or computers to a single computer), nine cameras, and one Dynamic Message Sign (DMS). 40

54 Figure 3.3 As-Built Drawing For the ITS Facilities (Source: SCDOT) 41
55 3.4.3 Test Plan Development For each MOE, an individual test was planned. The test plan was based on the site selected for the project study site and the research team performed the tests for each MOE separately and then ranked the system. The main objective was to develop a complete ITS asset management plan for the selected site and observe whether the three softwares can perform the asset management functions for ITS. Based on their performance in the tests, a rate was assigned to each system for each MOE, and then used in the multiattribute utility model analysis to find the utility values of each MOE. In addition to this, once research team has rated the systems, these ratings were validated and confirmed with Clemson University Enterprise based GIS specialist Visualization Visualization was considered one of the major factors for ITS asset management. It plays an important role in decision making through visual observation and interpretation of a scenario. The visualization capability covers map viewing capability, visual representation of spatial query, visualization of fiber trace, connectivity of fibers, the ITS customized symbology for enhanced visualization, and wireless network visualization. ITS customized symbology refers to the customization of a system to support the ITS assets and its associated attributes. Personnel from different fields need standardized 42
56 symbols and icons to clearly distinguish and recognize different ITS devices and components Map Viewing Capability The three systems were tested based on their capability to manage a geographic location system. A point with known coordinates was entered into the system to evaluate how the system located the point and displayed it on the map. Accurately locating data points was considered a prerequisite for data visualization Spatial Query The systems were assessed in their ability to translate into a visual form. Multiple queries were conducted based on factors such as attributes and location. The results were compared among the three systems and rated based on their performance Fiber Trace and Visual Connectivity of the Fibers The systems were tested to determine their ability to follow a physical fiber s path along the network. It was also important to determine the visual display of the network with the fiber path and its connections to other devices. 43
57 Customized ITS Symbology Each system was checked to determine what customized symbols and icons useful in ITS applications were provided. The capability of the symbols and icons to represent specific devices and structures were also assessed Wireless Network Visualization The ability to visualize detailed wireless networks was determined. An important factor is the simplicity of the display of the network because it can allow a quick and easy understanding of the entire network. Each system was checked to see whether it had the specific tools to visually represent the wireless network. Then each system was judged to see how simply the network was displayed Data Management and Applicability Data management is an important issue for all asset management systems and it is extremely important to ITS asset management. Additionally the presence of a recovery system was considered to protect against system failures of the data storage components Data Recovery and Retrieve This focuses on the recovery system of the database in case of failure. The method of data storage and the reliability of the data storage network were judged for each system. 44
58 Single Administrator Control This is the capability of having a single administrator who validates all the field updates before they become final. This is considered important when there is a concern that database changes from low priority users (such as field users, technicians etc.) might not be correct. Therefore, an administrator is responsible to validate the updates before they are become permanent. For each system the ability to possess single administrator control was judged and rated User Interface User interface focuses on easiness of system access and workability. The level of simplicity and speed of the system to allow the user to perform a specific task is considered in this MOE Ease of Use of the Software This addresses the ability to manage ITS assets efficiently assuming that a user is proficient in the use of that software. Each system was judged based on the requirements needed to be an effective user. Another important factor that is considered in ease of use is learning curve. Learning curve can be described as the time required to become proficient with the use of the software effectively. This MOE was tested based on how much time is required 45
59 to be proficient with the systems. The time was measured for a user to become proficient with each of the systems Customized Import Functionality This is the capability to import files in different formats such as shape files, as-built drawings and AutoCAD files without having to reformat the database. Each system was judged based on their capability to import and support different forms of import files. This MOE was divided into two groups and those are straight out of the box import functionality and another is supporting user specific customization. For straight out of the box customization can be enough to support the user need. But users require the flexibility to customize the imported attributes into effortlessly useable format. For this MOE both cases were evaluated; the effectiveness of the existing straight out of the box capability was tested as well as the capability to support user defined import customization Remote Access Remote access is important especially when multiple agencies are sharing data in order to integrate different transportation divisions for more efficient management and budget allocation. Remote access covers the capability to access the system via the web, conduct field updates/usage of the system, and the restricted data access capability. Restricted data access means that all the users do not have the same privileges to modify the data. 46
60 Defined upper level users should be able to edit and view the database and maintain full access of the database. Users that only need to view the data should be allowed limited access capabilities Web Based This can be described as the capability using a web browser to access the system instead of being forced to install the software on each individual computer. Each system was evaluated based on whether it had full capabilities when accessed via the web Field Updating /Usage This specifies the ability to update the database from the field or add new data entries from a field location. Each system was evaluated based on whether it could be edited and updated from a field location Restricted Data Access Capabilities This accesses the ability to have read only or read/write formats for different users. The capability was tested by attempting to view the database only (read only) for some users, and to view and edit the database (read/write) privileges for other users. 47
61 Enterprise Capability This MOE implies the capability of a system to support multiple users at the same time and allow simultaneous access to the database that is saved in a central location. Each system was evaluated based on its ability to be accessed simultaneously from different computers to check the enterprise capability of the system Testing the Systems The research team judged each of the systems based on the developed test plan to justify whether they can support the requirements of an ITS asset management system. The test performed for each system was based on the selected study site and the ITS devices, and different communication systems (wired and wireless). The test covered the wired network and different wireless networks (WiFi and WiMax) since wireless is becoming an emerging application for ITS traffic surveillance systems The Rating of the Systems The research team allocated a relative rating based on the performance of the three systems to satisfy the asset management requirements in terms of measures of effectiveness. The system that does not possess the capability for a selected MOE is rated 0. The system having the capability and meeting all the needs associated with a specific task and that is 48
62 best suited to achieve the goal is rated as 5. Once, research team had the initial rating based on the test, Clemson University GIS experts were consulted to validate ratings. Two types of evaluations were performed: 1) considering the system capabilities only and 2) considering the system capabilities with cost of the systems. In Table 3.1, shows the rating scale that was used for the system rating is presented. Table 3.1 Rating Scale for the Systems Rating Significance 0 Does not have the capability 1 Has the capability but not very good 2 Satisfactory 3 Good 4 Very Good 5 Excellent 3.5 MULTI-ATTRIBUTE UTILITY MODEL ANALYSIS A simple, clear-cut comparison between the customized ITS AM system and other alternatives were not possible. A typical benefit cost analysis might not reflect some of the basic qualities of an asset management system for ITS. Some of the components are difficult to quantify and for this reason a simple benefit cost analysis will not be able to reflect the overall performance of an alternative. Multi-criteria decision analysis incorporating these components and quantifying them in terms of utility value is an appropriate technique to address 49
63 this kind of situation. The multi-attribute utility model is used with the evaluation rating of the three systems to help choose the best alternative. Three alternatives were used for the decision support analysis and those three systems for ITS asset management were evaluated by the research team. The multi-attribute utility model follows the steps shown in Figure 3.4. The goals were first identified, and then the measurement of effectiveness (MOE) needed to accomplish those objectives was assigned. The MOEs are those previously selected for the evaluation of ITS asset management system. The multi-attribute analysis considered two scenarios: 1) only considering the system capabilities and 2) considering system capabilities as well as the costs of the systems. The alternatives are defined for which the analysis is to be performed. Finally, the multi-attribute utility model is applied to help select the best alternative. The flow chart of the methodology is shown in Figure
64 Figure 3.4 The Process for Multi-Attribute Utility Model Finding the Goals The goal of this study is to select the preferred alternative that will be cost effective and will meet the system capability requirements for ITS asset management system Selection of MOE The selected MOEs were those best suited to evaluate the three competing systems. Two types of analysis were considered, one based on the system capabilities and another based on system capabilities along with cost considerations to observe the effect of cost for decision making. Again, cost 51
65 might not be considered as important as the system capabilities for systems. Because if a less expensive system does not satisfy the system requirements then it will not be deployed no matter how cost effective the system is. The list of the MOEs that will be used for the multi-attribute utility analysis are listed below: 1. Map Viewing Capability 2. Visual Representation of Spatial Query 3. Visualization of Fiber Trace and Connectivity of the Fibers 4. Customized ITS Symbology for Enhanced Visualization 5. Wireless Network Visualization 6. Data Recovery and Retrieval Strength 7. Single Administrator Control 8. Ease of Use of the Software 9. Customized Import Functionality (out of box) 10. Customized Import Functionality (supporting user specific customization) 11. Web Based Applicability 12. Field Update/Usage Support 13. Restricted Data Access Capabilities 14. Support to Enterprise Environment 15. Cost of Personnel 16. Cost of Software 52
66 17. Cost of Operation and Maintenance For the analysis based solely on system capabilities, MOEs from 1-14 were used, whereas 1-17 were used for the analysis where system capabilities and the costs were both considered. Costs considerations involved MOEs that assessed the cost of using the three different systems Defining Alternatives The alternatives are the systems to be evaluated stated in the previous section. The alternatives for ITS asset management system are listed below: NexusWorx (a representative of customized ITS AM system) Enterprise Based GIS (a representative of GIS based ITS asset management system) Microsoft Access (a representative of typical database management system) Nexuswrox is considered to be an alternative because it represents a customized ITS asset management system. The Enterprise based GIS is considered because the users of the ITS asset management systems will be from mostly DOTs and public agencies. This is a reasonable alternative since most agencies already have an Enterprise based GIS system for several other types of projects and tasks and through some additional plug-ins it could be a 53
67 potential ITS asset management tool. Microsoft Access was considered an alternative because it is a well known database management tool Multi-Attribute Utility Analysis The multi-attribute analysis consisted of several steps. First, the rating of each MOE was assigned based on the evaluation of the three alternatives from the case study. The assigned ratings are considered to be the performance ratings of each MOE. Each MOE had a utility value from the survey responses. A utility equation was developed for each alternative, and the analysis was conducted based on the utility and the performance rating of the MOEs. The most suitable alternative was selected based on the results. After the first analysis the multi-attribute utility analysis was performed on the two communication network system scenarios presented earlier: existing (wired) and proposed communication network (wireless) system Assigning Utility Values of the MOEs The utility values of the MOE s were extracted from the results of a planned nationwide survey. The survey is presented in Appendix A. The survey was taken by personnel from DOTs and other government agencies. They rated these factors on a scale of 0-10 based on their perception of the importance of each factor in an asset management system for ITS. The higher the ranking the more important the factor was. Once the survey was completed the data was transformed into the utility values of the factors adding up to 1. 54
68 For the analysis where only the system capabilities were considered, the utility component contains 14 MOEs according to equation 3.1. The utility for the analysis where the system capabilities and the costs were considered consists of 17 MOEs according to equation 3.2. U 1 +U 2 +U 3 +U 4 +U 5 +U 6 +U 7 +U 8 +U 9 +U 10 +U 11 + U 12 +U 13 +U 14 =1 Equation 3.1 U 1 +U 2 +U 3 +U 4 +U 5 +U 6 +U 7 +U 8 +U 9 +U 10 +U 11 +U 12 +U 13 +U 14 +U 15 +U 16 +U 17 =1 Equation Multi-Attribute Utility Analysis The overall utility for each alternative was calculated using equation 3.3 for the analysis of only the system capabilities. Equation 3.4 was used for calculating the overall utility for the analysis where both the system capabilities and the costs were considered. MUA= U 1 PR 1 +U 2 PR 2 +U 3 PR 3 +U 4 PR 4 + U 5 PR 5 + U 6 PR 6 + U 7 PR 7 +U 8 PR 8 + U 9 PR 9 +U 10 PR 10 +U 11 PR 11 +U 12 PR 12 +U 13 PR 13 +U 14 PR 14 Equation
69 MUA= U 1 PR 1 +U 2 PR 2 +U 3 PR 3 +U 4 PR 4 + U 5 PR 5 + U 6 PR 6 + U 7 PR 7 +U 8 PR 8 + U 9 PR 9 +U 10 PR 10 +U 11 PR 11 +U 12 PR 12 +U 13 PR 13 +U 14 PR 14 +U 15 PR 15 +U 16 PR 16 +U 17 PR 17 Equation 3.4 Where, PR 1 = Performance Measure of Visualization Quality of Map Viewing Capability PR 2 = Performance Measure of Visualization Quality of Spatial Query PR 3 = Performance Measure of Visualization Quality of fiber trace and connectivity of the fibers PR 4 = Performance Measure of Visualization Quality of Customized ITS Symbology Quality for Enhanced Visualization PR 5 = Performance Measure of Visualization Quality of Wireless Network Depiction PR 6 = Performance Measure of the Quality of Data Recovery and Retrieval System PR 7 = Performance Measure of the Quality of Single Administrator Control PR 8 = Performance Measure of the Quality of Ease of Use of the Software PR 9 = Performance Measure of the Quality of Customized Import Functionality (straight out of the box) 56
70 PR 10 = Performance Measure of the Quality of Customized Import Functionality (supporting user specific customization) PR 11 = Performance Measure of the Capability to Support the Web Based Application PR 12 = Performance Measure of the Capability to Support Field Updates/Usage PR 13 = Performance Measure of the Capability to Restrict Data Access PR 14 = Performance Measure of the Capability to Support Enterprise Environment PR 15 = Performance Measure of the Capability to Minimize the Cost of Personnel PR 16 = Performance Measure of the Capability to Minimize the Cost of Software PR 17 = Performance Measure of the Capability to Minimize the Cost of Operation and Maintenance MUA = Total Multiple Measure Utility of Alternative A U i = Utility of the ith utility 57
71 3.5.5 Selecting the Best Alternatives Based on the overall utility, the best alternative was selected. The alternative with the maximum overall utility will be the system that best meets the asset management system s requirements. 3.6 QUALITY DEPLOYMENT FUNCTION ANALYSIS It is important to evaluate the ITS asset management tool in contrast to the customer requirements and the technical properties. This is best done using a quality deployment function analysis. In this study the House of Quality method was used to reflect the customer preferences against the technical properties. This is an alternate approach to evaluate different options. This approach presents the evaluation in a visual form that is quick and easy to compare different options. It reflects the customer requirements and the interaction between this and the technical properties. In the end, it reflects the desired properties of the system for a specific task. Moreover, it is easy to indicate, visually from the house of quality matrix, which of the alternatives is best meeting the requirements. The house of quality matrix included customer requirements, technical requirements, a planning matrix, an interrelationship matrix, a technical correlation matrix, and a technical priorities/benchmarks and targets section. A sample house of quality is shown in figure
72 Figure 3.5 A sample template for House of Quality Customer Requirements The customer requirements came from the survey that was made for the multi-attribute utility model analysis for the utilities of the attributes. The utilities also came from the same survey. 59
73 3.6.2 Technical Requirements The technical requirements are those MOEs that the research team has already evaluated during the evaluation of NexusWorx, Enterprise based GIS and Microsoft Access. Those are the properties that a typical ITS asset management system will need Planning Matrix After identifying the customer requirements and the technical requirements, the next task is to develop the planning matrix. The planning matrix reflects the comparison of the NexusWorx with the other two systems. It shows how well the NexusWorx meets the requirement compared to the other two systems. The matrix shows the weighted importance of each requirement that the NexusWorx and other systems intend to fulfill. In this study the customer ratings are done on a scale of Finally an overall performance measure for the systems was done based on the customer ratings and the weights of each of the MOE Interrelationship Matrix The main function of the interrelationship matrix is to establish a connection between the customer s system requirements for an ITS asset management system and the performance measures that will be required for improving the systems to a desired level. The first step in constructing this 60
74 matrix involves obtaining the opinions of the consumers which was done in a form of a survey to identify what they need from a system for ITS asset management Technical Correlation Matrix Performance measures in existing designs often conflict with each other. The technical correlation matrix, which is more often referred to as the Roof, is used to aid in the development of relationships between customer requirements and product requirements and identifies where these units must work together. Otherwise they will be in a design conflict. The following symbols were used to represent what type of impact each requirement has on the other. These symbols are then entered into the cells where a correlation has been identified. The objective is to highlight any requirements that might be in conflict with each other. + P os itive - Negative Technical Properties and Target This is the set up of the benchmark to which the system needs improvement to achieve the objective that is managing the ITS assets efficiently. The technical properties matrix uses specific items to record the priorities assigned to technical requirements. It also provides a technical 61
75 performance achieved by the other systems that are compared and the degree of difficulty in developing each requirement. The final output of the matrix is a set of target values for each technical requirement to be met by the new design. 62
76 4. CHAPTER: ANALYSIS This chapter shows the analysis of the network design for different wireless technologies and topologies. Additionally, this chapter presents the results of the multi-criteria decision and quality deployment function analyses utilized in the evaluation of potential ITS asset management systems. 4.1 REQUIREMENTS FOR ITS ASSET MANAGEMENT SYSTEMS The requirements, for an ITS asset management system, developed based on survey responses from state agencies and literature review are presented in Table 4.1. Table 4.1 shows the system capabilities related requirements. 63
77 Table 4.1 The Requirements for an ITS Asset Management System Criteria Enterprise Capability Security Standard Format Expansion Capability User Friendliness Field Usage and Changes Remote Access Basic Reporting and Printing Capability Data recovery Cost of the System Description The application should work in an enterprise based environment. The application should contain a reasonable security system. The database should maintain a standard format for the asset attributes and should be compatible with legacy systems. Future modification and expansion of the ITS features and assets should be easily accommodated and updated. The application should be easy to use and maintain also the time required to be proficient with the system. The system should support the usage from field locations and updates. Various agencies should be able to access, and extract data from the application for planning, operating and maintaining ITS features. It should provide the basic capability of reporting and printing maps, and databases. In case of loss of data the system should have a data recovery system. The system should be cost effective. 4.2 CASE STUDY FOR COMMUNICATION SYSTEM ITS applications are typically consist of very complex systems with a variety of assets that include communication components, and traffic control and management devices. Communication network is one of the key components because most of the functionality of a traffic management system depends on the real time data collection, data processing and decision making. Currently wired communication systems are used for most ITS 64
78 communications. Transportation agencies have started evaluating costeffective wireless communication alternatives for supporting ITS applications. In order to address the potential use of wireless technology, this study performed a case study to develop and design a wireless communication system for a study site currently supported by wired system. The proposed wireless network was also used to evaluate ITS asset management systems considered in this study. The study site consists of a traffic surveillance system in Spartanburg, SC with 18 close circuit television cameras (CCTVs) wirelessly connected. Here the CCTV locations were considered as nodes in the network design. These CCTVs are located on I-85 as shown in Figure 4.1. The distance between each node is calculated in order to form sub-networks (clusters) so that each node is within radio range of the wireless coverage area. The number of fiber optic connections was minimized as well in the network design. 65
79 CCTV Figure 4.1 Traffic Surveillance Devices in Spartanburg, South Carolina An example of calculating the distance between nodes is shown in Table 4.2 for a WiMAX network design based on the WiMAX network shown in figure 4.2. In this table the difference in distance between nodes 13 to 18 is limited to two miles due to radio range of coverage area. Data from the South Carolina Department of Transportation (SCDOT) was used to locate the nodes so that the distance between them could be calculated. Using Table 4.2, the highlighted distances associated with node 15 were deemed suitable as access point for base station. Node 15 was selected because it has the lowest distance to nodes 13, 14, 16, 17 and 18 compared to the other nodes in
80 and also because the average distance between nodes is close to the minimum average distance for WiMAX coverage range CCTV Figure 4.2 WiMAX Network Design for the Traffic Surveillance Devices in Spartanburg, South Carolina 67
81 Table 4.2 Example of the Calculation of Distance between Nodes (in miles) for WiMAX CCTV Max Distance Average WiFi Infrastructure Network The WiFi infrastructure model is shown in Figure 4.2. It divides the eighteen nodes into ten clusters based on the communication range of 1 mile in diameter for WiFi. Some clusters have two or three cameras, while others only consist of one camera. Within each cluster, only one traffic camera is connected to the fiber drop. The camera connected to the fiber drop sends information collectively for all the cameras within the cluster. For example in Figure 4.3, CCTV 25 of cluster 6 will send the information of CCTV 25 and CCTV 26 to the HUB through the fiber connected between CCTV 25 and HUB. Each cluster would have its own fiber optic access, so in total there are 10 fiber drops needed for this scenario. Each camera is assumed to be equipped with 68
82 a Cisco 1410(3) wireless access point, which has built-in directional antennae. The typically used Cisco 1310 models lack built-in antennae so additional costs to install one are needed. The overall network design is summarized in Table CCTV HUB Figure 4.3 WiFi Infrastructure Network for Spartanburg, South Carolina WiFi Mesh Network The WiFi mesh model is shown in Figure 4.4, and divides the eighteen nodes into three mesh clusters that are comprised of a group of four sub- 69
83 clusters and two groups of three sub-clusters. Mesh clusters were selected based on their WiFi range (<.4 miles) and assuming that the base station will have omni-directional antennae. Within each sub-cluster, one pre-selected traffic camera collected video information from other cameras within its subcluster. The pre-selected traffic camera transmits all information from its respective sub-cluster to the next sub-cluster. The next sub-cluster repeats the process until the information reaches the fiber drop. Instead of having fiber connections for each cluster, there is only one fiber drop for each mesh group, shown as the star in Figure 4.3. In the ad hoc network, each camera is both receiving and sending data from/to neighboring sensors and requires two directional antennas for each camera. The authors assumed a Cisco Aironet 1524(9), which has two built-in directional antennas, instead of having two Cisco 1400 radios. This minimized the equipment cost. In this scenario, a total of three fiber optic Internet connections and eighteen Cisco AirNet 1524 Series Wireless Bridge (Cisco) required for the proposed network. Table 4.3 The Summary of the WiFi Network Architecture Infrastructure Mesh ( Non Ad hoc) ( Ad hoc) Technology WiFi (802.11g) WiFi (802.11g) Number of Client Radio Number. of Fiber drops

84 Figure 4.4 WiFi Mesh Network for Spartanburg, South Carolina WiMAX Infrastructure Models The traffic surveillance devices in Spartanburg, SC were divided into four sub-networks each containing a maximum of five nodes within 2 miles of each other as shown in Figure 4.5. In this scenario, there would be a total of four fiber optic Internet connections required, and eighteen WiMAX radios. Within each cluster, one traffic camera sends traffic video information to the fiber system. There is no connection between groups of cameras. Each 71
85 cluster would have its own fiber optic access, so there are 4 fiber drops needed for this scenario. Each camera is equipped with a Cisco 1410(3) wireless access point, which has a built-in directional antenna. The overall network design is summarized in Table Figure 4.5 WiMAX Infrastructure Network for Spartanburg, SC WiMAX Mesh Network The WiMAX mesh model is shown in Figure 4.6, and it divides the ten clusters in the same manner as the WiFi mesh model. In this study it was 72
86 divided into three mesh clusters. Each node in the cluster would have its own Motorola WiMAX base station, receiving and forwarding data from the other nodes Figure 4.6 WiMAX Mesh Network for Spartanburg, SC For this case study the access point locations with Internet access were chosen to minimize this maximum hop-count (the number of information relay). In this scenario, there would be a total of three fiber optic Internet 73
87 connections required, and eighteen Motorola WiMAX base stations. Table 4.4 summarizes the WiMAX network design. Table 4.4 The Summary of the WiMAX Network Architecture Infrastructure ( Non Ad hoc) Mesh ( Ad hoc) Technology WiMAX(802.11g) WiMAX (802.11g) Number of Client Radio Number. of Fiber drops 4 3 The wireless network design was considered as planned deployment for communication system. The study site selected does not possess any wireless communication system at present but the future plan includes the option for introducing wireless system. The network design presented in this section was utilized for the evaluation of different ITS asset management systems in the following section. 4.3 EVALUATION OF ITS ASSET MANAGEMENT SYSTEM NexusWorx was selected for evaluation as a representative system for customized ITS asset management tool. The GIS based system was chosen because some public agencies might have already adopted Enterprise based GIS for different usages, such as site suitability analysis and data inventory. Access, which is widely used as a data management system, was also selected as a potential ITS asset management tool. 74
88 The systems were evaluated by comparing the relative performance of each with regard to meeting the requirements set for an ITS asset management system. The research team, which consisted of the author and two other students, evaluated the three systems based on the selected MOEs and then rated them according to their performance. Then ratings were also consulted with GIS experts at the Clemson University and South Carolina Department of Transportation. The MOEs were categorized into two distinct groups based upon their characteristics. These included the systems technical capabilities to support asset management tasks and system cost Evaluation Based on System Capabilities The system capabilities were rated based on their relative performances to achieve the requirements of an ITS asset management system. A scale of 0-5 was used to rate the systems for each MOE. The system received a 0 if the requirement could not be met and 5 when it could meet the requirement completely. The three different asset management systems were also evaluated in terms of their licensing fee, operation and maintenance costs. The comparison of the NexusWorx, Enterprise based GIS, and Microsoft Access is shown in Table 4.5. The MOEs that are related to system capabilities were evaluated through research based on the case study of a proposed wireless network integrated with existing wired communication network and ITS assets. 75
89 ITS assets included camera, radar, HUB, DMS etc. The following sub sections address the evaluation outcomes. Table 4.5 Relative Ratings for the System Capabilities MOE Map Viewing Capability Relative Rating NexusWorx Enterprise based GIS Microsoft Access Spatial Query Visualization Data Management and Applicability User Symbology Fiber Trace and Connectivity of the Fibers Customized ITS Symbology Wireless Network Visualization Data Recovery and Retrieve Single Administrator Control Ease of Use of the Software Customized Import Functionality 1 Customized Import Functionality Remote Access Enterprise Capability Web Based Field Updating/Usage Restricted Data Access Capability Multiple User Supporting Capability
90 1 (Straight out of the box) 2 (Supporting user specific customization) Visualization NexusWorx and Enterprise based GIS have similar capabilities to support map viewing and spatial query visualization, however Microsoft Access is not able to support these functions. Depicting fiber trace and representing connectivity in a visual form, NexusWorx has customized tools to perform this fiber connectivity and tracing function. Enterprise based GIS does not have any customized tools to perform fiber connectivity and tracing, however with some plug-in tools this objective can be achieved in GIS. Customized ITS symbology is a very important feature for any ITS asset management system because it allows standardized icons and tools for ITS system components. This also allows the icons to convey the same meaning throughout agency and between personnel involved with ITS assets. NexusWorx has a built-in ITS customized symbology and in Enterprise based GIS with some additional plug-ins this customization can be performed. Along with the plug-ins, the icons and tools for ITS assets need to be standardized in Enterprise based GIS. Wireless network visualization is important in ITS asset management system. Currently the case study area doesn t consist of any wireless networks. Based on that case study, the ITS asset management systems were 77
91 tested and evaluated to observe whether they can support this capability or not. NexusWorx supports wireless network visualization completely but Enterprise based GIS again will require modifications and customized codes to support this requirement. For Enterprise based System existing in the public agencies it was assumed that these modifications will be performed effortlessly utilizing existing GIS expertise. Microsoft Access doesn t have any means to support fiber trace and connectivity of fibers and ITS customized symbology and wireless network visualization Data Management and Applicability Data recovery and retrieval is important in an asset management system. In case of system failure or lost data, recovery is paramount. A centralized database system is vital in such a case where all the users share the same database and it is stored centrally so that every user does not need to backup the data. NexusWorx and Enterprise Based GIS support this function; Microsoft Access will require some additional improvement to utilize this function completely. Another important issue is when multiple users are accessing the same database, there is a possibility that the data will be overwritten. Due to this issue the system has to have an administrator to validate the data before it gets updated. Using this protocol will enable data validation and the probability 78
92 of having errors in the database will be minimized. All systems need to modify the database updating principle to address this requirement User Interface Ease of use refers to the user friendliness of the system, which includes how much effort is required to understand and use the functions of the system for ITS users. As NexusWorx has specifically customized and ITS user focused system it is more user friendly than other systems but enterprise based GIS system will be friendly as well with customization. Microsoft Access is not suitable or applicable to handle all the typical requirements of an ITS asset management system. Learning curve is a very important issue because if the system requires a lot of time and effort to be able to proficiently use the system then eventually it will be hard to implement. NexusWorx is a simple ITS asset focused system so the average personnel with a little exposure to this system will be able to efficiently use the system. In general GIS is a complex system and more training is needed than NexusWorx to develop an expertise. But in an Enterprise based GIS system the time requirement is very low if the system is effortlessly customized for ITS asset management. Microsoft access is a relatively easy system regarding the time requirement to be proficient to use the system compared to NexusWorx and Enterprise based GIS. This MOE is divided into two categories; exisiting system straight out of the box and the other one that will support the user defined customization. 79
93 Customized import functionality for straight out of the box will allow the system to use that data in a variety of formats because often the input data is in various formats rather than one single type. This capability is essential when the system is required to import the database from other sources and create a whole new database. It is much more efficient to use existing data formats used by an agency. NexusWorx and Enterprise based GIS supports a variety of import file/data types but Microsoft Access does not have this capability. NexusWorx supports all the required variety of import file types that is required to support and Enterprise based GIS also have similar functionality if straight out of the box system is considered. Customized import functionality for supporting customer defined customization provides the flexibility to users so that they can add the database into their desirable format. For supporting user defined customization Enterprise based GIS will be able to support this MOE but NexusWorx will require adding this functionality on top of the existing system Remote Access Most agencies prefer a web based system because it requires less software components and easy access from anywhere with a simple internet connection. NexusWorx is a web based system and Enterprise based GIS might require the system administrator to put the software into the central network to allow a web based accessible system. Field updating is important 80
94 during maintenance work or while upgrading ITS assets. NexusWorx and Enterprise based GIS both will be able to support this criteria however Microsoft Access will not be capable of meeting this requirement. While updating or accessing a database there should be a hierarchical system. This implies that not everyone will be able to edit or update the system but everyone should be able to access the database. Both NexusWorx, and Enterprise based GIS with some modification of the system, will be able to support this access control function. Microsoft Access will not be able to support this Enterprise Capability In many instances, users may need to use the system simultaneously. Most recently developed systems have an option to address whether multiple users can access the system simultaneously or not. NexusWorx is an enterprise based system and Enterprise based GIS also has an enterprise version SDEGIS, so they completely meet this requirement of an ITS asset management system. Microsoft Access fails to meet this requirement Cost Evaluation The cost evaluation was performed based on the actual cost of the systems. These costs were then converted into relative rating values to be used in the multi-attribute utility models. The costs of the systems are summarized in Table 4.6 and 4.7. NexusWorx cost components were obtained 81
95 from the vendor of the NexusWorx. The cost of Microsoft Access was not considered as this system was base line and only studied for the system capabilities. Cost for SDEGIS came from ESRI. The personnel and operation and maintenance cost were obtained by consulting with local agency. In Table 4.6 the personnel, licensing and operations and maintenance costs were presented as capital cost and annual cost. The cost components were then converted to annual costs as presented in Table 4.7. Table 4.6 Annual and Capital Costs for Different Options Cost NexusWorx Enterprise Based GIS Microsoft Access (Vendor Hosting) (Client Server set up) Personnel 0 0 Software Licensing $60,000 to $80,000 (A) $180,000 to 200,000 (C) (New Setup) $60,000 to $80,000 (A) $40,000 to $60,000 (C) $10,000 to $15,000 (A) (Add-on to Existing Setup) 0 NA $100,000 to $300,000 (A) NA O&M 0 $25,000 to $35,000 (A) $40,000 to $60,000 (A) 0 NA (A) Annual cost (C) Capital Cost 82
96 Table 4.7 Annual Costs for Different Options Cost (5 year period) NexusWorx (Vendor Hosting) (Client Server set up) Personnel 0 0 Enterprise Based GIS (New Setup) (Add-on to Existing Setup) Microsoft Access $60,000 to 0 NA $80,000 1 Software Licensing $60,000 to $80,000 2 $39,000 to $44,000 3 $18,000 to $28,000 4 $100,000 to NA $300,000 5 O&M 0 1 yearly salary of $60,000-$80,000 $25,000 to $35,000 6 $40,000 to 0 NA $60, users each $3,000-$4,000 3 a inflation rate of 3% for a 5 year period with a capital cost of $180,000-$200,000 4 a inflation rate of 3% for a 5 year period with a capital cost of $40,000-$60,000 and an annual cost of $10,000-$15,000 5 a inflation rate of 3% for a5 year period with a capital cost of $100,000-$300,000 6 it is 20% of license cost for software licensing fee 7 yearly salary of $40,000-$60,000 In Table 4.7, different system deployment options with their standard price is presented. Price may vary by different factors, such as time of purchase and type of contract agreements. For deploying NexusWorx, there are two options; vendor hosting and client server setup. In the vendor hosting 83
97 setup, the database and server are provided and maintained by the vendor and the client only needs to purchase the license to use the system for an annual fee. The client server setup option has an initial setup cost where the agency will own their server and database system and will be responsible to maintain the servers. In the vendor hosting, there are two versions editor and viewer version. The Editor user has access to all functionality and can be used to edit or modify all features and connectivity. The Viewer allows user to access to all features except they add or modify features or connectivity. The Viewer can be used to perform some attribution edit that allows a user to effectively modify device information, such as model number, serial number, and installed date. Each editor version costs $3,000-$4,000 per year for vendor hosting and each viewer version costs $1,600 per year. In client server setup system each editor costs $10,000 (up to 10 users) and $7,000 (up to 20 users). Each viewer costs $3,500 (up to 10 users) and $2,700 (up to 20 users). In this evaluation, it was assumed that 20 users with the editor version. Additionally, for client server setup a 20% of total licensing fee will be charged as the annual fee for maintenance. For the yearly cost estimation, an inflation rate of 3% was used to convert them to present wroth value. Details cost information for NexusWorx is attached in Appendix 3. For Enterprise based GIS system, there are two options. First, a scenario where an agency does not own its Enterprise based GIS system and 84
98 has to purchase Enterprise based GIS system and needs to hire personnel to operate, maintain and use the GIS based system. This option is expensive and an inflation rate of 3% was considered for the personnel, and operation and maintenance costs. The cost for the software licensing was found from the ESRI and the system costs $40,000-$60,000 for the first year and it will cost $10,000-$15,000 from the second year. Second, in the scenario where the agency already own its GIS server and is using the system for other asset management purposes and keen to adopt on a centralized database system, could eventually add ITS AM system as an additional layer on their existing Enterprise based GIS system. For this study Intergraph Corporation was been contacting for the standard pricing because at present most of public agencies rely on the Intergraph for their utility management purposes and it will be integrate able with existing system. They might need to spend additional resource s in customizing Enterprise based GIS for managing ITS assets. From the Intergraph Corporation the price for software licensing was $5,000- $15,000 for each license yearly. For this study 20 users were considered for a 5 year timeframe. Based on the cost, a linear approach was used to translate these costs into relative ratings for each system. This was done to transfer cost values into same scale as of system capabilities so these cost components can feed into the multi-attribute utility analysis. Table 4.8 present s the basis converting the 85
99 cost components into relative ratings and Table 4.9 shows relative ratings for each system regarding costs. Table 4.8 Cost and Relative Ratings Cost Relative Rating <10, ,000-29, ,000-49, ,000-69,999 2 >70,000 1 Table 4.9 Relative Rating for Costs Relative Rating NexusWorx (Vendor Hosting) (Client Server set up) Enterprise Based GIS (New Setup) (Add-on to Existing Setup) Microsoft Access Personnel NA Software Licensing NA O&M NA 4.4 MULTI-ATTRIBUTE UTILITY ANALYSIS Multi-attribute analysis involved evaluating alternatives in terms of meeting the selected objective of an ITS asset management system. The alternatives are: NexusWorx Enterprise Based GIS 86
100 Microsoft Access Performance Rating for the MOEs Table 4.10 shows performance ratings related to different MOEs identified through the evaluation of selected asset management systems using the case study. For multi-attribute utility analysis two components were required: one is the performance rating for the attributes and the other is the utility value of each attribute. The performance ratings were derived from the case study and the utility values came from survey responses of public agency personnel. 87
101 Table 4.10 Performance Rating for MOE s Visualization Data Management and Applicability User Interface MOE NexusWorx Performance Rating (PR) Enterprise based GIS Microsoft Access Map Viewing Capability Spatial Query Fiber Trace and Connectivity of the Fibers Customized ITS Symbology Wireless Network Visualization Data Recovery and Retrieve Single Administrator Control Ease of Use of the Software Customized Import Functionality Customized Import Functionality Web Based Remote Access Enterprise Capability Field Updating/Usage Restricted Data Access Capability Multiple User Supporting Capability (Straight out of the box) 2 (Supporting user specific customization) In Figure 4.7, the performance ratings for the MOEs are presented. The performance rating was set on a scale of 0-5. In this rating 5 represents the 88
102 maximum performance of the system that will serve the MOE, and 0 represents lowest performance. Performance Rating for MOEs Multiple User Supporting Capability Restricted Data Access Capability Field Updating/Usage Web Based Customized Import Functionality2 Customized Import Functionality 1 Ease of Use of the Software Single Administrator Control Microsoft Access Enterprise Based GIS Nexusworx Data Recovery and Retrieve Wireless Network Visualization Customized ITS Interface Fiber Trace and Connectivity of the Fibers Spatial Analysis Map Viewing Capability Figure 4.7 Performance Rating (PR) for the MOEs 1 (Straight out of the box) 2 (Supporting user specific customization) 89
103 4.4.2 The Utilities of MOE s The utilities of the MOE s are based on the rating from survey responses. A nationwide survey was conducted and response from VDOT, TDOT, MnDOT, NCDOT, SCDOT and WsDOT was received. Two scenarios were considered while performing the analysis and the utilities were assigned accordingly. In one scenario, only system capabilities were considered and cost was ignored. In another scenario, both system capabilities and cost was considered Evaluation on System Capabilities This scenario evaluated only system capabilities of selected ITS asset management system. The utilities related to system capabilities of related MOEs add up to 1 under this scenario (Chowdhury and Tan, 2004). U 1 +U 2 +U 3 +U 4 +U 5 +U 6 +U 7 +U 8 +U 9 +U 10 +U 11 + U 12 +U 13 +U 14 =1.Equation
104 Table 4.11 The Utilities for the MOE Considering System Capabilities MOE Utility (U) Map Viewing Spatial Query Visualization Fiber Trace and Connectivity Customized ITS Symbology Wireless Network Visualization Data Recovery and Retrieval Single Administrator Control Ease of Use Customized Import Functionality Customized Import Functionality Web Based System Field Update and Usage Restricted Data Access Capabilities Multi-User Accessibility Simultaneously Total (Straight out of the box) 2 (Supporting user specific customization) Comprehensive Evaluation This scenario evaluated system capabilities along with the cost of license, operation and maintenance of selected ITS asset management 91
105 systems. The utility related to the system capabilities along with cost component related MOEs add up to 1 under this scenario. U 1 +U 2 +U 3 +U 4 +U 5 +U 6 +U 7 +U 8 +U 9 +U 10 +U 11 +U 12 +U 13 +U 14 +U 15 +U 16 +U 17 =1 Equation 4.2 Table 4.12 Utilities for the MOE (Considering Costs) MOE Utility (U) Map Viewing Capability Spatial Query Visualization Fiber Trace and Connectivity of the Fibers Customized ITS Symbology Wireless Network Visualization Data Recovery and Retrieve Single Administrator Control Ease of Use of the Software Customized Import Functionality Customized Import Functionality Web Based Field Updating/Usage Restricted Data Access Capability Enterprise Capability Cost of Personnel Cost of Software Licensing Cost of Operation of Maintenance of the System Total
106 1 (Straight out of the box) 2 (Supporting user specific customization) Total Utility Total utility for a system is estimated by multiplying each performance rating with respective utility and then summing them up. The following subsections present the multi-attribute utility analysis based on system capability evaluation and comprehensive evaluation Multi-Utility Analysis for Alternatives (Considering System Capabilities) The multi-attribute utility value determined by considering system performance is presented in Table Highlighted values represent maximum value of utility (U) and performance rating (PR) for each MOE among the systems. 93
107 Table 4.13 Multi-Attribute Utility Analysis (Considering System Capabilities) MOE Utility (U) NexusWorx Enterprise based GIS Microsoft Access PR * U*PR PR U*P PR U*P Map Viewing Capability Spatial Query Fiber Trace and Connectivity of the Fibers Customized ITS Symbology Wireless Network Visualization Data Recovery and Retrieve Single Administrator Control Ease of Use of the Software Customized Import Functionality Customized Import Functionality Web Based Field Updating/Usage Restricted Data Access Capability Enterprise Capability Total *PR stands for performance rating 1 (Straight out of the box) 2 (Supporting user specific customization) MUA=U 1 PR 1 +U 2 PR 2 +U 3 PR 3 +U 4 PR 4 + U 5 PR 5 + U 6 PR 6 + U 7 PR 7 +U 8 PR 8 + U 9 PR 9 +U 10 PR 10 +U 11 PR 11 +U 12 PR 12 +U 13 PR 13 +U 14 PR 14 Equation
108 Calculations MU NexusWorx = 0.071* * * * * * * * * * * * * *5 MU NexusWorx =4.46 Total Utility (for Vendor hosting and Client Server Setup) MU SDEGIS = 0.071* * * * * * * * * * * * * *5 MU SDEGIS =4.61 Total Utility (for New Setup and In Addition to Existing Setup) MU MicrosoftAccess = 0.071* * * * * * * * * * * * * *1 MU Microsoft Access =1.06 Total Utility From the analysis it is clear that Enterprise based GIS performed as good as the alternatives in meeting system requirements for an ITS asset management system. NexusWorx is the next best system Enterprise based GIS behind as an ITS asset management system. Microsoft Access performed poorly in the evaluation and it only reflects the base line condition. 95
109 Multi-Utility Analysis for Alternatives (Considering Comprehensive Evaluation) Both system capabilities and costs were considered in this analysis. The total multi utility for each alternative was calculated based on equation 4. Table 4.14 shows the multi-utility analysis for this scenario. 96
110 Table 4.14 Multi-Attribute Utility Analysis (Considering Comprehensive Evaluation) MOE Utility (U) NexusWorx 97 Enterprise based GIS VH CS NS ES PR U*PR PR U*PR PR U*PR PR U*PR Map Viewing Capability Spatial Query Fiber Trace and Connectivity of Fibers Customized ITS Symbology Wireless Network Visualization Data Recovery and Retrieve Single Administrator Control Ease of Use of the Software Customized ITS Interface Customized ITS Interface Web Based Field Updating/Usage Restricted Data Access Capability Enterprise Capability Cost of Personnel Cost of Software Licensing Cost of Operation and Maintenance of the System Total
111 1 (Straight out of the box) 2 (supporting user specific customization) MUA= U 1 PR 1 +U 2 PR 2 +U 3 PR 3 +U 4 PR 4 + U 5 PR 5 + U 6 PR 6 + U 7 PR 7 +U 8 PR 8 + U 9 PR 9 +U 10 PR 10 +U 11 PR 11 +U 12 PR 12 +U 13 PR 13 +U 14 PR 14 +U 15 PR 15 +U 16 PR 16 +U 17 PR 17 Equation 4.4 Calculations MU NexusWorx = 0.046* * * * * * * * * * * * * *5+0.1*5+0.16*2+0.1*5 MU NexusWorx =4.174 Total Utility (Vendor Hosting System) MU NexusWorx = 0.046* * * * * * * * * * * * * *5+0.1*5+0.16*3+0.1*3.5 MU NexusWorx =4.184 Total Utility (Client Server Setup) MU SDEGIS = 0.046* * * * * * * * * * * * * *5+0.1* *4+0.1*3.5 MU SDEGIS =4.089 Total Utility (New Setup) MU SDEGIS = 0.046* * * * * * * * * * * * * *5+0.1*5+0.16*1+0.1*5 MU SDEGIS =4.109 Total Utility (In addition to Existing Setup) For the comprehensive analysis, both NexusWorx and Enterprise based GIS were very close to each other. Comparing the cost and system capabilities, it was evident that if any agency has an Enterprise based GIS system deployed for managing other assets, and then adding a layer on top of existing system might be a good choice. However, if any agency does not have 98
112 an Enterprise based GIS system, then they might choose a customized ITS asset management tools or initiate an Enterprise based GIS system. 4.5 SUMMARY OF MULTI-UTILITY FOR ALTERNATIVES NexusWorx was found to be the best choice as an ITS asset management system. The analysis reflects that a customized ITS asset management system will be more desirable to agencies. However, there is a possibility that some organizations already have Enterprise based GIS implemented for other purposes and therefore will be attracted to Enterprise based GIS and could use GIS with some extra effort to a GIS based system. The multi-attribute analysis is summarized in Table 4.15 and the summary is graphically presented in figure 4.8. Table 4.15 Summary of the MUA for the Alternatives NexusWorx (Vendor Hosting) NexusWorx (Client Server System) Enterprise Based GIS (New Setup) Enterprise Based GIS (In Extension to Existing Setup) Microsfot Access Considering System Capabilities Evaluation (Total Utility) Considering Comprehensive Evaluation (Total Utility) NA 99
113 Summary of Multi-Attribute Utility Analysis Nexusworx (Vendor Hosting) Nexusworx (Client Server Setup) Enterprise Based GIS (New Setup) Enterprise Based GIS (In Extention to Existing Setup) 0 Without Considering Cost Considering Cost 0 Figure 4.8 Summary of Multi-Attribute Utility Analysis 100
114 4.6 QUALITY FUNCTION DEPLOYMENT A tool called quality function deployment addresses customer preferences, future planning considering the requirements, and setting up the target bench mark that will lead to modifying the system design in a manner that will be useful in dealing with all the requirements more appropriately while making the system cost effective. Figure 4.9 shows the House of Quality diagram which is a way to graphically represent quality function deployment analysis. In this analysis, the customer requirements were depicted from the customer response. 101

115 Figure 4.9 The House of Quality for NexusWorx 102
116 House of Quality basically validated the findings of the multi-attribute analysis and demonstrated which system capabilities need to be improved to increase the system efficiency. In this research House of Quality shows that NexusWorx and Enterprise based GIS satisfies most of the target benchmarks and these matches with the findings of the multi-attribute utility analysis. In brief, the analysis reflects that a customized ITS system or an existing Enterprise based GIS system will be more capable of meeting the goals of managing ITS systems. For Enterprise based GIS the assumption was that the add-ons required to meet the system capability requirements can be effortlessly implemented utilizing the existing in-house GIS experts. 103
117 5. CHAPTER: CONCLUSIONS AND RECOMMENDATIONS This chapter includes the conclusions derived from this research. The latter part of this chapter presents recommendations for utilizing the research results and future work in this area. 5.1 CONCLUSIONS An ITS asset management system that satisfies the requirements of the users is important for efficient online traffic management and control related resource management. This research identified user requirements for an effective ITS asset management system and evaluated three different asset management systems based on user requirements. A case study was developed depicting ITS infrastructure in the Spartanburg area of South Carolina. This ITS infrastructure included network design for wireless communication subsystems and connectivity between these subsystems. Results of the case study were used in the evaluation process addressing the future or planned wireless communication infrastructure in addition to the present wired communication system. A statewide survey was conducted with public agencies throughout the country to identify the requirements for an ITS asset management system. The survey responses revealed that the capability of the system to perform as a web based application and be able to serve multi-users were more heavily 104
118 weighted compared to other preferences. In addition, visualization, data management capabilities, and user friendliness were weighted highly. The cost of the system was weighted lower than the system capabilities, which included technical characteristics to fulfill requirements of managing ITS assets. Three types of systems were chosen for the evaluation. NexusWorx was chosen as a representative of a customized system for ITS asset management. Enterprise based GIS represented the existing Enterprise based GIS system deployed in many public agencies. Microsoft Access represented a basic data management system for managing asset inventory and it was evaluated as a base line system. All three representative systems were evaluated against the requirements that were identified based upon the survey of potential users at state agencies. Systems were rated based on how well they met each criterion. If a system required modification or additional add-on features for a selected criterion, it was rated low for that particular criterion. If the system met the requirement completely for a criterion then it was rated high. Multi-attribute utility analysis was performed to select the system with better performance and cost ratings for managing ITS assets. According the analysis, an Enterprise based GIS system was found to provide better utility to users, however, caution must be exercised in the results of this analysis. This comparison was made with the assumption that the Enterprise based GIS can 105
119 be added on top of existing system effortlessly utilizing the in-house expertise for managing GIS system. An Enterprise based GIS system may require some add-ons in the system for some functionality for ITS asset management that may not be supported by the in-house expertise. Moreover, in-house or external GIS experts may be required for operating and maintaining the database. Conversely, access based systems lack basic requirements, such as visualization capability. Additionally, they also lack mechanisms to permit the addition of such capabilities. Quality function deployment analysis was also performed to supplement these research findings, specifically House of Quality (HQ) analysis was used as the method. This HQ analysis visually demonstrated the utility of different asset management systems. Many DOTs have been using some type of asset management system based largely or wholly on either Access or GIS technology. Based on the survey of public agencies and evaluation conducted in this research, it seems likely that existing enterprise based GIS systems for ITS asset management offers more functionality and has a higher economical value that may appeal to public agencies. 106
120 5.2 RECOMMENDATIONS The following methodology is recommended for utilizing the results of this study: Public agencies should develop detailed requirements for an ITS asset management system in consultations with stakeholders. Public agencies should acquire and develop the asset management system that satisfies these requirements. Public agencies should, while developing the requirements, weight the technical properties of a potential ITS asset management system more than costs because for managing ITS assets, system capabilities were rated as the most important factor by many survey responses. A customized ITS AM systems could be a good choice if an agency wants to implement an AM system rather quickly and they do not have an enterprise based system and are not willing to invest resources in the development of features that satisfies their requirements. If an agency is more willing to adopt an off the shelf system for managing ITS assets, then a customized system could be a better choice. However, the agency should consider different options for deploying the system, such as vendor hosting or setting up client server system. If an agency is willing to share system provider s server and is reluctant to pay the initial capital cost for setting their own server, then the vendor hosting will be 107
121 more appropriate to them. In such situation, long term cost might outweigh the initial capital cost and at the same time the agencies can have their own secured server. If an agency has an Enterprise based GIS system and they can add ITS AM system on top of their existing system then agency should explore the feasibility of adding an ITS asset management module as a part of their Enterprise based GIS system. If an agency is willing to invest money to develop a GIS based asset management system, then they should investigate the cost and benefits of developing such a system. Future research should evaluate the prospect of developing a cost effective customized ITS asset management system using an off the shelf database management system, such as Enterprise based GIS or Microsoft Access, which meets stakeholder requirements. Future work should perform a more exhaustive evaluation of the performance of an Enterprise based GIS system against user requirements. This may require the participation of multiple GIS users in different enterprise environments. Future evaluation should include a customized ITS asset management system with open source architecture, which permits system modifications, thus obviating the need to rely on vendors to perform such tasks to meet any modification to stakeholder requirements. 108
122 Future evaluation efforts may include other ITS asset management systems, such as Bentley Fiber, OSPInSight and FiberTrak. The future experiments can be done by multiple users with different requirements in different sectors of the industry. Future research may focus on integrating the ITS asset management system with other existing asset management systems, such as pavement, highway, bridge, and tunnel management systems. Future research may also consider different test methods to evaluate the system capabilities and may consider other significantly important system capabilities that were not considered in this thesis. 109
123 APPENDICES 110
124 Appendix A The Initial Survey Questionnaire for the requirements development 1. What would be some of the requirements for the ITS asset management system? 2. Are you currently using any asset management application for ITS? a) If yes-are you satisfied with the present application? Could you elaborate on the current system? b) If No-Are you interested or feel the need for an ITS asset management system? 3. Do you have any plan to update the present asset management application? 4. Do you feel that your current system performs well? Explain. 5. Can you provide us with the evaluation report or data or any documentation? 111

125 The Final Survey for the requirements of ITS systems 112
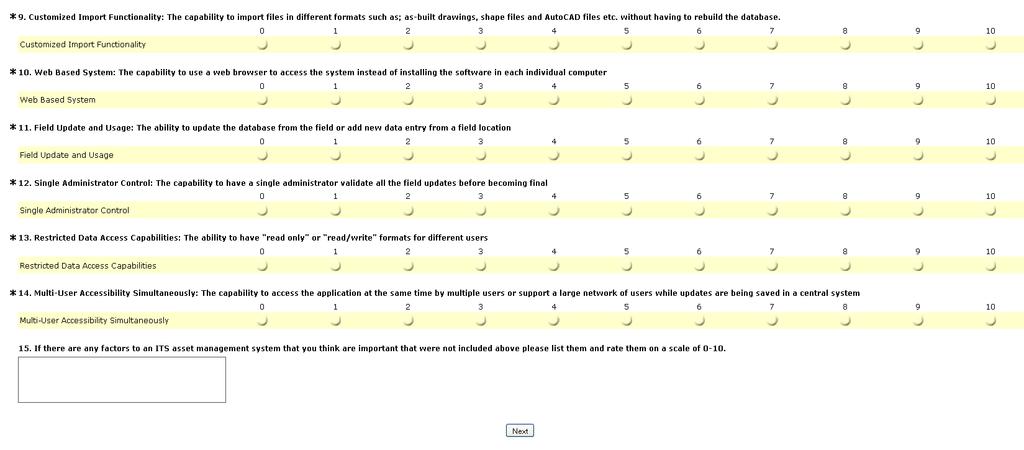
126 113
127 114
128 Appendix B The As-Built Drawing for the Study Site 115
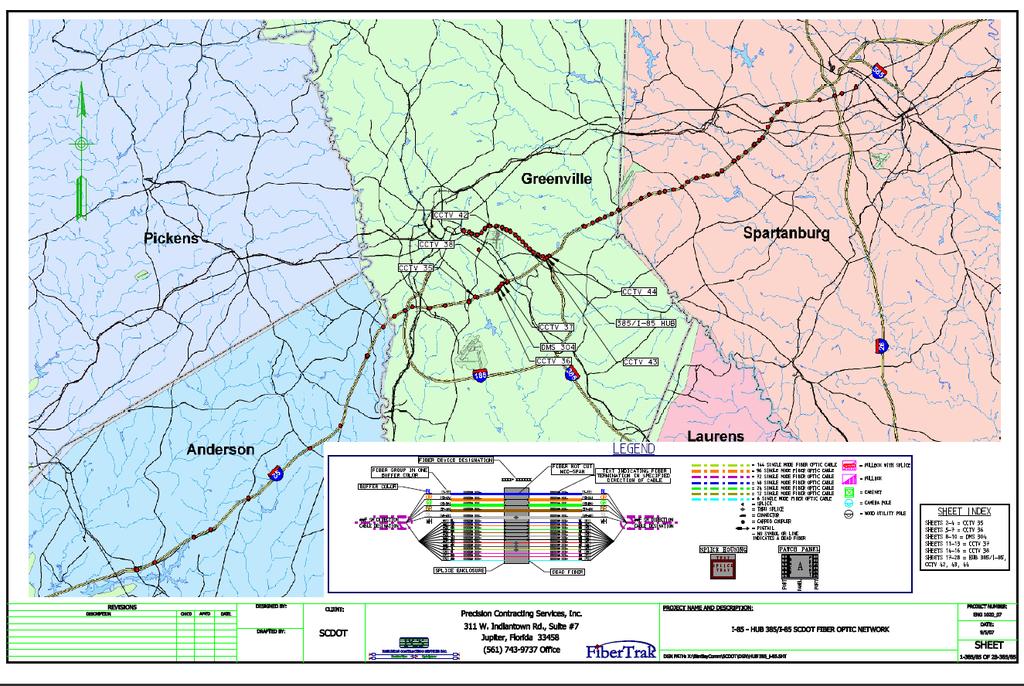
129 116
Pavement Management s Role in an Asset Management World
 Pavement Management s Role in an Asset Management World Kathryn A. Zimmerman, P.E. (Corresponding Author) Prashant Ram, E.I.T. Applied Pavement Technology, Inc. W. Main Street, Suite 00 Urbana, IL 0 Paper
VIRGINIA CENTRAL REGION ITS ARCHITECTURE IMPLEMENTATION PLAN
 VIRGINIA CENTRAL REGION ITS ARCHITECTURE IMPLEMENTATION PLAN Prepared for: Prepared by: June 23, 2009 i Table of Contents 1 INTRODUCTION... 1 2 USE OF ARCHITECTURE... 1 2.1 Architecture Use for Planning...
City of Dubuque: Smart Traffic Routing with Efficient & Effective Traffic System (STREETS) Final Report version 1.1
 Final Report version 1.1") City of Dubuque: Smart Traffic Routing with Efficient Final Report version 1.1 June 22, 2018 Submitted to: 17J18 0640 Prepared by Iteris, Inc. Iteris, Inc. i DOCUMENT VERSION CONTROL DOCUMENT NAME SUBMITTAL
City of Dubuque: Smart Traffic Routing with Efficient Final Report version 1.1 June 22, 2018 Submitted to: 17J18 0640 Prepared by Iteris, Inc. Iteris, Inc. i DOCUMENT VERSION CONTROL DOCUMENT NAME SUBMITTAL
Introduction. Background
 Example Transportation Asset Management Plan Outline This outline was created using the Transportation Asset Management Plan (TAMP) Builder ( www.tamptemplate.org ), a product of NCHRP Project 8-36/116.
The Evolution of Structures Asset Management in Wisconsin
 Dietsche, J.S. The Evolution of Structures Asset Management in Wisconsin April, 0 Word Count: 0 Joshua S. Dietsche Wisconsin Department of Transportation 0 Sheboygan Avenue, Room 0, Madison, WI 0 Phone:
Truck Parking Information Management System (TPIMS) Glossary
 Glossary") Truck Parking Information Management System (TPIMS) Glossary AASHTO American Association of State Highway and Transportation Officials is the organization that provides recommendations for a variety of
Truck Parking Information Management System (TPIMS) Glossary AASHTO American Association of State Highway and Transportation Officials is the organization that provides recommendations for a variety of
Chapter 9 IMPLEMENTATION AND FUTURE DEVELOPMENTS CHAPTER 9 IMPLEMENTATION AND FUTURE DEVELOPMENTS PAGE 111
 Chapter 9 IMPLEMENTATION AND FUTURE DEVELOPMENTS CHAPTER 9 IMPLEMENTATION AND FUTURE DEVELOPMENTS PAGE 111 This page intentionally left blank. PAGE 112 MINNESOTA GO MNDOT TRANSPORTATION ASSET MANAGEMENT
Addendum #3 to the Regional Transportation Plan
 Nashville Area Metropolitan Planning Organization Addendum #3 to the Regional Transportation Plan Effective November 21, 2018 Nashville Area Metropolitan Planning Organization 138 Second Avenue North Nashville,
INVESTMENT SCENARIOS CHAPTER Illustrative Investment Approaches Public Outreach 6-1
 CHAPTER 6 As detailed in Chapters 4 and 5, Texas multimodal transportation needs estimated at $21 billion annually (2014 constant dollars) illustrated in Exhibit 4-12 far outstrip the approximately $9.1
ASSET MANAGEMENT. Transportation Asset Management: Basics. Stephen Gaj Leader, System Management & Monitoring Team Office of Asset Management FHWA
 Transportation Asset Management: Basics Stephen Gaj Leader, System Management & Monitoring Team Office of Asset Management FHWA What is Transportation Asset Management? Transportation Asset Management
Transportation Asset Management FHWA Perspective
 Transportation Asset Management FHWA Perspective U.S. Department of Transportation Federal Highway Administration David R. Geiger April 5, 2006 Highway Agency FHWA Relationships AASHTO State DOTs Local
Intelligent Transportation System Maintenance A Key Component to the Future of an Intelligent Transportation System
 White Paper Intelligent Transportation System Maintenance A Key Component to the Future of an Intelligent Transportation System May 2, 2008 Final Version Prepared for: Florida Department of Transportation
TELLER COUNTY PUBLIC WORKS
 TELLER COUNTY PUBLIC WORKS DEPARTMENT OF TRANSPORTATION ROAD MAINTENANCE & IMPROVEMENT PLAN TABLE OF CONTENTS SECTION PAGE (S) TRANSPORTATION OPERATIONS.............. 3 OUR MISSION.....................
Framework for ADOT Asset Management System. Jean A. Nehme, PhD, PE Arizona Department of Transportation
 Framework for ADOT Asset Management System Jean A. Nehme, PhD, PE Arizona Department of Transportation November 14, 2013 Arizona Pavements/Materials Conference 1 Presentation Overview Brief Intro to Transportation
Chapter 3 - Goals, Objectives, & Strategies
 Chapter 3 - This chapter presents goals, objectives, and strategies that have been developed as part of the Richmond Area MPO 2026 Long-Range Transportation Plan (LRTP) update. Strategies have been developed
Freight and Rail Stakeholder Webinar. January 7, 2014
 Freight and Rail Stakeholder Webinar January 7, 2014 Agenda Modal Needs Baseline Revenue Modal Scenarios Website Statewide Freight Plan Statewide Rail Plan Jeff Carroll MULTIMODAL TRANSPORTATION NEEDS
Demonstrating the Benefits of Asset Management Implementation4
 Demonstrating the Benefits of Asset Management Implementation4 CAIT 2013 State of Good Repair Summit March 27, 2013 Sue McNeil Outline What is asset management? Anticipated benefits Realized benefits Less
DEPARTMENT OF TRANSPORTATION. AGENCY: Federal Highway Administration (FHWA), Department of Transportation
, Department of Transportation") This document is scheduled to be published in the Federal Register on 02/20/2015 and available online at http://federalregister.gov/a/2015-03167, and on FDsys.gov DEPARTMENT OF TRANSPORTATION [4910-22-P]
This document is scheduled to be published in the Federal Register on 02/20/2015 and available online at http://federalregister.gov/a/2015-03167, and on FDsys.gov DEPARTMENT OF TRANSPORTATION [4910-22-P]
1. INTRODUCTION. 1. Development and implementation of an accident prevention program
 ii PREFACE Mass transportation systems and specifically bus systems are a key element of the transportation network. While the safety record of bus transit operations has been very good, accidents still
BRIDGIT: User-Friendly Approach to Bridge Management
 BRIDGIT: User-Friendly Approach to Bridge Management HUGH HAWK National Engineering Technology Corporation, Canada ABSTRACT BRIDGIT is a bridge management system (BMS) software package intended to meet
MAP-21 National Highway Performance Program Asset Management Plan
 MAP-21 National Highway Performance Program Asset Management Plan Federal Highway Administration March 2015 Webcast MAP-21 FHWA Performance Rulemaking Schedule MAP-21: Asset Management 2 Risk-Based Asset
Transportation Improvement Program (TIP) Relationship to 2040 Metropolitan Transportation Plan (MTP) - Goals and Performance Measures
 Relationship to 2040 Metropolitan Transportation Plan (MTP) - Goals and Performance Measures") Mid-Region Metropolitan Planning Organization Mid-Region Council of Governments 809 Copper Avenue NW Albuquerque, New Mexico 87102 (505) 247-1750-tel. (505) 247-1753-fax www.mrcog-nm.gov Transportation
Mid-Region Metropolitan Planning Organization Mid-Region Council of Governments 809 Copper Avenue NW Albuquerque, New Mexico 87102 (505) 247-1750-tel. (505) 247-1753-fax www.mrcog-nm.gov Transportation
Chapter 15: Asset Management System
 Chapter 15: Asset Management System In this section, the phrase asset management system refers neither to an organization, a set of procedures, or a logical structure, but to software, that is, a tool
Contact: Tom Counts Corporate Vice-President Geospatial Solutions
 The Impact of Geography on Network Engineering 2005 ESRI International Users Conference and Telecom Summit Contact: Tom Counts Corporate Vice-President Geospatial Solutions 1-256-864-0400 tcounts@telcordia.com
With the challenges facing Washington s transportation
 CHAPTER 5 REACHING THE VISION HOW WILL WE GUIDE OURSELVES MOVING FORWARD? With the challenges facing Washington s transportation system, the project team and partners identified four focus areas that consistently
In this Issue: TRB National Cooperative Highway Research Program (NCHRP) Table of Contents
 Table of Contents") Item 1. Research Digest FORWARD ALL REQUESTS TO: The University of Texas at Austin Center for Transportation Research Library 1616 Guadalupe St. Suite 4.202 Austin, Texas 78701 Phone: (512) 232-3126 Email:
Item 1. Research Digest FORWARD ALL REQUESTS TO: The University of Texas at Austin Center for Transportation Research Library 1616 Guadalupe St. Suite 4.202 Austin, Texas 78701 Phone: (512) 232-3126 Email:
State of the Art and State of the Practice in Pavement Maintenance
 A3C05: Committee on Pavement Maintenance Chairman: James S. Moulthrop State of the Art and State of the Practice in Pavement Maintenance JAMES S. MOULTHROP, Koch Pavement Solutions ROGER E. SMITH, Texas
1: INTRODUCTION AND PROCESS OVERVIEW
 GPATS Long-Range Transportation Plan 1: INTRODUCTION AND PROCESS OVERVIEW INTRODUCTION affects everyone in many ways and plays a critical role in shaping a region s physical and social infrastructure.
Intelligent Transportation Systems
 Intelligent Transportation Systems TABLE OF CONTENTS Introduction... 3 Background... 3 Existing Conditions... 4 Traffic Signals... 4 Transit... 6 Parking... 6 Staffing... 7 Best Practices... 8 Recommendations...
A COMPREHENSIVE BRIDGE PRESERVATION PROGRAM TO EXTEND SERVICE LIFE. Bruce Johnson 1
 Abstract A COMPREHENSIVE BRIDGE PRESERVATION PROGRAM TO EXTEND SERVICE LIFE Bruce Johnson 1 Bridges represent a large investment in highway systems. As highway systems age, agencies should optimize the
ODOT Asset Management Plan 0
 ODOT Asset Management Plan 0 Table of Contents Executive Summary... 1 ODOT s Experience with Asset Management... 1 A New Way of Doing Business... 2 ODOT s Investment Plans... 3 Moving Forward... 5 1.0
Transportation Asset Management Plan. July 2014 Draft
 Transportation Asset Management Plan July 2014 Draft Executive Summary EXECUTIVE SUMMARY PAGE i This page intentionally left blank. PAGE ii MINNESOTA GO MNDOT TRANSPORTATION ASSET MANAGEMENT PLAN EXECUTIVE
Designing the Future of NMDOT
 Designing the Future of NMDOT NM Infrastructure Finance Conference October 28, 2015 Anne McLaughlin, Statewide Planning Bureau Chief Tamara P. Haas, P.E. Asset Management & Planning Division Director Tamarap.Haas@state.nm.us
9.0 Meeting the Challenges
 9.0 Meeting the Challenges 9.1 SLRTP Goals The SLRTP is built around the six TxDOT Strategic Plan goals. 1. Develop an organizational structure and strategies designed to address the future multimodal
Chapter 12: Transportation Safety & Security CHARLOTTE COUNTY PUNTA GORDA MPO 2035 LONG RANGE TRANSPORTATION PLAN
 Chapter 12: Transportation Safety & Security CHARLOTTE COUNTY PUNTA GORDA MPO 2035 LONG RANGE TRANSPORTATION PLAN CHARLOTTE COUNTY PUNTA GORDA MPO 2035 LONG RANGE TRANSPORTATION PLAN Transportation Safety
Iowa Department of Transportation Intelligent Work Zone Deployments
 Iowa Department of Transportation Intelligent Work Zone Deployments SMARTER WORK ZONES TECHNOLOGY APPLICATIONS CASE STUDY The Every Day Counts Initiative (EDC-3) aims to accelerate the deployment of identified,
Technical Methods Part 2
 Technical Methods Part 2 Performance Measurement in Transportation Planning Leading for results means that performance must be planned, not just reported Learning Objectives Describe a sample technical
THE FIVE GOALS FOR SCDOT S STRATEGIC PLAN ARE: GOAL 1: Improve safety programs and outcomes in our high-risk areas.
 THE FIVE GOALS FOR SCDOT S 2018-2020 STRATEGIC PLAN ARE: GOAL 1: Improve safety programs and outcomes in our high-risk areas. GOAL 2: Maintain and preserve our existing transportation infrastructure. GOAL
Americans are accustomed to easy mobility
 Highway Infrastructure Preservation Principles of Pavement Preservation Definitions, Benefits, Issues, and Barriers LARRY GALEHOUSE, JAMES S. MOULTHROP, AND R. GARY HICKS 4 Galehouse is Director, National
Technical Report Documentation Page
 Technical Report Documentation Page 1. Report No. SWUTC/14/600451-00089-1 2. Government Accession No. 3. Recipient's Catalog No. 4. Title and Subtitle Productivity-based Approach to Valuation of Transportation
2014 NWPMA Conference
 2014 NWPMA Conference Asset Management The Big Picture Factors contributing to asset management Status of asset management in state DOTs Current TAM initiatives Future trends Presented By: Katie Zimmerman,
ASSET MANAGEMENT. Risk Based Transportation Asset Management. Stephen J. Gaj Leader, System Management & Monitoring Team Office of Asset Management
 Risk Based Transportation Asset Management Stephen J. Gaj Leader, System Management & Monitoring Team Office of Asset Management What is Asset Management? Asset Management is a distinct way of doing business.
STRATEGIC PLAN
 Adopted January 23, 2017 TABLE OF CONTENTS EXECUTIVE SUMMARY... 2 1 INTRODUCTION... 2 2 PROGRAM OPERATIONS... 3 2.1 PROGRAM OVERVIEW... 3 3 REVIEW OF 2013-2016 STRATEGIC PLAN... 8 3.1 GOAL STATUS... 8
EXHIBIT A SCOPE OF SERVICES FOR FINANCIAL PROJECT ID TRANSPORTATION SYSTEM MANAGEMENT & OPERATIONS (TSM&O) GENERAL CONSULTANT SERVICES
 GENERAL CONSULTANT SERVICES") EXHIBIT A SCOPE OF SERVICES FOR FINANCIAL PROJECT ID 432430-1-32-13 TRANSPORTATION SYSTEM MANAGEMENT & OPERATIONS (TSM&O) GENERAL CONSULTANT SERVICES DISTRICT TWO November 27, 2017 Page 1 EXHIBIT A SCOPE
EXHIBIT A SCOPE OF SERVICES FOR FINANCIAL PROJECT ID 432430-1-32-13 TRANSPORTATION SYSTEM MANAGEMENT & OPERATIONS (TSM&O) GENERAL CONSULTANT SERVICES DISTRICT TWO November 27, 2017 Page 1 EXHIBIT A SCOPE
PUTTING YOUR NETWORK INFORMATION AT YOUR FINGERTIPS
 Introduction N etworks. You build them. You own them. Your Clients rely on them. The World relies on them. But in a blink of an eye you could lose your entire network s valuable data. You want to protect
AASHTO Highway Subcommittee on Maintenance PPR: Support the Development of a Pilot Certification Program for Pavement Preservation
 PPR: Support the Development of a Pilot Certification Program for Pavement Preservation WHEREAS, the AASHTO Highway Subcommittee on Maintenance has recognized the tremendous value of cost-effective pavement
Applying PSM to Enterprise Measurement
 Applying PSM to Enterprise Measurement Technical Report Prepared for U.S. Army TACOM by David Card and Robert MacIver Software Productivity Consortium March 2003 SOFTWARE PRODUCTIVITY CONSORTIUM Applying
Addendum 1: Performance Measures
 Addendum 1: 2 Addendum Livability 2040 Regional Transportation Plan Table of Contents 1.0 Introduction... 3 Federal Requirements... 3 MPO Measure Targets... 4 2.0 Safety Measure Targets... 9 3.0 Transit
Practical Steps Towards Mature Asset Management. Blake Langland
 Practical Steps Towards Mature Asset Management Blake Langland What is Transportation Asset Management? Transportation Asset Management is a strategic and systematic process of operating, maintaining,
USING REMAINING SERVICE LIFE AS THE NATIONAL PERFORMANCE MEASURE OF PAVEMENT ASSETS
 Mack, Sullivan 1 1 2 3 4 5 6 7 8 9 10 11 12 13 14 15 16 17 18 19 20 21 22 23 24 25 26 27 28 29 30 31 32 33 34 USING REMAINING SERVICE LIFE AS THE NATIONAL PERFORMANCE MEASURE OF PAVEMENT ASSETS Word Count
Federal Highway Administration s Role in Bridge Preservation. Anwar S. Ahmad 1
 Federal Highway Administration s Role in Bridge Preservation Anwar S. Ahmad 1 Abstract The purpose of this paper is to provide a brief overview of the bridge preservation efforts in the United States and
A Guide for Local Governments: EAM and GIS for Complete Asset Management
 29 91 $1,487 A Guide for Local Governments: EAM and GIS for Complete Asset Management A Guide for Local Governments: EAM and GIS for Complete Asset Management Think back to a time before smartphones. You
AASHTO S SUBCOMMITTEE ON ASSET MANAGEMENT
 AASHTO S SUBCOMMITTEE ON ASSET MANAGEMENT November 6, 2007 Director Kirk T. Steudle Michigan Department of Transportation Chair, AASHTO Subcommittee on Asset Management AASHTO SUBCOMMITTEE ON ASSET MANAGEMENT
DISTRIBUTION SYSTEM ASSET MANAGEMENT APPROACH
 EB-0-0 Exhibit D Schedule Page of DISTRIBUTION SYSTEM ASSET MANAGEMENT APPROACH This document provides a summary of THESL s asset management approach. The first two sections introduce the scope of asset
NCHRP 07-21: Asset Management Guidance for Traffic Control Devices, Barriers, and Lighting
 NCHRP 07-21: Asset Management Guidance for Traffic Control Devices, Barriers, and Lighting 2014 ATSIP Annual Meeting Presented by Nancy Lefler Vanasse Hangen Brustlin, Inc. Agenda Background Objective
The Highway Economic Requirements System (HERS): How HERS Works
: How HERS Works") The Highway Economic Requirements System (HERS): How HERS Works presented to Committee for a Study of the Future Interstate Highway System presented by Rich Margiotta, Ph.D. December 20, 2016 What We ll
The Highway Economic Requirements System (HERS): How HERS Works presented to Committee for a Study of the Future Interstate Highway System presented by Rich Margiotta, Ph.D. December 20, 2016 What We ll
Adaptation of HERS-ST Models for the South Carolina Interactive Interstate Management System
 Adaptation of HERS-ST Models for the South Carolina Interactive Interstate Management System presented to the Transportation Research Board HERS Modeling and Data Integration Conference presented by William
TRANSPORTATION PERFORMANCE MANAGEMENT
 MAY 2018 TRANSPORTATION PERFORMANCE MANAGEMENT PAVEMENT PERFORMANCE MANAGEMENT PAVEMENT PERFORMANCE REQUIREMENTS The Federal Highway Administration (FHWA) published in the Federal Register (82 FR 5886)
Operations in the 21st Century DOT Meeting Customers Needs and Expectations
 Operations in the 21st Century DOT Meeting Customers Needs and Expectations 1 Purpose of this Meeting: Share Thoughts & Discuss Challenges brought about by the changing transportation environment and public
Geospatial Network Management. Understanding the business value and benefits of GIS within the telecommunications industry
 Presenting Geospatial Network Management Understanding the business value and benefits of GIS within the telecommunications industry Enabling Operational Support Systems ESRI LAUC 2003 Bolivia Presenting
PERFORMANCE-BASED PLANNING AND PROGRAMMING
 February 2017 performance-based planning and programming Boston Region MPO PERFORMANCE-BASED PLANNING AND PROGRAMMING WHAT IS PERFORMANCE-BASED PLANNING AND PROGRAMMING? Performance-based planning and
Congestion Management Process (CMP)
") Congestion Management Process (CMP) Introduction The Congestion Management Process (CMP) is a systematic, data-driven, and regionally accepted approach that aims to improve the performance of the transportation
Congestion Management Process (CMP) Introduction The Congestion Management Process (CMP) is a systematic, data-driven, and regionally accepted approach that aims to improve the performance of the transportation
IDOT PERFORMANCE BASED PROJECT METRICS. February 2018
 IDOT PERFORMANCE BASED PROJECT METRICS February 2018 March 5, 2018 2 What is Performance Management? Performance Management of the Federal Highway Program is a systematic approach to making investment
2040 Addendum Performance-Based Planning November 2018
 2040 Long Range Transportation Plan 2040 Addendum Performance-Based Planning November 2018 Adopted June 13, 2018 250 S. Orange Ave, Suite 200, Orlando, FL 32801 407-481-5672 www.metroplanorlando.org MetroPlan
AASHO Road Test and first SHRP are examples of special-purpose research programs. First SHRP research was about ; implementation activities
 1 AASHO Road Test and first SHRP are examples of special-purpose research programs. First SHRP research was about 1987-1993; implementation activities seem to have begun around 1992 with funds from subsequent
The Silver Bullet: How to Use the National Bridge Investment Analysis System to Develop Bridge Targets and Risk Based Asset Management Plans
 The Silver Bullet: How to Use the National Bridge Investment Analysis System to Develop Bridge Targets and Risk Based Asset Management Plans FHWA 1 Topics What NBIAS Does How it Does it How to use the
Transportation Report to SPC on Transportation and Transit 2017 April 19. ISC: UNRESTRICTED TT Page 1 of 7
 Page 1 of 7 EXECUTIVE SUMMARY The City of Calgary owns and maintains over 12,200 km of sidewalks, curbs and gutters with a current replacement value of $5.1 billion. The quality of new concrete and condition
The Ohio Department of Transportation Asset Management Playbook Plays for Success
 The Ohio Department of Transportation Asset Management Playbook 2017 8 Plays for Success The Ohio Department of Transportation Asset Management Playbook 1 Contents Introduction 2 Challenge 1: Flat Funding
Driveway Permits Following Guidelines PLANNING REQUIREMENTS CAPABILITIES ASSISTANCE ACCESS MANAGEMENT LAND USE CONTROLS ECONOMIC DEVELOPMENT
 CHAPTER 5 Access Management PASSIVE Driveway Permits Following Guidelines Comprehensive Access Management PLANNING REQUIREMENTS Access Restrictions CAPABILITIES Process ASSISTANCE ACCESS MANAGEMENT LAND
Esri Solutions for Weather Maintenance Snow and Ice Management
 Esri Solutions for Weather Maintenance Snow and Ice Management Become a Modern Snow Fighter Today s winter maintenance professionals use geographic information system (GIS) technology to meet the challenges
SOME STRATEGIES FOR SUSTAINABLE MAINTENANCE OF RURAL ROADS IN INDIA Agarwal, P. K 1 *, Singh, A. P. 2
 Research Article SOME STRATEGIES FOR SUSTAINABLE MAINTENANCE OF RURAL ROADS IN INDIA Agarwal, P. K 1 *, Singh, A. P. 2 Address for Correspondence * 1 Associate Professor, Department of Civil Engineering,
Chandler Duncan. Economic Development Research Group, Inc.
 Chandler Duncan Economic Development Research Group, Inc. www.edrgroup.com 1 Allowing an infrastructure asset to fall below previously accepted standards of condition or performance by either investing
Canadian Infrastructure Report 2012: Highlights
 Canadian Infrastructure Report 2012: Highlights The inaugural Canadian Infrastructure Report Card was released September 11, 2012 by the Canadian Society for Civil Engineering (CSCE), the Canadian Public
Corpus Christi Metropolitan Transportation Plan Fiscal Year Introduction:
 Introduction: Traffic congestion in the Corpus Christi Metropolitan area is not as much a function of population growth as the function of the increase in single occupant trips. Using census data, the
2. Guiding Principles, Objectives, and Policies
 2. Guiding Principles, Objectives, and Policies INTRODUCTION The guiding principles for the 2040 MTP Update establish the vision and key focus areas for this planning effort. They combine the guidance
Raymond Munch, Interim City Manager Marc Thorson, Information Technology Director
 DATE: December 12, 2018 TO: FROM: SUBJECT: Honorable Mayor Jerry Smith City Council Raymond Munch, Interim City Manager Marc Thorson, Information Technology Director Authorizing the Design and Construction
Metropolitan Planning Organization Safety Performance Measures Fact Sheet
 Metropolitan Planning Organization Safety Fact Sheet Safety The Safety Performance Management Measures regulation supports the Highway Safety Improvement Program (HSIP) and requires State Departments of
RTC Mobility Plan Workshop. North Central Texas Council of Governments July 9, 2015
 RTC Mobility Plan Workshop North Central Texas Council of Governments July 9, 2015 Agenda 1. Introduction to the Metropolitan Transportation Plan (MTP) 2. New Planning Parameters 3. Emerging Planning and
LOU LAMBERT, DEPUTY DIRECTOR BUREAU OF TRANSPORTATION PLANNING
 LOU LAMBERT, DEPUTY DIRECTOR BUREAU OF TRANSPORTATION PLANNING FIVE MAJOR AREAS Evolving Process of Strategic Analysis New Paradigm in Transportation Current Activities in Asset Management Michigan Business
Quantifying the Benefits of Pavement Management
 Quantifying the Benefits of Pavement Management Smadi, O Research Scientist Iowa State University Ames, Iowa, USA SYNOPSIS Pavement management systems (PMS) have been in operation since the early 1970s
The Future Interstate Study: Materials of Construction and their Impact
 The Future Interstate Study: Materials of Construction and their Impact Narayanan Neithalath Professor School of Sustainable Engineering and the Built Environment Arizona State University, Tempe, AZ Narayanan.Neithalath@asu.edu
APPENDIX A: SHORT-TERM PROJECT DEPLOYMENTS
 APPENDIX A: SHORT-TERM PROJECT DEPLOYMENTS Page 1 of 15 ST-01: I-95 ITS DEPLOYMENT (DE STATE LINE TO AIRPORT) PROJECT DESCRIPTION AND SCOPE: Project will address gaps in ITS device coverage on I-95 from
Appendix E-1. FDOT MPO Program Management Handbook. (Excerpts)
") Appendix E-1 FDOT MPO Program Management Handbook (Excerpts) TABLE OF CONTENTS Chapter 4 Long-Range Transportation Plan Section Page 4.1 PURPOSE... 4-2 4.2 AUTHORITY... 4-2 4.3 SCOPE... 4-2 4.4 REFERENCES...
Appendix E-1 FDOT MPO Program Management Handbook (Excerpts) TABLE OF CONTENTS Chapter 4 Long-Range Transportation Plan Section Page 4.1 PURPOSE... 4-2 4.2 AUTHORITY... 4-2 4.3 SCOPE... 4-2 4.4 REFERENCES...
APPENDIX A PLANNING PROCESS FOR RURAL AREAS OF THE STATE
 APPENDIX A PLANNING PROCESS FOR RURAL AREAS OF THE STATE Background SCDOT Statewide Transportation Planning Process Consultation Cooperation with Local Officials in Non-Metropolitan (Rural) Areas SCDOT
INDIANA S INTERMODAL MANAGEMENT SYSTEM Stephen C. Smith Planning Manager, Transportation Planning Division Indiana Department of Transportation
 96 INDIANA S INTERMODAL MANAGEMENT SYSTEM Stephen C. Smith Planning Manager, Transportation Planning Division Indiana Department of Transportation Indiana is in the process of developing an Intermodal
Asset Management Plans for the National Highway System
 Asset Management Plans for the National Highway System Stephen Gaj Leader, Asset Management Team Office of Asset Management, Pavements, and Construction FHWA What is Asset Management? From 23 USC 101(a)(2):
Tourism Informatization Research under the Mode of Internet of Things. Gangzhi Guo
 6th International Conference on Machinery, Materials, Environment, Biotechnology and Computer (MMEBC 2016) Tourism Informatization Research under the Mode of Internet of Things Gangzhi Guo School of Culture
AASHTO Manual for Bridge Evaluation: Section 3, Bridge Management Systems A Practical Tour
 0 0 0 AASHTO Manual for Bridge Evaluation: Section, Bridge Management Systems A Practical Tour Dave Juntunen P.E. Michigan Department of Transportation Bridge Development Engineer Vice-Chair AASHTO SCOBS
FLORIDA DEPARTMENT OF TRANSPORTATION. District Six Intermodal Systems Development Office
 FLORIDA DEPARTMENT OF TRANSPORTATION District Six Intermodal Systems Development Office SCOPE OF SERVICES Transportation Statistics Support # 1 & 3 FM: Contract #: Major work type Transportation Statistics
Utah Transportation Asset Management Plan. April 4, 2018
 Utah Transportation Asset Management Plan April 4, 2018 Executive Summary EXECUTIVE SUMMARY INTRODUCTION TO THE UTAH TRANSPORTATION ASSET MANAGEMENT PLAN (TAMP) The Utah Transportation Asset Management
Pavement Management 101 White Paper
 Pavement Management 101 White Paper Executive Summary: Communities throughout the U.S. are challenged to meet funding needs for maintaining, operating, and improving their roadway systems. The most cost
THE KEY TO OPTIMIZING YOUR WATER UTILITY. A Guide to Operations Management Cartegraph Systems, Inc. All rights reserved.
 THE KEY TO OPTIMIZING YOUR WATER UTILITY A Guide to Operations Management THE KEY TO OPTIMIZING YOUR WATER UTILITY A GUIDE TO OPERATIONS MANAGEMENT From drinking and cooking to bathing and cleaning, water
FUNDING FOR HIGHWAY ASSET CONSTRUCTION AND MAINTENANCE: SUSTAINABLE ALTERNATIVES TO THE TRADITIONAL GAS TAX
 FUNDING FOR HIGHWAY ASSET CONSTRUCTION AND MAINTENANCE: SUSTAINABLE ALTERNATIVES TO THE TRADITIONAL GAS TAX Author: Matthew Volovski Purdue University mvolovsk@purdue.edu INTRODUCTION The funding needed
CONTENTS EXECUTIVE SUMMARY... 1
 Created in 1965, the Delaware Valley Regional Planning Commission (DVRPC) is an interstate, intercounty and intercity agency that provides continuing, comprehensive and coordinated planning to shape a
NORTHERN VIRGINIA TRANSPORTATION AUTHORITY
 XII NORTHERN VIRGINIA TRANSPORTATION AUTHORITY M E M O R A N D U M TO: FROM: Chairman Martin E. Nohe and Members Northern Virginia Transportation Authority Mary Hynes, Chairman, Governance and Personnel
Design and Implementation of a New Bridge Management System for the Ministry of Transport of Québec
 Design and Implementation of a New Bridge Management System for the Ministry of Transport of Québec Reed M. Ellis Stantec Consulting Ltd. Paul D. Thompson Consultant Rene Gagnon Ministère des Transports,
The Value of Location Intelligence in the Communications Industry
 Solutions for Enabling Lifetime Customer Relationships. The Value of Location Intelligence in the Communications Industry W HITE PAPER: COMMUNICATIONS Christopher Cherry Director of Communications Industry
AGING AND FAILING INFRASTRUCTURE SYSTEMS: HIGHWAY BRIDGES
 AGING AND FAILING INFRASTRUCTURE SYSTEMS: HIGHWAY BRIDGES September 14, 2015 1100 EDT. PREPARED BY: OFFICE OF CYBER AND INFRASTRUCTURE ANALYSIS SCOPE The Department of Homeland Security Office of Cyber
TBARTA 2015 Regional Transportation Master Plan 2040 Regional Long Range Transportation Plan AUGUST 2015
 TBARTA 2015 Regional Transportation Master Plan AUGUST 2015 Table of Contents 1.0 Introduction... 2 1.1 Updating the Master Plan... 2 1.2 About this Document... 2 2.0 Regional Long Range Transportation
Performance Measures
 Performance Measures PERFORMANCE MEASURES Under the previous transportation act Moving Ahead for Progress in the 21 st Century (MAP-21) and the current transportation act Fixing America s Surface Transportation