EM&V 2.0 Cutting through the fog: What s Different and What s the Same (relative to traditional EM&V) June 23, 2016
|
|
|
- Stephany Scott
- 6 years ago
- Views:
Transcription

1 EM&V 2.0 Cutting through the fog: What s Different and What s the Same (relative to traditional EM&V) June 23, 2016
2 OVERVIEW 1. Background and Introductions 2. Continuous Measurement for Residential DSM 3. Industry and R&D Needs: Key Issues in M&V Q&A 5. Next Steps 1
3 BACKGROUND Forum EM&V 2.0 Project 1. March 30 EM&V 2.0 Workshop (Hartford CT) 2. June 23 EM&V 2.0 Webinar (today!) 3. Sept 22 EM&V 2.0 Workshop (Part 2) Berlin, CT preceded by Residential lighting and HEMS workshops (Sept 20-21). Registration info forthcoming 4. November EM&V 2.0 Briefing - research on developments in industry, vendor profiles, case studies, and update on piloting efforts in region 2


4 BACKGROUND The M&V 2.0 Tool Kit What s new? Advanced Data Analytics Software: The growing range of cloud-based software and platforms that process large volumes of data quickly using publically available or proprietary algorithms. These solutions present opportunities for analyzing the increased data collected in order to inform utility programs and EM&V efforts. Improved Data Collection Tools and Increases in Data Availability Hardware: The use of smart meters and smart thermostats, nonintrusive load monitoring and other tools that both collect energy usage data in new ways and present opportunities to increase the amount and type of data collected. In some cases models fall on spectrum between public code and proprietary algorithms i.e., open methodologies See also NEEP s Changing EM&V Paradigm Report (Dec 2015) 3
5 BACKGROUND M&V 2.0 Applications Advanced Data Analytics and New Data Collection Tools M&V 2.0 Customer Segmentation and Targeting Virtual Energy Assessment (baseline data) Customer Engagement Monitor/tracking program performance and benchmarking M&V (to support claimed savings) Program Planning and Optimization. M&V 2.0 can apply to measure or whole building level our focus today is on whole building... 4
6 BACKGROUND - Definitions M&V 2.0: the use of more data (interval or volume), analytics, and computation at scale that can help to streamline the M&V process through semi/automation Use of (semi) automated software platforms (SaaS, private or public domain models) can support whole-building M&V at scale. Forum interest is to pilot/test software models and their accuracy in estimating savings relative to traditional M&V, and inform development of software standards that meet specific acceptance criteria EM&V 2.0: the integration of M&V 2.0 into program evaluation that evolves traditional EM&V in terms of: Evaluation preparedness i.e., real-time access to data and analysis during program implementation. Explore whether M&V 2.0 can support claimed savings, leveraging increasing volume and frequency of data to increase sample sizes, reduce on-site visits, and provide more granular results for evaluation. Forum interest is to test coordination and data sharing between software platforms and evaluators to help streamline evaluation process 5
7 POLL #1-2: Questions on clarify of definitions 6
8 Broad Categories of EM&V Approaches Approach Meter based? Net or Gross? Program/measure sweet spot Deemed values Not directly Gross, Net in some cases Engineering estimates, calculated Billing Analysis that can include comparison groups, randomized control trial, or quasi-experimental Calibrated simulation modeling (IPMVP Option D) Whole-building and retrofit isolation M&V (IPMVP Option C, B) Efficient equipment replacement/installation Not typically Gross, Net Custom industrial and large commercial; new construction Yes, with other data No (except the calibration) Yes, with other data Usually Net Gross, Net Gross Programs w large numbers: residential, behavioral, small savings/site Retrofit, large commercial Commercial, multi-measure, interactive effects, operational measures Our focus for today. 7


9 SPEAKERS Tim Guiterman EnergySavvy Director of EM&V Solutions Dan Zaweski PSEG Long Island Manager Planning & Evaluation Diane Duva Director, Bureau of Energy and Tech Policy CT Dept of Energy & Environ Protection Jake Oster EnergySavvy Sr. Director of Regulatory Affairs Jessica Granderson Lawrence Berkeley National Lab Staff Scientist 8
10 BACKGROUND Why the interest in EM&V 2.0? 1-2 year lag in impact evaluation results postprogram year is inefficient and costly As energy efficiency investments scale, EM&V needs to evolve to support growing industry Evolving integration of EE, DR and other distributed resources how can EM&V evolve to address impact of multiple DERs at whole building level How can we improve cost-effectiveness of EM&V (not necessarily lower the cost)? 9

11 Traditional Evaluation Timeline 10

12 EM&V 2.0: Continuous Measurement for Residential DSM Tim Guiterman Director of Quantify Solutions June 23, 2016
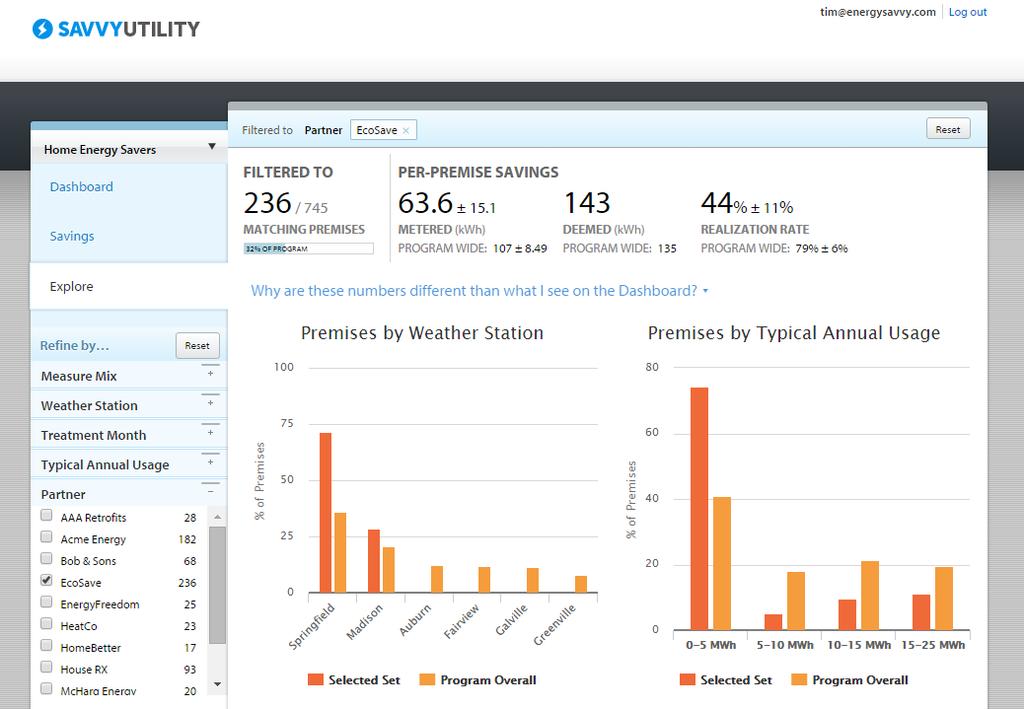
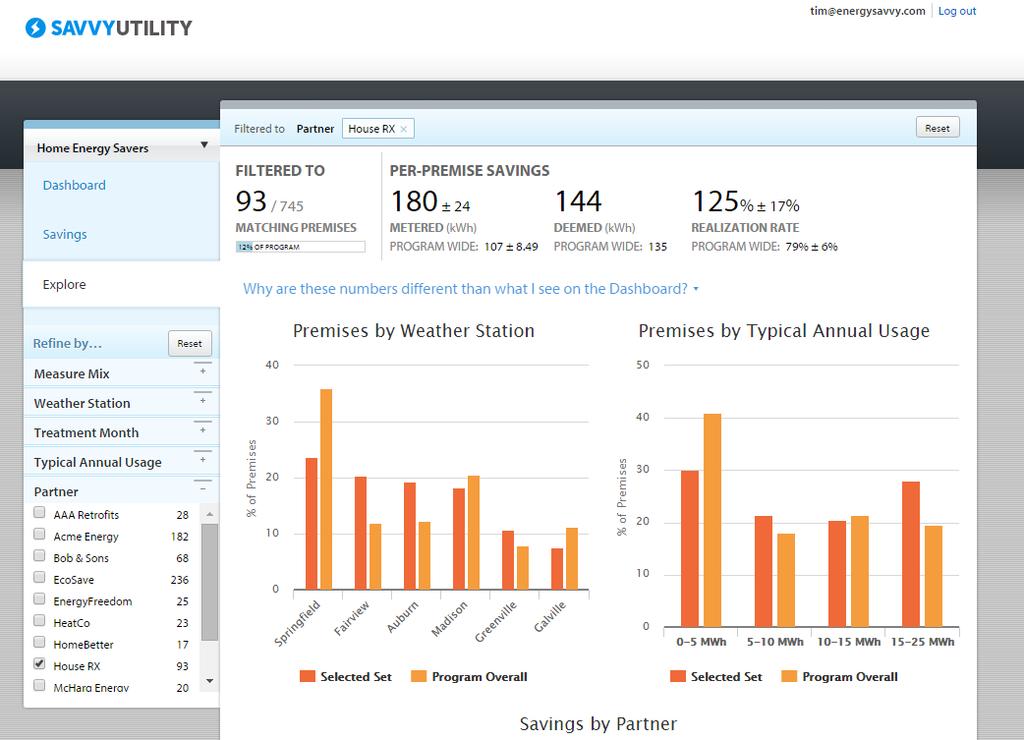
13 How Does Automated M&V Work? Build weathernormalized models for each customer Compare changes in usage for treated customers vs. overall population Repeat analysis for all customers with each new addition of data Generate dashboard of findings, analytics and actionable insights 12
14 What Does Automated M&V Look Like?
15 Continuous Measurement & Monitoring Feedback on program performance during implementation 14
16 15
17 16
18 17
19 18
20 Enhancing EM&V

21 Integrated Evaluation Support Supports targeted research and sampling Planning PY2 PY1 3 rd -Party EM&V on PY 1 PY2 PY3 Automated M&V Continuous program improvement 20
22 Enhancing EM&V An example of work in progress EnergySavvy and an EM&V firm are jointly evaluating a residential HVAC program Goal is to better understand how software can enhance and support the evaluation and add value to the PA, to the EM&V team and to the regulators Models EM&V firm is validating Quantify s model specifications, inputs, outputs, etc. Tuning Quantify to be the billing analysis of record Applying code baseline adjustments where applicable Reporting Quantify serves as a visual executive summary and an internal reporting tool Evaluation EM&V firm will perform surveys and additional research as needed (e.g., attribution) Feedback to programs The team will leverage the software to share findings and explore value of early feedback to program managers 21


23 TRM Updates and Calibration Collecting evidence to refine savings estimates Identify Savings at the Meter Measure Filter to Specific Measure 22
24 POLL #3: Question on role of EM&V in supporting evaluation 23
25 Faster Feedback Loop
 in real time Timeliness of data makes it actionable Projects completed Jan Mar: 44% of deemed savings achieved Program Change Projects completed Apr")
26 kwh Program Optimization What critical program insights can I discover in time to take action? Monitor 100% of premises (treated and untreated) in real time Timeliness of data makes it actionable Projects completed Jan Mar: 44% of deemed savings achieved Program Change Projects completed Apr Jun: 89% of deemed savings achieved Quick feedback loop means lots of chances to iterate JAN FEB MAR APR MAY JUN Metered Savings Average Savings per Home Deemed Savings 25
27 Actual Performance (Metered Savings/Expected Savings Contractor Performance Management Comparing savings at the meter to expected savings reveals good, bad and ugly. Can they do more? Can we transfer best practices? Low Volume, High Performance High Volume, High Performance Low Volume, Low Performance Sign them up for training High Volume, Low Performance Total Expected Savings Immediate correction necessary! LEGEND Contractor Manager action 26
28 Intelligent QA/QC Targeting Target in-home inspections and reduce QA/QC costs 27
29 Cooling Load Customer Segmentation Case Study: Identify future program candidates based on performance of others Savings per Premise by Typical Annual Usage Realization Rate by Cooling Load Savings per Premise by Weather Station Realization Rate Candidates for High Savings 28
30 POLL #4 Question on Feedback Loop 29
31 PSEG Long Island Pilot & Vision LONG ISLAND
32 POLL #5 Question on benefits of EM&V
33 Questions and FAQs Do you need AMI data for EnergySavvy s EM&V 2.0 tools? No this tool has been put to use with AMI, Monthly and Bi-Monthly data Will this approach only work for programs that expect savings above 10% per project? No with monthly data and enough projects, savings are detectable down to 2-3% per project. With AMI data it may be possible to go lower. Is this intended to replace formal evaluation? No this tool is intended to enhance and support evaluation while providing feedback information to PA s 32
34 Thank You Tim Guiterman Director of Quantify Solutions Jake Oster Sr. Director of Regulatory Affairs

35 Industry and R&D Needs: Defogging Key Issues in M&V2.0 Jessica Granderson Team: Samuel Fernandes, Samir Touzani Lawrence Berkeley National Laboratory David Jump KW Engineering
36 Outline Intro to M&V2.0 and webinar focus Who is doing what on the general topic What do we know about commercial M&V2.0, what is next, and where are we going? 35

, analytics,")


37 What is M&V2.0? Generally understood as: use of more data (interval or volume), analytics, computation at scale to streamline the M&V process through semi/automation Delivered in proprietary tools, open algorithms 36
38 What are the potential benefits of M&V2.0? Increase visibility, quickly obtain ongoing and interim results feedback Increase savings and enhance customer experience? Automate parts of the process that computers do well, streamline data acquisition and processing Reduce time and cost? Increase throughput, number of projects going through the pipeline? 37
39 What is the vision for where we might end up? New M&V2.0 methods can be objectively tested as industry continues to innovate and new data source become available Multiple real-world pilots are used to assess M&V 2.0 value proposition Cost, accuracy, time, tradeoffs vs. traditional M&V Value of continuous feedback in increasing savings as well as customer value and experience for both residential as well as commercial Processes/work flows are established to leverage automation while using engineering expertise where needed to maintain a quality result Analytical solutions to flag the non-routine adjustments are developed and tested for effectiveness Industry establishes acceptable levels of uncertainty and confidence, and documentation requirements for transparent evaluation 38
40 What is new about M&V2.0? What is not new? M&V2.0 tools are built upon savings estimation techniques that have been used for decades Comparison group analyses, IPMVP Options B&C, whole-building and submeter-based IPMVP Option D, calibrated simulation modeling What s new is: Degree of automation in data acquisition, and model creation Granularity and volume of data can improve quality of result Potential for continuous feedback Integration of M&V capability with other analyses for operational efficiency eg load visualization, portfolio tracking, end-use monitoring, etc. Software as a service offerings for owners, managers, program administrators 39
41 Two examples Customer engagement Program administrators Continuous savings feedback Net savings, comparison group billing analysis Residential Operational efficiency, SEM, MBCx Owners and operators Continuous savings feedback Gross savings, pre/post wholebuilding or submeter Option B or C Commercial 40

42 Screen shots of M&V2.0 capability Image Source: Lucid 41

43 Screen shots of M&V 2.0 capability Image Source: EnerNOC 42

44 Screen shots of M&V 2.0 capability Image Source: Universal Translator 3 43
45 A diversity of savings estimation approaches is used today Approach Meter based? Net or Gross? Program/measure sweet spot Deemed values Not directly Gross, Net in some cases Engineering estimates, calculated Billing Analysis that can include comparison groups, randomized control trial, or quasi-experimental Calibrated simulation modeling (IPMVP Option D) *Whole-building and retrofit isolation M&V (IPMVP Option C, B) Efficient equipment replacement/installation Not typically Gross, Net Custom industrial and large commercial; new construction Yes, with other data No (except the calibration) Yes, with other data Usually Net Gross, Net Gross Programs w large numbers: residential, behavioral, small savings/site Retrofit, large commercial Commercial, multi-measure, interactive effects, operational measures *This is the focus of this presentation 44
46 Where are meter-based approaches most appropriate? Predictable buildings Weather sensitive, regularly scheduled Projects with multiple and interactive measures Affecting several building systems (HVAC, lighting, etc.) Difficult to quantify measures Duct sealing, envelope upgrades, etc. Projects with larger savings, above the noise Measures using existing condition as baseline Retrocommissioning, behavioral, operational 45
47 Promising opportunities associated with meter-based M&V approaches Enabling delivery of whole-building programs that combine strategies for deep savings Enabling pay-for-performance programs Scalability and streamlining Reduce labor time and costs Maintain an accurate result Quickly obtain ongoing and interim results Increase throughput, number of projects 46
48 How are meter-based site savings quantified? Metering at whole-building (Option C), or submetered measure isolation level (Option B) In M&V2.0 tools baselines are automatically created with meter and weather data feeds User enters date of measure implementation, savings are calculated by the tool 47

49 Relevant California Activities CA AB802: CPUC to authorize programs using normalized meter-based energy savings (existing conditions baseline) for: To- and beyond-code savings, and retrocommissioning, operational, behavioral programs Counting savings towards goals when feasible and costeffective CPUC providing guidance on where existing use baselines are/not appropriate, EM&V plans 48
50 Other Relevant Activities RMI e - Lab Accelerator cross-stakeholder group group, more detailed articulation of M&V2.0, potential benefits, outstanding industry needs CEE Guidebook resource to understand uncertainty principles for whole-building M&V approaches, in context of whole-building program deign and delivery EVO has started an M&V2.0 group to determine how IMPVP will address the topic ASHRAE technical committees discussing standard methods of test 49
51 POLL # 6-7 Questions Are you involved in, or going to be involved in any programs that rely on an existing use baseline? Are you interested in exploring 2.0 tools and methods in your work? 5 0
52 Motivating Industry Questions, R&D Approach, and Highlights 5 1

53 Industry questions motivate LBNL s R&D Are these proprietary tools reliable? How can I verify their accuracy and compare them? Are proprietary tools any better or worse than standard regressions? Even if a tool is generally robust, how do I know that it will work for my specific projects or program? How big do my savings have to be to use these approaches? How do I know that a robust tool was applied to generate a quality result? 52
54 Four-step R&D approach to answer these questions 1. Population-level (many buildings) M&V2.0 testing to verify general, overall robustness, compare and contrast tools 2. Off-line demonstration of promising models with historic utility program data 3. Identification of reporting requirements and quantitative acceptance criteria for savings claims (in progress) 4. Larger pilots, demonstrations on live programs (future) Test Demonstrate Scale 53
 well within industry guidelines, errors even smaller when aggregating")
55 1. Population-level general testing and tool comparison Tested accuracy of baseline projections in proprietary tools and open standard models against data set from untreated buildings Given 12mo whole building interval data, predicted 12mo of energy use Within {-4, 5}% error for a full half of the buildings, CV(RMSE) well within industry guidelines, errors even smaller when aggregating buildings into portfolio No clear winner across 10 models No attempts to refine models based on expertise, knowledge of buildings, additional variables Floor of predictive accuracy Test procedure is published, was used by PG&E to prequalify tools for pilot, is available for use by others 54
56 2. Demonstrating 2.0 tools with historic program data Given tools that generally predict energy well, use them to automatically quantify savings Develop practitioner workflows to leverage automation while retaining accuracy of the savings result Many, but not all buildings are predictable Gross savings at the meter may not be gross savings due to the measure, i.e., non-routine adjustments may be needed Use uncertainty analysis to quantify accuracy of the savings results when applied to specific projects/buildings/programs 55
57 We draw from ASHRAE Guideline 14 Provides recommendations for accuracy in M&V Covers goodness of fit between the model and the baseline period data, with suggested thresholds for bias (NMBE) and CV(RMSE) Covers suggested formulae to quantify uncertainty due to error in the baseline model Suggests that fractional uncertainty be no more than 50% with at least 68% confidence (what will EE programs require?) 56
58 Model demonstration with historic program data Data from 51 buildings that underwent RCx and in some cases retrofits Preliminary workflow, drawing from ASHRAE Guideline 14 Auto fit the model to data from baseline period, and compute goodness of fit metrics Set aside buildings that do not meet suggested fitness thresholds - these will require further investigation For good buildings auto compute savings and uncertainty using M&V 2.0 tool Aggregate savings and uncertainties for each building to determine portfolio-level results 57


59 Findings from applying this workflow to historic program data Of the 51 buildings, 39 passed the goodness of fit tests using ASHRAE guidance Of the 12 that did not pass, 5 had incorrect documentation of measure implementation date; models can quickly be re-fit For this data set, 44 of 51 buildings look to be well-suited to automated analysis; 7 may require more manual investigation 58
60 Findings from uncertainty analysis with historic program data Savings uncertainty ranges for each of 39 buildings, at 95% confidence level 59
61 Summary of uncertainty findings in the demonstration on historic program data 32 of 39 individual buildings satisfied or exceeded ASHRAE uncertainty requirements At portfolio-level for the aggregate of the 39 buildings, at 95% confidence level Savings = 3.96% =/-.3, that is within confidence interval of [3.66%; 4.26%] Aggregate far exceeds ASHRAE guidance for sufficiency 60

62 Some comments on non-routine adjustments Gross metered savings may not reflect gross program/measure savings E.g. Occupancy or schedules may change or loads may be added/removed By definition, these Option-C compliant M&V2.0 baseline models do *not* handle NR Adj. It is possible that 2.0 analytics can flag cases where savings drop or increase unexpectedly, so that implementers can make timely inquiries 61 of the site

63 Some comments on uncertainty, confidence, and documentation requirements General tool testing can tell us that we have good well-made hammers If we have well-made hammers, uncertainty and confidence can verify that we ve driven our nails straight and true But how straight do we need to be? An how do we prove it to 3 rd parties? What documentation will we need? 80-20? 90-10? And how do we set these values? 62
64 Some comments on net, gross, other baselines and methods Even with deemed savings you commonly need to layer additional analysis to determine a net Existing conditions baselines are critical to less common programs that Promise deep savings, offer opportunity beyond equipment-based measures Focus on operational, retro-commissioning, behavioral, multimeasure, whole-building Calibrated simulation can be complex, costly and difficult to scale Comparison groups may not always be possible to establish for commercial buildings 63
65 POLL #8: Is there value in both population-level testing for tool comparison, and assessment of tool accuracy for specific buildings/projects or programs 6 4
66 Where Have We Gotten and Where are We Going? 6 5
67 Where have we gotten? Appreciation of the potential benefits of M&V2.0 Replicable test procedures to assess overall robustness of M&V 2.0 tools for commercial buildings Many models predict within a few percent for many buildings using commonly available data Use by large utility to pre-vet vendors for pilot, published for ongoing use Initial exploration (ongoing beyond the 51 projects shown here) High confidence and low uncertainty when applying M&V2.0 tools Start on defining practitioner workflows to retain a quality result Indication that with interval data savings may not have to be as big as 10% to see at the whole-building level 66
68 Returning to the the vision for where we might end up New M&V2.0 methods can be objectively tested as industry continues to innovate and new data source become available Multiple real-world pilots are used to assess M&V 2.0 value proposition Cost, accuracy, time, tradeoffs vs. traditional M&V Value of continuous feedback in increasing savings as well as customer value and experience for both residential as well as commercial Processes/work flows are established to leverage automation while using engineering expertise where needed to maintain a quality result Analytical solutions to flag the non-routine adjustments are developed and tested for effectiveness Industry establishes acceptable levels of uncertainty and confidence, and documentation requirements for transparent evaluation 67
69 What do we still need to know or do? Demonstrate 2.0 tools on more historic program data (ongoing) What do we do for buildings that don t have a good fit, and aren t well suited to the meter-based approach? How can we leverage targeting and pre-screening How does M&V2.0 compare to traditional approaches, in the field? Can we conduct a sufficient number of pilots and what proof points should they be designed to produce? How do we handle non-routine adjustments? What uncertainty, confidence, and documentation requirements are needed for evaluation? What group might serve as a testing body for new M&V2.0 tools to verify their general robustness? 68
70 POLL #9-10 Questions on Piloting M&V
71 POLL #11 Efforts are underway to test tools, including uncertainty analysis, for the acceptance of M&V 2.0 tools and methods. Are you interested in working on topics of tool testing and acceptance criteria? 7 0
72 Questions and Discussion 7 1
73 Thank You! For more information please contact Jessica Granderson For more detailed reports and presentations: eis.lbl.gov 7 2
The Role of Real Time EM&V in Overcoming Barriers JESSICA GRANDERSON, SOPHIA FRANCOIS, JAMIE PETERS, BRIAN MCCOWAN
 The Role of Real Time EM&V in Overcoming Barriers JESSICA GRANDERSON, SOPHIA FRANCOIS, JAMIE PETERS, BRIAN MCCOWAN The Role of Real-Time EM&V in Overcoming Barriers Jessica Granderson, Lawrence Berkeley
M&V 2.0 Experience, Opportunities, and Challenges. Wednesday, March 30 th 11:30am 12:30pm
 M&V 2.0 Experience, Opportunities, and Challenges Wednesday, March 30 th 11:30am 12:30pm Changing EM&V Paradigm - Landscape of New Tools & Data Analytics A Review of Key Trends and New Industry Developments,
M&V 2.0: A User s Guide
 M&V 2.0: A User s Guide West Coast Energy Management Congress June 8, 2017 David Jump, Ph.D., P.E. kw Engineering djump@kw-engineering.com 1 Agenda What is M&V 2.0? Process Steps & Tools Non-Routine Events
Overview of Key Trends in, and Applications of, Technology in Measurement and Verification
 VA EEAC Overview of Key Trends in, and Applications of, Technology in Measurement and Verification Wednesday, October 13, 2016 February 24, 2016 Tim Pettit Ungraded 1 2014 SAFER, SMARTER, GREENER Summary
Building More Knowledge About Whole Building EM&V
 Building More Knowledge About Whole Building EM&V Tim Guiterman, EnergySavvy Sarah Zaleski, US Department of Energy Ethan Goldman, Vermont Energy Investment Corporation Diane Duva, CT Department of Energy
Leveraging Smart Meter Data & Expanding Services BY ELLEN FRANCONI, PH.D., BEMP, MEMBER ASHRAE; DAVID JUMP, PH.D., P.E.
 ASHRAE www.ashrae.org. Used with permission from ASHRAE Journal. This article may not be copied nor distributed in either paper or digital form without ASHRAE s permission. For more information about ASHRAE,
Residential M&V Panel: Real Time M&V Where are we, where could we go, what would it take?
 Residential M&V Panel: Real Time M&V Where are we, where could we go, what would it take? Miriam L Goldberg & Michelle Marean ACEEE Intelligent Efficiency Conference Boston Dec 8, 2015 1 SAFER, SMARTER,
SCE HOPPs Overview. Stakeholder Webinar, 7/14/16
 SCE HOPPs Overview Stakeholder Webinar, 7/14/16 Ideas Search at a Glance SCE Effort Jan: HOPPs kick-off Feb.-Apr: Outreach for ideas Apr: Narrowing of ideas May-June: Prelim. drafts of applications June-July:
Knowing is half the battle: How emerging energy information systems can drive and verify savings
 Data Driven Approaches To Optimizing Building Energy Performance Knowing is half the battle: How emerging energy information systems can drive and verify savings Jessica Granderson Lawrence Berkeley National
Test of Several Whole-Building Baseline Models
 Test of Several Whole-Building Baseline Models Phillip Price Jessica Granderson Lawrence Berkeley National Laboratory September 2012 1 Preliminary Baseline Evaluation Study Premise: statistical performance
M&V 2.0: Hype vs. Reality
 M&V 2.0: Hype vs. Reality Jason Kupser, Sophia Francois, DTE Energy Joshua Rego, Peter Steele-Mosey, Toben Galvin, Craig McDonald, Navigant ABSTRACT The rollout of advanced metering infrastructure has
AHUP Redesign. Leif Magnuson, PG&E Build it Green Staff
 AHUP Redesign Leif Magnuson, PG&E Build it Green Staff Meeting Agenda Topics 2016-2017 AHUP Results Role of Home Retrofits in Meeting State Goals Proposed Program Redesign and Discussion High Performance
Pay for Performance Primer 10/12/18
 Pay for Performance Primer 10/12/18 Welcome to our 1st Pay for Performance Webinar Elizabeth Titus Director of Research and Evaluation, NEEP 2 Agenda What is Pay for Performance (P4P)? (12 mins) Megan
Supplemental Data for California Smart Thermostat Work Paper
 Supplemental Data for California Smart Thermostat Work Paper Large scale analysis of the efficiency of Nest customer thermostat set point schedules with projected heating and cooling savings compared to
Comprehensive Multifamily Building Solution
 Comprehensive Multifamily Building Solution 2016 HOPP Stakeholder Webinar 5/5/2016 1 5/5/2016 SoCalGas Multifamily Sector State Wide Number of Existing Buildings: 3,126,000 (23 percent of residential buildings)
Putting Your Money Where Your Meter Is
 Putting Your Money Where Your Meter Is A Study of Pay for Performance Energy Efficiency Programs in the U.S. Julia Szinai MT Symposium, April 3, 2017 Agenda Taxonomy of P4P program features Lessons learned
ActOnEnergy-Metering & Monitoring Incentive Program
 ActOnEnergy-Metering & Monitoring Incentive Program David Gibson-Power TakeOff Training Webinar 05.12.15 Agenda What are we trying to achieve? Energy Monitoring and Metering Trends ActOnEnergy Metering/Monitoring
ASSESSMENT OF THE WHOLE BUILDING SAVINGS VERIFICATION APPROACH IN THE UNIVERSITY OF CALIFORNIA MONITORING-BASED COMMISSIONING PROGRAM
 ASSESSMENT OF THE WHOLE BUILDING SAVINGS VERIFICATION APPROACH IN THE UNIVERSITY OF CALIFORNIA MONITORING-BASED COMMISSIONING PROGRAM Submitted to: Dave Hather Program Manager, Expert PG&E Customer Energy
A Selection Guide for Resource Conservation Managers
 Our Mission To advance environmental and economic well-being by providing unmatched energy services, products, education and information based on world-class research. About Us Our staff of energy engineers,
Opportunities for Home Energy Management Systems (HEMS) in Advancing Residential Energy Efficiency Programs
 in Advancing Residential Energy Efficiency Programs") Opportunities for Home Energy Management Systems (HEMS) in Advancing Residential Energy Efficiency Programs August 2015 Executive Summary Home Energy Management Systems (HEMS) are an invention of the internet
Opportunities for Home Energy Management Systems (HEMS) in Advancing Residential Energy Efficiency Programs August 2015 Executive Summary Home Energy Management Systems (HEMS) are an invention of the internet
D DAVID PUBLISHING. Optimizing Thermal Energy Storage Systems in the Hospitality Industry. 1. Introduction
 Journal of Energy and Power Engineering 8 (2014) 1991-2000 D DAVID PUBLISHING Optimizing Thermal Energy Storage Systems in the Hospitality Industry Patrick Wilkinson, Jesse Oshiro, Dean Perry and Helen
Smart Thermostats P G & E, S C E, S C G, S D G & E M AY,
 P G & E, S C E, S C G, S D G & E M AY, 2 0 1 5 Presentation Overview Objective: Seeking TF feedback on data analysis approach to estimate EE savings opportunity Measure Description IOU Data Overview IOU
OUR EXPERIENCE WITH RCX SOFTWARE: TRIUMPHS AND CHALLENGES
 OUR EXPERIENCE WITH RCX SOFTWARE: TRIUMPHS AND CHALLENGES By Celeste L. Cizik, PE, CEM, PMP, LEED-AP Group14 Engineering, PBC. ABSTRACT With the ever increasing complexity in commercial building HVAC and
Auto M&V Industry Brief: How Fast is the EM&V Paradigm Changing?
 Auto M&V Industry Brief: How Fast is the EM&V Paradigm Changing? December 2016 Table of Contents Acknowledgements / About NEEP... iii Introduction...1 Background...1 Objectives...1 Industry Overview and
March Combining Utility Customer Analytics with Smart Implementation
 March 2017 Combining Utility Customer Analytics with Smart Implementation EXECUTIVE SUMMARY Combining Utility Customer Analytics with Smart Implementation to Dramatically Improve Utility Program Metrics
Methodologies for Determining Persistence of Commissioning Benefits
 Methodologies for Determining Persistence of Commissioning Benefits David E. Claridge Energy Systems Laboratory Texas A&M University System College Station, TX Abstract: Studies on the persistence of commissioning
Every building needs an Energy Efficiency Platform.
 Every building needs an Energy Efficiency Platform. Persistent commissioning Rule-based controls Advanced analytics Cut energy costs Reduced downtime Optimize energy usage Other Systems Monitor Manage
Practical Experiences in Applying Savings M&V
 Practical Experiences in Applying Savings M&V By Pierre Baillargeon P.Eng. Vice President, Econoler International, Canada Certified Measuvement & Verification professional (CMVP) September 25, 2006 Program
ManagingEnergy.com. Overview of ASHRAE Guideline (American Society of Heating, Refrigerating and Air-Conditioning Engineers)
") ManagingEnergy.com Overview of ASHRAE Guideline 14-2002 (American Society of Heating, Refrigerating and Air-Conditioning Engineers) Measurement of Energy and Demand Savings Measuring Energy Savings To
ManagingEnergy.com Overview of ASHRAE Guideline 14-2002 (American Society of Heating, Refrigerating and Air-Conditioning Engineers) Measurement of Energy and Demand Savings Measuring Energy Savings To
Sensor Suitcase: A Turnkey Technology to Enable Small Buildings Retro-Commissioning
 Sensor Suitcase: A Turnkey Technology to Enable Small Buildings Retro-Commissioning California Commissioning Collaborative, Dec 11, 2014 Guanjing Lin, Jessica Granderson Lawrence Berkeley National Laboratory
REGULATORY SPOTLIGHT
 REGULATORY SPOTLIGHT Estimating Energy Savings From Resource Acquisition and Market Transformation Programs Prepared for ComEd Prepared by Navigant Consulting, Inc. Beth Davis Jan Harris Dan Violette Designed
Clinical Telepharmacy
 Clinical Telepharmacy Proven Solutions to Drive Pharmacy Value Extend your Pharmacy s impact on the health of your organization and the population you serve with advanced technology solutions and best
Energy Information Systems: A Utility Perspective
 17 March 2010 Energy Information Systems: A Utility Perspective Pacific Gas and Electric Company 17 March 2010 2 What is the utility perspective? 1) Secure cost-effective and robustly verifiable energy
M&V Applications and Approaches Balancing Project Demands to Deliver an Accurate, Cost Effective, and Verifiable M&V Outcome
 M&V Applications and Approaches Balancing Project Demands to Deliver an Accurate, Cost Effective, and Verifiable M&V Outcome Doug Chamberlin, P.E., LEED AP; Director of Northwest Region Mark Goldberg;
Utility Bill Data Accounts Payable s Secret Weapon for Managing Costs and Addressing Stakeholder Questions
 EBook Utility Bill Data Accounts Payable s Secret Weapon for Managing Costs and Addressing Stakeholder Questions Part 1 Situation Analysis Utility costs often rank in the top three operational expenses
Behavior-Based Energy Efficiency Programs
 1 Showcase July 17, 2013 Behavior-Based Energy Programs Presenters: Summer Goodwin Bonneville Power Administration Laura McCrae Snohomish County PUD Matthew Babbitts Clark Public Utilities Joel Smith Puget
M&V Fundamentals & the International Performance Measurement and Verification Protocol
 M&V Fundamentals & the International Performance Measurement and Verification Protocol What is M&V? Measurement & Verification (M&V) is the process of using measurements to reliably determine actual saving
Improving the efficiency, occupant comfort, and financial well-being of campus buildings
 GHAUSI HALL ENERGY PROJECT REPORT Improving the efficiency, occupant comfort, and financial well-being of campus buildings ACE TEAM, ENERGY CONSERVATION OFFICE UC DAVIS FACILITIES MANAGEMENT Executive
Itron Analytics. Maximize the Full Value of Your Smart Grid. Image
 Itron Analytics Maximize the Full Value of Your Smart Grid Image Complete Data Intelligence Lifecycle The ultimate goal of the smart grid is to ensure safe and reliable delivery of energy. Building your
The Front Lines of Industrial Energy Management
 The Front Lines of Industrial Energy Management Presented by: Marcus Wilcox, President, P.E. Introduction to Cascade Energy Offices in Oregon, Utah, and Washington Staff of 50 (incl. 35 Engineers) Industrial
The Energy and Sustainability Advantage:
 EBook The Energy and Sustainability Advantage: A Guide to Identifying Savings, Measuring Consumption and Driving Long-Term Impact Industry leaders are quickly learning how important smart energy management
Managing Energy Use and Cost with Integrated Metering
 Managing Energy Use and Cost with Integrated Metering Regional Municipality of Durham October 29, 2015 Joe Green P.Eng, CEM Overview Duffin Creek WPCP Jointly owned by York and Durham Regions Capacity
Incentives. After work is complete:
 SAVE your WAY Create your own Energy Demand Savings with OUC s Commercial & Industrial Custom Incentive Program Overview OUC is committed to helping your business become more energy efficient. We understand
Summary Paper on Controls for Metering and Feedback
 Summary Paper on Controls for Metering and Feedback Measured performance for commercial buildings, the actual collection of data and use in benchmarking and efficiency assessments, is making significant
Measurement & Verification for Performance Contracts Through Rebuild Colorado. January Rebuild Colorado
 Measurement & Verification for Performance Contracts Through Rebuild Colorado January 2005 Rebuild Colorado A Program of the Governor's Office of Energy Management and Conservation 225 East 16th Avenue
Automating the Measurement & Verification of Energy Efficiency
 CASE STUDY Automating the Measurement & Verification of Energy Efficiency Summary Energy efficiency is a fast-growing priority for building owners in the Pacific Northwest, set against a backdrop of rising
MA EEAC. Consultant Team. Items for Council Consideration. Evaluation, Measurement & Verification. Eric Belliveau and the EEAC Consultant Team
 To From EEAC Date 8 May 2014 Subject Eric Belliveau and the EEAC April Monthly Report The is pleased to provide this update to the Council on our recent activities. Items for Council Consideration Aside
Summary of 60-Day Notice: Smart Thermostat Optimization
 Summary of 60-Day Notice: Smart Thermostat Optimization Public Service Company of Colorado ( Public Service or the Company ) posts this 60- Day Notice to add a Smart Thermostat Optimization Pilot to the
DATA AND THE ELECTRICITY GRID A ROADMAP FOR USING SYSTEM DATA TO BUILD A PLUG & PLAY GRID
 0000 DATA AND THE ELECTRICITY GRID A ROADMAP FOR USING SYSTEM DATA TO BUILD A PLUG & PLAY GRID DATA AND THE ELECTRICITY GRID: A ROADMAP FOR USING SYSTEM DATA TO BUILD A PLUG & PLAY GRID ARAM SHUMAVON,
Energy Efficiency Impact Study
 Energy Efficiency Impact Study for the Preferred Resources Pilot February, 2016 For further information, contact PreferredResources@sce.com 2 1. Executive Summary Southern California Edison (SCE) is interested
Utilising Lean to improve Defect & Inspection Management. 17-Apr-2018
 Utilising Lean to improve Defect & Inspection Management 17-Apr-2018 CONSTRUCTION TASK FORCE Synopsis Step 1: Systematic elimination of waste. Step 2: Collection & Analysis of data to drive Continuous
Evaluation, Measurement & Verification Essentials
 Evaluation, Measurement & Verification Essentials A Training and Capacity- building Exercise for the Local Govt. EE Community in conjunc(on with the LG Stakeholder Advisory Group October 27, 2015 Dr. Katherine
Low-Cost, Monitoring-Based Commissioning for Small- to Mid-Sized Commercial Buildings
 Low-Cost, Monitoring-Based Commissioning for Small- to Mid-Sized Commercial Buildings Patrick O Neill, Ph.D. CEO NorthWrite, Inc. Tim Kensok VP Market Development AirAdvice, Inc. AIA Quality Assurance
Agenda October 20 th Meeting
 Agenda October 20 th Meeting Goals & Objective of the Audit Plan Evaluation & Audit Operational Overview EDC Program Review TRM Review Issues Technical Review Committee Impact Evaluation Process Architecture
NSPM Rate Design Pilot
 NSPM Rate Design Pilot Stakeholder Meeting May 5, 2017 Agenda and Purpose Agenda Introduction of MN Pilot Development A. Liberkowski Concept and Goals Pilot Development Timeline MN Time of Use Rate Option
TBM Awards Nomination Questionnaire
 Successful IT finance teams are more than just accountants. They fulfill several roles for helping the business get more value from technology spending and investments. As defined in the TBM Council s
Review of PG&E Home Energy Reports Initiative Evaluation. CPUC Energy Division Prepared by DNV KEMA, Inc
 Review of PG&E Home Energy Reports Initiative Evaluation CPUC Energy Division Prepared by DNV KEMA, Inc. 5-31-2013 Table of Contents DNV KEMA Energy & Sustainability 1. Introduction... 1-1 2. Background...
Smart Thermostats: Paving the Way for Smart EM&V
 Smart Thermostats: Paving the Way for Smart EM&V Claire Miziolek, NEEP Joe Loper, Itron Abigail Daiken, US Environmental Protection Agency Richard Counihan, Nest Labs Nkechi Ogbue, ecobee Setting the Scene
MONITORING, TARGETING AND REPORTING (MT&R) FUNDAMENTALS AND APPLICATIONS IN THE COP PROGRAM. Robert Greenwald, P.Eng., MBA Prism Engineering g Ltd.
 FUNDAMENTALS AND APPLICATIONS IN THE COP PROGRAM. Robert Greenwald, P.Eng., MBA Prism Engineering g Ltd.") MONITORING, TARGETING AND REPORTING (MT&R) FUNDAMENTALS AND APPLICATIONS IN THE COP PROGRAM Robert Greenwald, P.Eng., MBA Prism Engineering g Ltd. WHAT DOES MT&R MEAN? MONITORING The regular collection
MONITORING, TARGETING AND REPORTING (MT&R) FUNDAMENTALS AND APPLICATIONS IN THE COP PROGRAM Robert Greenwald, P.Eng., MBA Prism Engineering g Ltd. WHAT DOES MT&R MEAN? MONITORING The regular collection
Continuous Optimization Program: Round 2 Program Offers
 Continuous Optimization Program: Round 2 Program Offers The Continuous Optimization (C.Op) Program captures savings related to improved operations in large commercial buildings, primarily focused on optimizing
Does SEM Achieve Verifiable Savings? A Summary of Evaluation Results
 Does SEM Achieve Verifiable Savings? A Summary of Evaluation Results ABSTRACT Heidi Ochsner, Cadmus Tolga Tutar, Cadmus Erika Kociolek, Energy Trust of Oregon Steve Phoutrides, Northwest Energy Efficiency
PECI s RCx Programs: The Next Generation. Michelle Lichtenfels Program Manager PECI
 PECI s RCx Programs: The Next Generation Michelle Lichtenfels Program Manager PECI AIA Quality Assurance Learning Objectives 1. Understand the background and history of PECI s 2006-2009 California RCx
Retro-commissioning and on-going commissioning 23 November 2016
 Retro-commissioning and on-going commissioning 23 November 2016 1 CONTENTS 1. Needs for Retro-Commissioning (RCx) 2. Retro-Commissioning (RCx) Definition and Scope 3. Briefing of RCx Process 4. Alternative
Evaluation-Ready A practical approach for no savings left on the table. Lorene Flaming, PECI Keith Forsman, PG&E
 Evaluation-Ready A practical approach for no savings left on the table Lorene Flaming, PECI Keith Forsman, PG&E October 16, 2012 Introduction Genesis of the Statewide Commercial HVAC Quality Maintenance
Arkansas Utility Baseline. Julio Rovi Kudret Utebay Shubhada Kambli
 Arkansas Utility Baseline Julio Rovi Kudret Utebay Shubhada Kambli Agency Kick-off Meeting: December 14, 2010 AGENDA Project overview Introductions Cadmus team and expertise ENERGY STAR and benchmarking
M&V Guidelines for Colorado PC projects. You cannot manage what you do not measure
 M&V Guidelines for Colorado PC projects You cannot manage what you do not measure Rebuild Colorado Focus on performance contracting in state and local governments Rebuild Colorado Team Governor s Office
GUIDEBOOK ADAPTIVE INSIGHTS
 GUIDEBOOK ADAPTIVE INSIGHTS December 2013 July 2013 Document NX THE BOTTOM LINE Although corporate performance management (CPM) solutions have been in the market for some time, a new set of vendors such
What s your kw? Defining peak demand in Texas
 What s your kw? Defining peak demand in Texas Lark Lee, Tetra Tech, lead for statewide EM&V effort in Texas Amy Martin, Frontier Associates, contractor lead for Electric Utility Marketing Managers of Texas
Trusted KYC Data Sharing Framework Implementation
 July 2017 Trusted KYC Data Sharing Framework Implementation Supporting Document Contents Preface... 3 1 Objective of this Document... 4 2 Evolving Benefits Provided by the Data Sharing Environment... 5
INDEPENDENT TECHNICAL REVIEW OF THREE REPORTS RELATED TO COMMERCIAL BUILDINGS EMIS BASELINING SOFTWARE FUNCTION TESTING METRICS AND PROTOCOL
 INDEPENDENT TECHNICAL REVIEW OF THREE REPORTS RELATED TO COMMERCIAL BUILDINGS EMIS BASELINING SOFTWARE FUNCTION TESTING METRICS AND PROTOCOL ET Project Number: ET 12PGE5312 Project Manager: Leo Carrillo
Analytics in Commercial Buildings: Second-year Outcomes on Costs, Savings and Industry Trends from the Smart Energy Analytics Campaign
 Analytics in Commercial Buildings: Second-year Outcomes on Costs, Savings and Industry Trends from the Smart Energy Analytics Campaign Hannah Kramer, P.E. Lawrence Berkeley National Laboratory October
The Right KPIs, Metrics for High-performing, Cost-saving Space Management. An Approach and Case Study
 The Right KPIs, Metrics for High-performing, Cost-saving Space Management An Approach and Case Study Speakers Mayu Roy Managing Director, Strategic Consulting, Computerized Facilities Integration, LLC
Smart Manufacturing in the Semiconductor Industry - Realizing the Digital Factory Vision
 Smart Manufacturing in the Semiconductor Industry - Realizing the Digital Factory Vision David Shen, Executive Director, Electronics & Semiconductor Restricted Siemens AG 2017 Realize innovation. Semiconductor
Requirements Analysis and Design Definition. Chapter Study Group Learning Materials
 Requirements Analysis and Design Definition Chapter Study Group Learning Materials 2015, International Institute of Business Analysis (IIBA ). Permission is granted to IIBA Chapters to use and modify this
Southwest Texas Junior College
 Southwest Texas Junior College Year 1 Savings Report January 13, 2015 Schneider Electric Buildings Americas, Inc. 1650 West Crosby Road Carrollton, TX 75006 www.schneider-electric.com/buildings 1. 0 E
Guide to Modernize Your Enterprise Data Warehouse How to Migrate to a Hadoop-based Big Data Lake
 White Paper Guide to Modernize Your Enterprise Data Warehouse How to Migrate to a Hadoop-based Big Data Lake Motivation for Modernization It is now a well-documented realization among Fortune 500 companies
AN INTRODUCTION TO WEATHER NORMALIZATION OF UTILITY BILLS FOR ALTERNATIVE ENERGY CONTRACTORS. John Avina, Director Abraxas Energy Consulting
 AN INTRODUCTION TO WEATHER NORMALIZATION OF UTILITY BILLS FOR ALTERNATIVE ENERGY CONTRACTORS John Avina, Director Abraxas Energy Consulting UTILITY BILL TRACKING: THE REPORT CARD FOR ALTERNATIVE ENERGY
Is More Always Better? A Comparison of Billing Regression Results Using Monthly, Daily and Hourly AMI Data
 Is More Always Better? A Comparison of Billing Regression Results Using Monthly, Daily and Hourly AMI Data John Cornwell, Evergreen Economics, Portland, OR Stephen Grover, Evergreen Economics, Portland,
Reduce your properties energy consumption, keep tenants and residents comfortable, and
 YARDI Smart Energy Suite Reduce your properties energy consumption, keep tenants and residents comfortable, and simplify analysis and reporting with automated energy management solutions. YARDI Smart Energy
IT Optimization Award
 IT leaders are asked to build the plane while flying it and promise a smooth ride. From modernization and standardization to rationalizing and aligning application, vendor and project portfolios, IT must
SCE Comments on DEER2016 Update Scope
 SCE Comments on DEER2016 Update Scope Submitted February 27, 2015 Below, please find a combination of proposed requests, queries, and technical feedback by Southern California Edison (SCE) pertaining to
Solara: A Case Study in Zero Net Energy Design for Affordable Housing
 Solara: A Case Study in Zero Net Energy Design for Affordable Housing Design, Construction, and Operational Lessons Learned from a California Energy Commission Zero Energy New Homes Project Jim Meacham,
Non-Intrusive Load Monitoring (Nilms) Research Activity End-Use Energy Efficiency & Demand Response
 Research Activity End-Use Energy Efficiency & Demand Response") Non-Intrusive Load Monitoring (Nilms) Research Activity End-Use Energy Efficiency & Demand Response Chris Holmes Principle Technical Leader EE&DR Analytics (EPRI) AEIC Load Research Analytics Workshop
Non-Intrusive Load Monitoring (Nilms) Research Activity End-Use Energy Efficiency & Demand Response Chris Holmes Principle Technical Leader EE&DR Analytics (EPRI) AEIC Load Research Analytics Workshop
PROVING THE SAVINGS: MEASUREMENT & VERIFICATION
 METERING BILLING CRM/CIS CONFERENCE 2005 Le Meridien at Rialto, Melbourne Australia 16 March 2005 PROVING THE SAVINGS: MEASUREMENT & VERIFICATION Presented by Fred Nicolosi Copyright 2004 Energy Decisions
Itron Analytics Maximize the Value of Your Smart Grid
 Itron Analytics Maximize the Value of Your Smart Grid Act Measure Predict Closed-Loop Analytics Store Analyze Complete Data Intelligence Lifecycle The ultimate goal of the smart grid is to ensure safe
Focus on Energy Calendar Year 2014 Evaluation Report Volume II May 27, 2015
 Focus on Energy Calendar Year 2014 Evaluation Report Volume II May 27, 2015 Public Service Commission of Wisconsin 610 North Whitney Way P.O. Box 7854 Madison, WI 53707-7854 This page left blank. Prepared
AMI Billing Regression Study Final Report. February 23, 2016
 AMI Billing Regression Study Final Report February 23, 2016 Table of Contents Executive Summary... i 1 Introduction... 1 2 Random Coefficients Model... 5 2.1 RANDOM COEFFICIENTS MODEL DEVELOPMENT PROCESS...
INTRODUCTION TO MODERN RANDOMIZATION AND TRIAL SUPPLY MANAGEMENT SERVICES
 WHITE PAPER INTRODUCTION TO MODERN RANDOMIZATION AND TRIAL SUPPLY MANAGEMENT SERVICES Randomization is fundamental to clinical trials it enables treatment group balance, eliminates selection bias and limits
Workforce Dimensions
 Workforce Dimensions Built from the ground up to manage the workforce of the future today Welcome to the Future of Workforce Management Breakthroughs in technology affect nearly every dimension of our
Case Study for Fortune 500 Telecom: Retrofitting Pneumatic Controls for Energy Efficiency
 Case Study for Fortune 500 Telecom: Retrofitting Pneumatic Controls for Energy Efficiency Summary Major Fortune 500 Telecom Company Estimated 40% the corporate building portfolio still use pneumatic thermostats
The Behavioral Layer Cake How Layering Peak Day Messaging Increases the Value of Behavioral Energy Efficiency
 The Behavioral Layer Cake How Layering Peak Day Messaging Increases the Value of Behavioral Energy Efficiency September 25, 2015 Next Generation DSM We pioneered behavioral energy efficiency and lead the
Home Energy Score Getting Started Packet: Important information for Partners and interested Assessor Candidates
 Home Energy Score Getting Started Packet: Important information for Partners and interested Assessor Candidates Version: April 28, 2015 1 eere.energy.gov Getting Started This presentation covers the following
COCIR CT Manufacturers Voluntary Commitment Regarding CT Dose 2014 Annual Report
 Preamble COCIR CT Manufacturers Voluntary Commitment Regarding CT Dose 2014 Annual Report This 2 nd Annual Report defines the COCIR CT manufacturers voluntary commitment to HERCA as a result of the meeting
Increase Value and Reduce Total Cost of Ownership and Complexity with Oracle PaaS
 Increase Value and Reduce Total Cost of Ownership and Complexity with Oracle PaaS Oracle PaaS Reduces Operating Costs and Drives Value Creation O R A C L E W H I T E P A P E R 2 0 1 7 Executive Summary
A buyer s guide to data-driven HR. Which approach is best for you?
 A buyer s guide to data-driven HR Which approach is best for you? You know where you want to go. Now pick your route. Smart organizations know that they need to use their HR data to do big, important things.
Multifamily Energy Efficiency Initiative Developing Next Practice Energy Efficiency Options
 Multifamily Energy Efficiency Initiative Developing Next Practice Energy Efficiency Options Initiative Work Plan October 2012 Introduction The carbon emissions associated with electricity generation and
Time to Move On: An Examination of Metering Periods for Small Business Direct Install Participants
 Time to Move On: An Examination of Metering Periods for Small Business Direct Install Participants Julian Ricardo, NMR Group, Inc. Joseph Dolengo, National Grid David Barclay, NMR Group, Inc Scott Walker,
Cost Management in the AWS Cloud. March 2018
 Cost Management in the AWS Cloud March 2018 2018, Amazon Web Services, Inc. or its affiliates. All rights reserved. Notices This document is provided for informational purposes only. It represents AWS
The presentation will begin shortly. Audio will be streamed directly via your computer speakers. Enjoy the webcast!
 The presentation will begin shortly. Audio will be streamed directly via your computer speakers. Enjoy the webcast! Leveraging Data for Maximum Spend Visibility A Solution Series Webinar Jeanne Dion Value
Second Quarter 2013 Performance
 Second Quarter 2013 Performance Presentation to the EEAC by the PAs August 22, 2013 Quantitative Review Second Quarter Statewide Overview Electric and gas annual savings are at 25% and 26% of goal, respectively