Zensar reports 3.8% sequential quarter revenue growth in Q2 FY 18 Digital services continue to grow and are at 36.8% of revenue
|
|
|
- Alexandrina Gaines
- 6 years ago
- Views:
Transcription
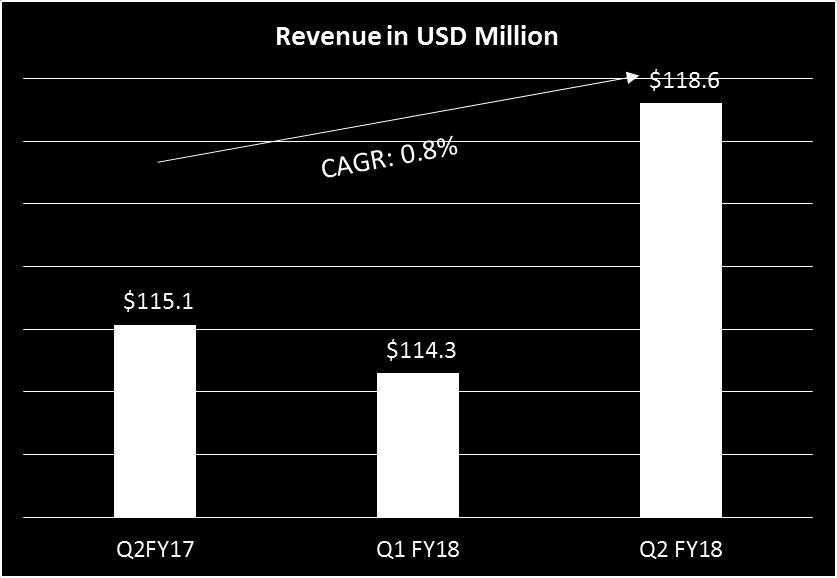
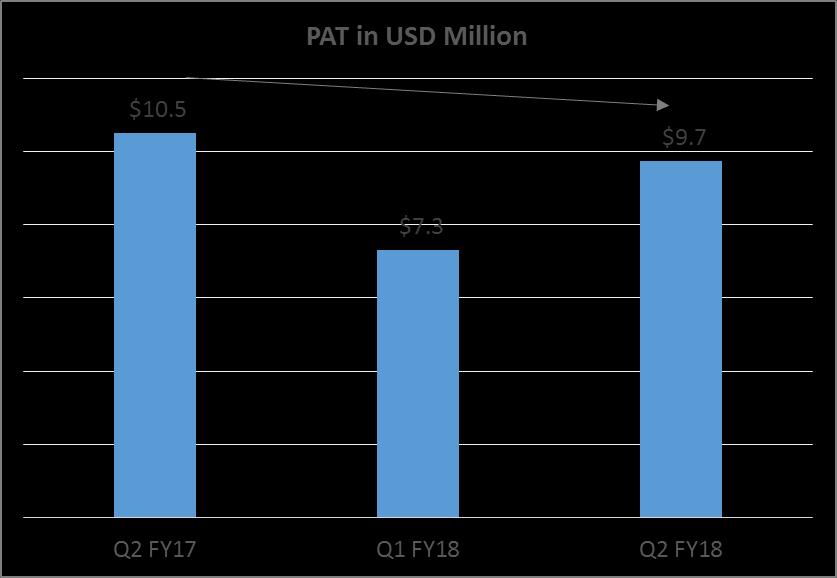
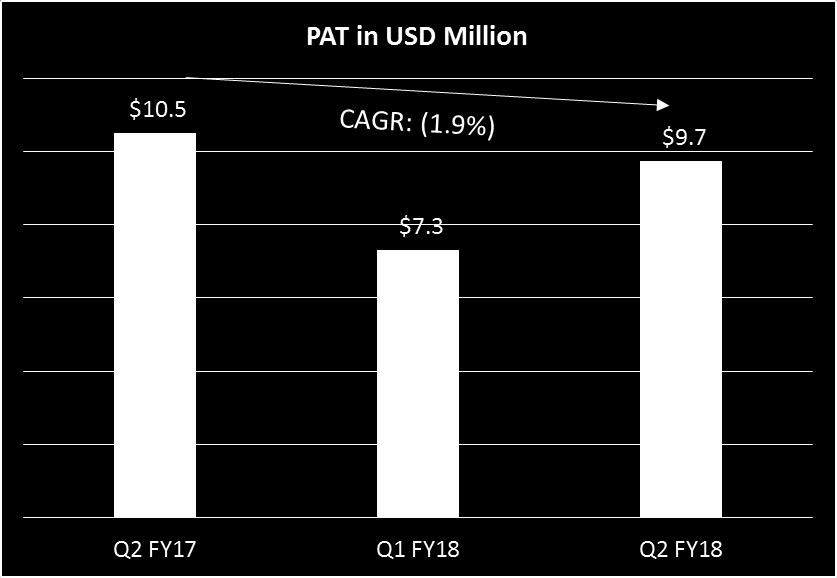
1 Zensar reports 3.8% sequential quarter revenue growth in Q2 FY 18 Digital services continue to grow and are at 36.8% of revenue Pune, India, November 3, 2017: Zensar Technologies, a leading digital solutions and technology services company that specialises in partnering with global organisations across industries on their Digital transformation journey, announced its audited consolidated financial results for its second Quarter ending September 30, 2017 of the fiscal year Financial Highlights: The Company reported quarter on quarter revenue growth of 3.8% at close of Q2 FY18 from USD M to USD M. The PAT for the quarter grew by 33.1% from 7.3 USD M to 9.7 USD M. Digital services continue to grow and have moved up 5.3% sequentially from a 36.3% of revenue contribution in Q1 FY 18 to 36.8% of Q2 FY 18 revenue. Sandeep Kishore, Chief Executive Officer and Managing Director, Zensar Technologies said, The Company continues to have a razor sharp focus on its Digital business and has kept up the growth momentum in the second Quarter of fiscal year Zensar s proprietary Return on Digital platform with its new suite of innovative solutions, has continued to help the company leverage new wins, with half of the quantum of wins in Digital services. Key regions and industries have performed well this Quarter and we continue to retain focus on our strategic thrust areas, Sandeep added. Manoj Jaiswal, Chief Financial Officer, said, "With Zensar now Living Digital internally as well, our ability to manage the business effectively has improved substantially. This coupled with our significant focus on cost and productivity improvement has not only helped us negate the impact of wage increase but has also helped us improve our gross margins by 118 bps. Significant Wins Q2 FY 18: The Company has continued to report significant new wins, with 50% of new clients added in Digital services. Significant new wins are listed here: A. Digital Wins Experience Design services: for one of the leaders in Health Cash plans industry in the UK Market; a global leader in online trading; a company that focused on the creation of multimedia and creativity software products, and more recently in rich internet application software development; a research and insights services deal for a UK based company which operates two significant vehicle rental brands in Europe, Middle East, Africa and Asia. Digital Commerce deals for retail enterprises: a multi-year, multi-million deal for the largest specialty retailer of men's apparel, with operations throughout the US and in London; a chain of beauty stores in the United States which carries cosmetics and skincare brands, men's and women's fragrances, and haircare products; an American corporation based in Wisconsin that formulates and packages synthetic lubricants and filters. Analytics: a multi-million deal with an American multinational technology conglomerate that develops, manufactures and sells networking hardware, telecommunications equipment and other high-technology services and products; an American energy company that designs and manufactures crystalline silicon photovoltaic cells and solar panels. Automation: a Robotic Process Automation deal for a South African financial services group headquartered in Cape Town, 'The Vinci ' automation deal for one of North America's leading airlines. Digital Testing: a multi-million, multi-year deal for one of the leaders in the financial solutions industry in Africa; a multi-year Agile Testing deal for one of the industry leaders in risk mitigation; a digital testing deal for an investment advisory, portfolio management, securities company.
2 B. Traditional Services Wins An Oracle EBS deal for an American company headquartered in New Jersey that provides and services voice communication systems for financial companies; an Oracle EBS deal for an American Company that manufactures and distributes analytical instruments and reagents used to test the quality of water and other liquid solutions, an Oracle EBS deal for an American animation studio based in Glendale, California which produces animated feature films, television programs and online virtual games, an Oracle EBS deal for a supplier of critical systems and components to the aerospace and defence markets An application maintenance deal for one of the world's biggest developers and suppliers of online Microgaming based in South Africa; an Application Support and Enhancement deal for an international investment, savings, insurance, and banking group in South Africa; an application support and maintenance deal for a non-profit organisation in the US specialising in alternative dispute resolution SAP implementation for a global leader in pharmaceutical manufacturing; an SAP implementation deal for a leading supplier of biopharmaceutical and human plasma products C. Corporate Excellence in Q2 FY 18: Zensar named in ISG Provider Lens Quadrant Report ISG Application Development and Maintenance Services Report Zensar named Major Contender in Everest Group Workplace Services Market Trends and PEAK Matrix Assessment Zensar named in new ISG research Digital Workplace Services Archetype Report Zensar named in Everest Group IT Infrastructure Automation Market Update and PEAK Matrix Assessment for Solutions (Focus on IT Service Providers) Zensar named in Gartner Digital Commerce Vendor Guide Zensar mentioned in Gartner Competitive Landscape : Partnering with Third Party Maintenance Providers for Data Center and Network Maintenance Cost Optimization Zensar launches next generation Cloud management offerings with Cisco s Cloud Center Capabilities Note: All numbers are as per the Ind-AS reporting standard
3 Q2 FY Revenue and profitability snapshot (US$) Particulars USD Mn Q2 FY18 INR Cr Growth Q-o-Q Y-o-Y USD INR CC USD INR CC Revenue $ % 3.5% 3.3% 3.1% (1.0%) 2.3% EBITDA $ % 18.9% (16.9%) (20.2%) EBIT $ % 26.4% (24.0%) (27.0%) PAT $ % 32.8% (7.3%) (11.0%) Q2 FY Revenue Growth in Constant Currency Particulars Segments Q2 FY17-18 QoQ Consolidated For the Company 3.3% US 0.5% Geography Europe 3.3% Africa 8.7% RoW 67.7% Application Management Services 5.2% Services Infrastructure Management (5.1%) Maintenance (7.3%) Services (3.6%) Manufacturing 3.4% Industry Retail and Consumer Services 5.4% Financial Services 5.5% Emerging (21.5%)
4 Performance Highlights
5 Income Statement Income Statement (USD Mn) Q2 FY 17 FY 17 Q1 FY 18 Q2 FY 18 Operating revenue Sequential Growth 1.9% 3.1% 3.8% Year-Over-Year Growth -0.3% 1.5% 1.2% 3.1% Cost of revenue Gross profit Gross profit % of revenue 30.1% 29.3% 27.6% 28.8% Sequential Growth 5.3% 2.5% 8.2% Year-Over-Year Growth -7.6% -5.2% -4.0% -1.4% Sales and marketing expenses General and administration expenses Operating expenses % of revenue 15.6% 16.8% 17.4% 17.2% Other operating income Earnings before interest, tax, depreciation and amortization (EBITDA) EBITDA % of revenue 14.7% 12.7% 10.3% 11.8% Sequential Growth 7.4% 33.7% 19.2% Year-Over-Year Growth -10.5% -14.1% -25.1% -16.9% Depreciation and amortisation Earnings before interest and tax (EBIT) EBIT % of revenue 13.0% 11.1% 7.8% 9.6% Sequential Growth 6.3% 29.7% 26.7% Year-Over-Year Growth -7.9% -11.8% -36.2% -24.0% Interest Exchange Gain/(Loss) Other income Profit before tax % of revenue 13.4% 11.4% 9.6% 11.4% Sequential Growth -6.8% 273.1% 23.2% Year-Over-Year Growth -19.9% -18.6% -33.7% -12.4% Provision for taxation Profit after tax (before minority interest) % of revenue 9.4% 7.8% 6.5% 8.4% Minority interest Profit after tax Profit after tax % of revenue 9.1% 7.7% 6.4% 8.2% Sequential Growth -5.1% 374.8% 33.1% Year-Over-Year Growth -22.9% -21.0% -33.9% -7.3%
6 Income Statement (INR Mn) Q2 FY 17 FY 17 Q1 FY 18 Q2 FY 18 Operating revenue 7,703 30,556 7,367 7,626 Sequential Growth 2.0% -0.9% 3.5% Year-Over-Year Growth 2.7% 4.0% -2.5% -1.0% Cost of revenue 5,388 21,603 5,334 5,432 Gross profit 2,316 8,953 2,032 2,194 Gross profit % of revenue 30.1% 29.3% 27.6% 28.8% Sequential Growth 5.4% -1.5% 8.0% Year-Over-Year Growth -4.8% -2.8% -7.5% -5.3% Sales and marketing expenses 559 2, General and administration expenses 646 2, Operating expenses 1,204 5,135 1,285 1,309 % of revenue 15.6% 16.8% 17.4% 17.2% Other operating income Earnings before interest, tax, depreciation and amortization (EBITDA) 1,129 3, EBITDA % of revenue 14.7% 12.7% 10.3% 11.8% Sequential Growth 7.5% 28.6% 18.9% Year-Over-Year Growth -7.8% -11.9% -27.8% -20.2% Depreciation and amortisation Earnings before interest and tax (EBIT) 1,001 3, EBIT % of revenue 13.0% 11.1% 7.8% 9.6% Sequential Growth 6.4% 24.8% 26.4% Year-Over-Year Growth -5.1% -9.5% -38.6% -27.0% Interest Exchange Gain/(Loss) Other income Profit before tax 1,033 3, % of revenue 13.4% 11.4% 9.6% 11.4% Sequential Growth -6.7% 258.8% 22.9% Year-Over-Year Growth -17.5% -16.4% -36.1% -15.8% Provision for taxation 306 1, Profit after tax (before minority interest) 728 2, % of revenue 9.4% 7.8% 6.5% 8.4% Minority interest Profit after tax 704 2, Profit after tax % of revenue 9.1% 7.7% 6.4% 8.2% Sequential Growth -5.1% 356.6% 32.8% Year-Over-Year Growth -20.6% -18.9% -36.3% -11.0%
7 Other Metrics Q2 FY 17 FY 17 Q1 FY 18 Q2 FY 18 Revenue By Service Offering Application Management Services 77.3% 78.5% 81.5% 83.1% Infrastructure Management Services 22.7% 21.5% 18.5% 16.9% Maintenance 6.1% 6.5% 6.3% 5.6% Services 16.6% 15.1% 12.1% 11.3% Revenue By Industry Manufacturing 51.4% 52.2% 48.7% 48.7% Retail and Consumer Services 25.9% 25.5% 28.3% 28.9% Financial Services 18.2% 18.4% 18.8% 19.2% Emerging 4.5% 3.9% 4.2% 3.2% Revenue By Geographical Segment US 74.9% 74.3% 74.4% 72.0% Europe 10.0% 11.6% 13.8% 14.2% Africa 8.7% 8.8% 9.5% 9.9% ROW 6.5% 5.3% 2.4% 3.9% Revenue By Project Type Fixed Price 50.2% 48.9% 47.9% 50.9% Time & Materials 49.8% 51.1% 52.1% 49.1% Constant Currency Operating revenue (Constant Currency mn) Sequential Growth 2.3% 3.6% 2.5% 3.3% Year-Over-Year Growth 2.3% 3.6% 1.7% 2.3% Constant Currency Growth By Service Offering (QoQ %) Application Management Services 1.5% 6.5% 1.8% 5.2% Infrastructure Management Services 4.2% -6.1% 5.4% -5.1% Maintenance -13.6% -11.6% 0.2% -7.3% Services 15.3% -3.0% 9.6% -3.6% Constant Currency Growth By Industry (QoQ %) Manufacturing -2.1% 0.5% -4.6% 3.4% Retail and Consumer Services 10.0% 21.8% 8.9% 5.4% Financial Services 1.8% 1.9% 9.3% 5.5% Emerging 14.6% -31.2% 27.5% -21.5% Constant Currency Growth By Geography (QoQ %) US 2.1% -2.0% 4.1% 0.5% Europe 3.0% 35.7% -0.9% 3.3% Africa 4.1% 11.6% 7.3% 8.7% ROW -0.9% 11.3% -31.7% 67.7%
8 Other Metrics Q2 FY 17 FY 17 Q1 FY 18 Q2 FY 18 Client Data Number of million dollar Clients (LTM Revenue) 1 Million dollar Million dollar Million dollar Million dollar Revenue from top clients Revenue- top 5 clients 38.9% 37.8% 34.9% 35.3% Revenue- top 10 clients 48.6% 45.8% 43.1% 43.6% Revenue- top 20 clients 59.1% 55.8% 54.5% 56.1% Repeat business % 80% 76% 76% 82% Number of active clients New clients added in the period Onsite : Offshore Revenue mix Onsite 66.0% 66.5% 62.5% 62.5% Offshore 34.0% 33.5% 37.5% 37.5% Utilization Utilization (excluding Trainees) 80.1% 79.6% 83.2% 85.9% Employee data Headcount Technical - Onsite 1,540 1,691 1,810 1,806 Technical - Offshore 5,699 5,739 5,779 5,674 Technical - BPO / Others Marketing Support (including trainees) Total 8,316 8,524 8,567 8,414 Gross employees added during the period 730 2, % of women employees 25.4% 25.6% 26.2% 26.0% Attrition Attrition 15.6% 15.4% 17.1% 15.4%
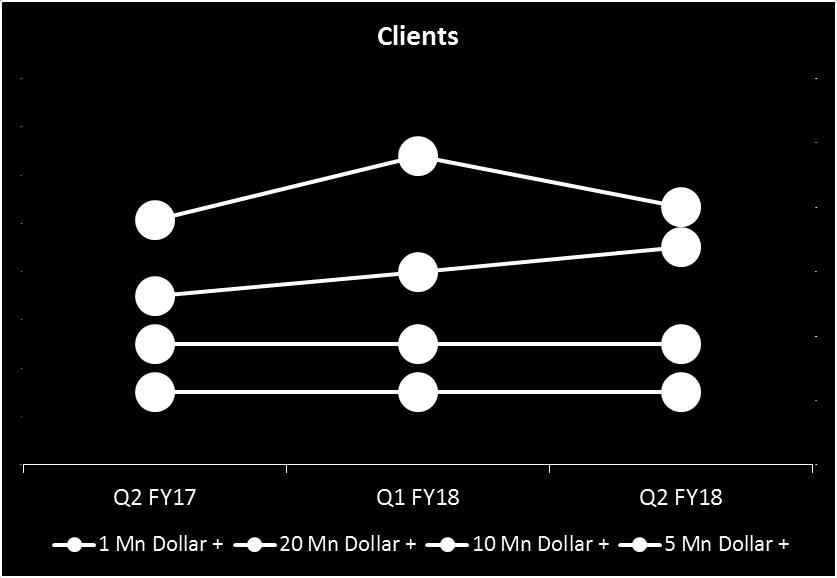
9 Other Metrics Q2 FY 17 FY 17 Q1 FY 18 Q2 FY 18 Exchange Rates Rupee Dollar Rate Period Closing Rate Period Average Rate Rupee Euro Rate Period Closing Rate Period Average Rate Rupee GBP Rate Period Closing Rate Period Average Rate Rupee ZAR Rate Period Closing Rate Period Average Rate Revenue By Currency Dollar 77.5% 75.9% 75.9% 74.3% Euro 1.5% 1.1% 1.2% 1.2% GBP 7.8% 10.0% 12.0% 12.2% ZAR 7.6% 7.6% 8.2% 8.8% Others 5.6% 5.4% 2.6% 3.4% Total 100.0% 100.0% 100.0% 100.0% Effective Tax Rate 29.6% 31.6% 29.2% 25.4% Accounts receivables (in days) Billed Unbilled Total Summary of Cash and Cash Equivalents Cash and Cash Equivalents (USD mn) Cash on hand Balances with Banks : In current accounts Deposit with original maturity of less than three months Other Bank Balances: Unpaid dividend accounts Total Investment in Mutual Funds
10 Other Metrics Q2 FY 17 FY 17 Q1 FY 18 Q2 FY 18 Summary of Debt Debt (USD mn) Short-term debt Long-term debt Total Outstanding Hedges USD Value Avg. Rate/ INR GBP Value Avg. Rate/ INR ZAR Value Avg. Rate/ INR Summary of Capex Capex (USD Mn) Earning Per Share (INR/share) Basic Diluted Shareholding Public Shareholding 51.7% 51.4% 51.3% 51.1% Promoter Shareholding 48.3% 48.6% 48.7% 48.9%
11 About Zensar ( Zensar is a leading digital solutions and technology services company that specialises in partnering with global organisations across industries on their Digital Transformation journey. A technology partner of choice, backed by strong track-record of innovation; credible investment in Digital solutions; assertion of commitment to client s success, Zensar s comprehensive range of digital and technology services and solutions enable its customers to achieve new thresholds of business performance. Zensar, with its experience in delivering excellence and superior client satisfaction through myriad technology solutions, is uniquely positioned to help them surpass challenges around running their existing business most efficiently, helping in their legacy transformation, and planning for business expansion and growth through innovative and digital ways. Follow Zensar via: Zensar Blog: Twitter: LinkedIn: Facebook: Catch our refreshed new website at: About RPG Enterprises ( Mumbai headquartered RPG Enterprises is one of India's largest industrial conglomerates. With over 15 companies in its fold, the group has a strong presence across core business sectors such as Infrastructure, Tyre, IT and Specialty. Established in 1979, RPG Enterprises is one of India s fastest growing business groups with a turnover in excess of Rs 21,000 crore. For any queries please feel free to reach out: PR Contacts (Global Headquarters - India): Lavanya Jayaram Chief Marketing Officer Zensar Technologies lavanya.jayaram@zensar.com Aradhana Prabhu Public Relations Zensar Technologies aradhana.prabhu@zensar.com Safe Harbor Certain statements in this release concerning our future growth prospects are forward-looking statements which involve a number of risks and uncertainties that could cause actual results to differ materially from those in such forwardlooking statements. The risks and uncertainties relating to these statements include, but are not limited to, risks and uncertainties regarding fluctuations in earnings, our ability to manage growth, intense competition in IT services including those factors which may affect our cost advantage, wage increases in India, our ability to attract and retain highly skilled professionals, time and cost overruns on fixed price, fixed-time frame contracts, client concentration, restrictions on immigration, our ability to manage our international operations, reduced demand for technology in our key focus areas, disruptions in telecommunication networks, our ability to successfully complete and integrate potential acquisitions, liability for damages on our service contracts, withdrawal of governmental fiscal incentives, political instability, legal restrictions on raising capital or acquiring companies outside India, and unauthorised use of our intellectual property and general economic conditions affecting our industry. The Company does not undertake to update any forward-looking statement that may be made from time to time by or on behalf of the Company.
TCS Financial Results
 TCS Financial Results Quarter I FY 2016-17 July 14, 2016 1 Copyright 2014 Tata Consultancy Services Limited Disclaimer Certain statements in this release concerning our future prospects are forward-looking
TCS Financial Results
 TCS Financial Results Quarter I FY 2017-18 July 13, 2017 1 Copyright 2017 Tata Consultancy Services Limited Disclaimer Certain statements in this release concerning our future prospects are forward-looking
TCS Financial Results
 TCS Financial Results Quarter II FY 2017-18 Oct 12, 2017 1 Copyright 2017 Tata Consultancy Services Limited Disclaimer Certain statements in this release concerning our future prospects are forward-looking
Performance for the Second Quarter ended September 30, 2010
 Performance for the Second Quarter ended September 30, 2010 S. Gopalakrishnan Chief Executive Officer and Managing Director S. D. Shibulal Chief Operating Officer and Director Safe Harbour Certain statements
TCS Financial Results
 TCS Financial Results Quarter III FY 2018-19 January 10, 2019 1 Copyright 2018 Tata Consultancy Services Limited Disclaimer Certain statements in this release concerning our future prospects are forward-looking
Investor Update Q Mar 2015
 Passionate Employees Innovative Services Investor Update Q1 2015 Mar 2015 Delighted Customers Hexaware Technologies. All rights reserved. www.hexaware.com Safe harbor statement Certain statements on this
Infosys Technologies (NASDAQ: INFY) Announces Results for the Quarter ended June 30, 2009
 Announces Results for the Quarter ended June 30, 2009") Infosys Technologies (NASDAQ: INFY) Announces Results for the Quarter ended June 30, 2009 Q1 revenues declined by 2.9% year on year; sequentially grew by 0.1% Bangalore, India July 10, 2009 Highlights
Infosys Technologies (NASDAQ: INFY) Announces Results for the Quarter ended June 30, 2009 Q1 revenues declined by 2.9% year on year; sequentially grew by 0.1% Bangalore, India July 10, 2009 Highlights
Hexaware s Q1 07 revenue up 50% y-o-y; Record highs in order book addition & client acquisitions
 Hexaware s Q1 07 revenue up 50% y-o-y; Record highs in order book addition & client acquisitions Y-o-Y revenue growth of 50.1% to Rs.2643.69 mn (51.5% to $60.11 mn); Y-o-Y Profit after Tax up 35.2% to
TCS Financial Results
 TCS Financial Results Quarter IV & Year Ended FY 2017-18 April 19, 2018 1 Copyright 2018 Tata Consultancy Services Limited Disclaimer Certain statements in this release concerning our future prospects
Infosys Technologies Limited Financial Release September 30, 2010
 Infosys Technologies (NASDAQ: INFY) Announces Results for the Quarter ended 2010 Q2 revenues grew by 29.6% year on year; sequentially grew by 10.2% Bangalore, India October 15, 2010 Highlights Consolidated
TCS Financial Results
 TCS Financial Results Quarter II FY 2018-19 October 11, 2018 1 Copyright 2018 Tata Consultancy Services Limited Disclaimer Certain statements in this release concerning our future prospects are forward-looking
Earnings Release for the Quarter ended September 30, 2013 Results
 TAKE Solutions Ltd. Quarter ended September 30, 2013 Earnings Release Earnings Release for the Quarter ended September 30, 2013 Results Chennai, India Monday, November 11, 2013: TAKE Solutions, Ltd. [BSE:
TCS Financial Results
 TCS Financial Results Quarter III FY 2017-18 Jan 11, 2018 1 Copyright 2017 Tata Consultancy Services Limited Disclaimer Certain statements in this release concerning our future prospects are forward-looking
Earnings Release for the Quarter ended December 31, 2013 Results
 TAKE Solutions Ltd. Quarter ended December 31, 2013 Earnings Release Earnings Release for the Quarter ended December 31, 2013 Results Chennai, India Friday, January 31, 2014: TAKE Solutions, Ltd. [BSE:
Q4 PAT at Rs 377 crores, up 37% QoQ Annual revenue up 25% and PAT up 18%
 Q4 PAT at Rs 377 crores, up 37% QoQ Annual revenue up 25% and PAT up 18% Press Release - Mumbai, India, May 21, 2013 Tech Mahindra, India s leading software exporter today announced audited consolidated
Tech Mahindra Q1 Revenue up 13% YoY
 Tech Mahindra Q1 Revenue up 13% YoY EBITDA up 45% and PAT up 12% YoY USD Revenue grew 0.3% QoQ, in CC terms Mumbai, July 30, 2018: Tech Mahindra Ltd., a specialist in digital transformation, consulting
Tata Consultancy Services. Investor Relations
 Tata Consultancy Services Investor Relations April 2011 1 Investor Relations Forward Looking Statement Certain statements in this release concerning our future prospects are forward-looking statements.
Tech Mahindra Q2 PAT up 27% YoY
 Tech Mahindra Q2 PAT up 27% YoY Revenue up 13% YoY and EBITDA up 46% YoY Q2 new deal wins of over US$ 550 mn Mumbai, October 30, 2018: Tech Mahindra Ltd., a specialist in digital transformation, consulting
16 July Results for Quarter I FY
 Results for Quarter I FY 2007-08 Disclaimer Certain statements in this release concerning our future growth prospects are forward- looking statements, which involve a number of risks, and uncertainties
Tanla Solutions Ltd. acquires Karix Mobile for
 Tanla Solutions Ltd. acquires Karix Mobile for 340 Crore in a cash and stock transaction from GSO Capital Partners, a Blackstone Company: Combined entity to be India s leading Enterprise Cloud Communications
Earnings Release & Fact Sheet Second Quarter, Fiscal 2018
 Earnings Release & Fact Sheet Second Quarter, Fiscal 2018 November 6, 2017 Contents 1. Earnings Release Q2 FY18......3 2. Performance Highlights Q2 FY18 7 3. Financial Statements Q2 FY18 11 4. Contact
Earnings Release for the Quarter ended June 30, 2015
 TAKE Solutions Ltd. Earnings Release for the Quarter ended June 30, 2015 Chennai, India Friday, August 07, 2015: TAKE Solutions Ltd. [BSE: 532890 NSE: TAKE], a leading global business technology company
Q1 PAT at INR 338 crore; up 22% YoY;
 Q1 PAT at INR 338 crore; up 22% YoY; EBITDA at INR 330 Crore, up 37% YoY; EBIDTA margins at 21.4%, expand by 440bps QoQ Press Release Mumbai, India, August 9 th, 2012 Tech Mahindra, India s sixth largest
NAVIGATE YOUR NEXT. Our strategic direction. Salil Parekh CEO & MD
 Safe Harbor Certain statements mentioned in this presentation concerning our future growth prospects are forward-looking statements regarding our future business expectations intended to qualify for the
Manufacturing. Sanjay Jalona EVP & Head Hi-Tech & Manufacturing and Engineering Services Infosys Limited
 Manufacturing Sanjay Jalona EVP & Head Hi-Tech & Manufacturing and Engineering Services Safe Harbor Certain statements in this presentation concerning our future growth prospects are forward-looking statements
INVESTOR PRESENTATION Q2, July- September
 INVESTOR PRESENTATION Q2, July- September 2011-12 P u s h i n g t h e l i m i t s o f Po s s i b i l i t y Safe Harbor Certain statements in this release concerning our future growth prospects may be forward-looking
Earnings Release for the Quarter ended June 30, 2017
 TAKE Solutions Ltd. Earnings Release for the Quarter ended June 30, 2017 Chennai, India Monday, August 14, 2017: TAKE Solutions Ltd. [BSE: 532890 NSE: TAKE], a globally recognized knowledge and innovation
HCL TECHNOLOGIES EARNINGS PRESENTATION SECOND QUARTER FY 16 WHERE VALUES DRIVE VELOCITY
 HCL TECHNOLOGIES EARNINGS PRESENTATION SECOND QUARTER FY 16-1 - Performance Snapshot ANANT GUPTA - 2 - In USD Mn Number Of Clients In USD Mn In USD Mn PERFORMANCE TRENDS (CALENDAR YEAR BASIS) REVENUE EBIT
Infosys Technologies (NASDAQ: INFY) Announces Results for the Quarter ended December 31, 2010
 Announces Results for the Quarter ended December 31, 2010") Infosys Technologies (NASDAQ: INFY) Announces Results for the Quarter ended December 31, 2010 Q3 revenues grew by 28.7% year on year; sequentially grew by 6.0% Bangalore, India January 13, 2011 Highlights
Infosys Technologies (NASDAQ: INFY) Announces Results for the Quarter ended December 31, 2010 Q3 revenues grew by 28.7% year on year; sequentially grew by 6.0% Bangalore, India January 13, 2011 Highlights
Enterprise Solutions. Chandra Shekar Kakal Senior Vice President & Executive Council Member Head Enterprise Solutions
 Enterprise Solutions Chandra Shekar Kakal Senior Vice President & Executive Council Member Head Enterprise Solutions Safe Harbor Certain statements made in this Analyst Meet concerning our future growth
Building Next Generation Services Model
 Building Next Generation Services Model U. B. Pravin Rao Chief Operating Officer Safe Harbor Certain statements in this presentation concerning our future growth prospects are forward-looking statements
L&T Technology Services Limited Second Quarter - FY 18 Results
 L&T Technology Services Limited Second Quarter - FY 18 Results ENGINEERING THE CHANGE INVESTOR RELEASE Bengaluru, India - November 07, 2017 www.lnttechservices.com FINANCIAL HIGHLIGHTS REVENUE IN INR INR
Investor Meet February Americas. Rajiv Pant Head - Americas
 Investor Meet February 2012 Americas Rajiv Pant Head - Americas Safe Harbor Statement Certain statements on this presentation concerning our future growth prospects are forward-looking statements, which
Investor Presentation. May 2013
 Investor Presentation May 2013 MAHINDRA. A HISTORY OF RISING. We will challenge conventional thinking and innovatively use all our resources to drive positive change in the lives of our stakeholders and
New Services. Sandeep Dadlani. President and Head Manufacturing, Retail, CPG & Logistics
 New Services Sandeep Dadlani President and Head Manufacturing, Retail, CPG & Logistics SAFE HARBOR Certain statements in this presentation concerning our future growth prospects are forward-looking statements
Strategic Highlights. S. D. Shibulal Chief Operating Officer
 Strategic Highlights S. D. Shibulal Chief Operating Officer Safe Harbor Certain statements in this analyst meet concerning our future growth prospects are forward-looking statements, within the meaning
Insurance, Healthcare and Life Sciences. Eric Paternoster Senior Vice President
 Insurance, Healthcare and Life Sciences Eric Paternoster Senior Vice President Safe Harbor Certain statements in this analyst meet concerning our future growth prospects are forward-looking statements,
Tech Mahindra s Q3 PAT up 67% YoY
 Tech Mahindra s Q3 PAT up 67% YoY Press Release Mumbai, India, February 6 th, 2013 Tech Mahindra, India s sixth largest software exporter today announced its audited consolidated financial results for
Banking and Capital Markets. Shaji Farooq VP & Head - BCM - USA
 Banking and Capital Markets Shaji Farooq VP & Head - BCM - USA Safe Harbor Certain statements made in this Analyst Meet concerning our future growth prospects are forward looking statements, which involve
Q3 FY18 RESULTS. AXISCADES Engineering Technologies Limited CIN NO : L72200KA1990PLC084435
 Q3 FY18 RESULTS AXISCADES Engineering Technologies Limited CIN NO : L72200KA1990PLC084435 Disclaimer Certain statements in this communication may be considered as forward looking statements within the
Finacle. Haragopal. Vice President
 Finacle Haragopal Vice President Safe Harbor Certain statements made here concerning Infosys future growth prospects are forward-looking statements which involve a number of risks and uncertainties that
Earnings Release & Fact Sheet Second Quarter, Fiscal 2017 November 9, 2016
 Earnings Release & Fact Sheet Second Quarter, Fiscal 2017 November 9, 2016 Page 1 of 14 Contents 1.Earnings Release Q2 FY17......3 2.Performance Highlights Q2 FY17 7 3.Financial Statements Q2 FY17 11 4.
L&T Technology Services Limited Third Quarter - FY 18 Results
 L&T Technology Services Limited Third Quarter - FY 18 Results ENGINEERING THE CHANGE INVESTOR RELEASE Mumbai, India - January 23, 2018 www.lnttechservices.com FINANCIAL HIGHLIGHTS REVENUE IN INR INR Revenue
TAKE Solutions Ltd. Announces Results for the Third Quarter ended December 31, 2010
 Chennai, India - January 28, 2011 HIGHLIGHTS: TAKE Solutions Ltd. Announces Results for the Third Quarter ended December 31, 2010 Net Profit increased 13 y-o-y and 15% q-o-q Revenue increased 33% y-o-y
L&T Technology Services Limited Fourth Quarter - FY 18 Results
 L&T Technology Services Limited Fourth Quarter - FY 18 Results ENGINEERING THE CHANGE INVESTOR RELEASE Mumbai, India - May 22, 2018 www.lnttechservices.com FINANCIAL HIGHLIGHTS REVENUE IN INR INR Revenue
Revenues drive TCS Growth
 Highlights for Q1 2005-6: Strong International INDIAN GAAP Revenues drive TCS Growth Rs. Crores Q-on-Q Total Income 2,721.02 6.25% PBIDT PAT 826.97 630.62 39.24% 33.66% EPS Rs 12.89 in Q1, up from Rs.
HCL TECHNOLOGIES EARNINGS PRESENTATION Q4 & ANNUAL - FY 15
 HCL TECHNOLOGIES EARNINGS PRESENTATION Q4 & ANNUAL - FY 15-1 - Performance Snapshot Anant Gupta - 2 - PERFORMANCE TRENDS (LAST 3 FINANCIAL YEARS) REVENUE EBIT 4,686 5,360 5,952 925 1,292 1,324 In USD Mn
Strong Q4 leads to double digit revenue growth of 10% in FY17; Net profit for FY17 grows at 16% YoY
 Strong Q4 leads to double digit revenue growth of 10% in FY17; Net profit for FY17 grows at 16% YoY Mumbai, India: May 04, 2017 Larsen & Toubro Infotech Ltd. (NSE: LTI, BSE: 540005), a global technology
R Systems Announces Record Revenues and Net Profits for Q and Calendar Year 2007
 R Systems Announces Record Revenues and Net Profits for Q4 2007 and Calendar Year 2007 FY 2007: Revenues: Rs 247.1 Crores and Net Profits: Rs18.9 Crores Q4 2007: Revenues: Rs 64.7 Crores and Net Profits:
Mitel Networks. Canaccord Genuity 34 th Annual Growth Conference. August 14, 2014
 Mitel Networks Canaccord Genuity 34 th Annual Growth Conference August 14, 2014 SAFE HARBOR STATEMENT Forward Looking Statements Some of the statements in this presentation are forward-looking statements
Manufacturing (MFG) Srinivas B. G. Member of the Board, Head of Europe and Head, Manufacturing
 Srinivas B. G. Member of the Board, Head of Europe and Head, Manufacturing") Manufacturing (MFG) Srinivas B. G. Member of the Board, Head of Europe and Head, Manufacturing Safe harbor Certain statements in this presentation concerning our future growth prospects are forward-looking
Manufacturing (MFG) Srinivas B. G. Member of the Board, Head of Europe and Head, Manufacturing Safe harbor Certain statements in this presentation concerning our future growth prospects are forward-looking
Banking and Capital Markets
 Banking and Capital Markets Ashok Vemuri Member of the Executive Council & Global Head, BCM Safe Harbor Certain statements made in this Analyst Meet concerning our future growth prospects are forward-looking
DATAMATICS GLOBAL SERVICES LIMITED Q1 FY19 Results Update AUGUST 2018
 DATAMATICS GLOBAL SERVICES LIMITED Q1 FY19 Results Update AUGUST 2018 COMPANY OVERVIEW FINANCIAL OVERVIEW DISCUSSION SUMMARY AWARDS & CERTIFICATIONS COMPANY OVERVIEW COMPANY OVERVIEW OUR BRIEF PROFILE
Quarter ended March 31, 2004
 Quarter ended March 31, 2004 26 th April 2004 Q3 FY2004 Key Highlights Financial Highlights Revenue at Rs 6.47bn up by 8.9% in US dollar terms EBITDA up by 18% QoQ (in INR) EBITDA margin up 270bps, driven
Infosys Technologies Limited Financial Release September 30, Infosys Technologies Announces Results for the Quarter ended September 30, 2010
 Infosys Technologies Announces Results for the Quarter ended September 30, 2010 Q2 revenues grew by 24.4% year on year; sequentially grew by 12.1% Bangalore, India Oct 15, 2010 Highlights Consolidated
Investor Meet February Travel & Transportation. Madhu Kumar Global Vertical Head
 Investor Meet February 2012 Travel & Transportation Madhu Kumar Global Vertical Head Safe Harbor Statement Certain statements on this presentation concerning our future growth prospects are forward-looking
Third Quarter 2009 Result
 Investors Meet Third Quarter 2009 Result 29 th October 2009 October 29, 2009 1 Safe Harbor Certain statements in this presentation concerning our future growth prospects are forward-looking statements.
Retail. Pravin Rao. Senior Vice President & Head Retail Business Unit
 Retail Pravin Rao Senior Vice President & Head Retail Business Unit Safe Harbor Certain statements in this Analyst meet concerning Infosys future growth prospects are forwardlooking statements which involve
Financial Performance Q1 & FY 19. Platforms and services for content creation, production, and distribution
 Financial Performance Q1 & FY 19 Platforms and services for content creation, production, and distribution Financial Summary Metrics FY19 Q1 FY18 Q1 Y-o-Y Revenue on Constant Currency (INR Lacs) 6,903
Wipro Limited. September - December Presentation to Investors 2016 WIPRO LTD
 Wipro Limited September - December 2016 Presentation to Investors 1 Safe Harbor This presentation may contain certain forward looking statements, which involve a number of risks, uncertainties and other
HCL TECH ANNOUNCES 33% YoY REVENUE GROWTH
 NEWS RELEASE HCL TECH ANNOUNCES 33% YoY REVENUE GROWTH Growth trends continue across top line and bottom line Stake in HPS divested for Rs.4.8bn Second Quarterly dividend of 100% announced For immediate
First Quarter results for FY 2018
 First Quarter results for FY 2018 Financial Release, Hyderabad, India, July 13, 2017 YoY revenue growth of 12.8% in US$ terms (US$141Mn) YoY Net profit growth of 18.7%; at 878 Mn Services revenue YoY growth
Earnings Release for the Quarter and Year ended March 31, 2017
 TAKE Solutions Ltd. Earnings Release for the Quarter and Year ended March 31, 2017 Chennai, India Thursday, May 18, 2017: TAKE Solutions Ltd. [BSE: 532890 NSE: TAKE], a globally recognized knowledge and
Integrated Research Limited (IRI)
") Integrated Research Limited (IRI) FY2017 Financial Results August 2017 ABN: 76 003 588 449 10 of the Top 10 US banks 125+ of the Fortune 500 6 of the Top 10 Automotive Companies Top Value Vendor 7 of the
Integrated Research Limited (IRI) FY2017 Financial Results August 2017 ABN: 76 003 588 449 10 of the Top 10 US banks 125+ of the Fortune 500 6 of the Top 10 Automotive Companies Top Value Vendor 7 of the
HCL TECHNOLOGIES NET INCOME UP 43%
 NEWS RELEASE HCL TECHNOLOGIES NET INCOME UP 43% Good growth trends continue across top line and bottom line BPO business turns PAT positive on the back of strong revenue growth Third Quarterly dividend
INVESTOR PRESENTATION THIRD QUARTER 2016 SAJAN.COM PUBLIC DOCUMENT SAJAN, INC NASDAQ: SAJA
 INVESTOR PRESENTATION THIRD QUARTER 2016 SAFE HARBOR The Private Securities Litigation Reform Act of 1995 provides a safe harbor from liability for certain forward-looking statements. This presentation
TXT e-solutions. Corporate Presentation March 2015
 TXT e-solutions Corporate Presentation March 2015 2014: Another year of Growth Revenues: 55.9 m (+6.3%), 57% from Int l Operations EBIT: 5.5 m (+10%) Cash Flow from Op. 9.3% of Revenues NFP: 8.5m (+ Treasury
IBM REPORTS 2011 SECOND-QUARTER RESULTS
 IBM REPORTS 2011 SECOND-QUARTER RESULTS o Diluted EPS: - GAAP: $3.00, up 15 percent; - Operating (non-gaap): $3.09, up 18 percent; o Revenue: $26.7 billion, up 12 percent, up 5 percent adjusting for currency;
i-flex records 51 per cent growth in third quarter profits (YoY)
") For Immediate Release i-flex records 51 per cent growth in third quarter profits (YoY) Nine months net profits under US GAAP grow by 102 per cent (YoY) FINANCIALS AT A GLANCE FOR THE QUARTER ENDED DECEMBER
For Immediate Release i-flex records 51 per cent growth in third quarter profits (YoY) Nine months net profits under US GAAP grow by 102 per cent (YoY) FINANCIALS AT A GLANCE FOR THE QUARTER ENDED DECEMBER
CISCO SYSTEMS, INC. Q4 FY 2004 CONFERENCE CALL
 CISCO SYSTEMS, INC. Q4 FY 2004 CONFERENCE CALL August 10, 2004 2004, Cisco Systems, Inc. All rights reserved. 1 GAAP Reconciliation and Forward-Looking Statements GAAP RECONCILIATION During this presentation
Q4 and FY12 Results. People Building Partnerships. 23 April 2012
 People Building Partnerships Q4 and FY12 Results 23 April 2012 Recipient of Frost & Sullivan 2011 Global Enabling Technology Award for Computer-aided Design Global scenario presents Opportunities for Growth
Wipro Limited. July September Presentation to Investors 2014 WIPRO LTD
 Wipro Limited July September 2014 Presentation to Investors 1 Safe Harbor This presentation may contain certain forward looking statements, which involve a number of risks, uncertainties and other factors
i-flex net increases 48% for Financial Year Consolidated US GAAP net profits up by 71% Dividend of 50% recommended
 For Immediate Release i-flex net increases 48% for Financial Year 2002-03 Consolidated US GAAP net profits up by 71% Dividend of 50% recommended FINANCIALS AT A GLANCE FOR THE YEAR ENDED March 31, 2003
Infosys BPO. Amitabh Chaudhry. Infosys BPO - CEO
 Infosys BPO Amitabh Chaudhry Infosys BPO - CEO Safe Harbor Certain statements made here concerning Infosys future growth prospects are forward-looking statements which involve a number of risks and uncertainties
TBR. HCL Technologies PROFESSIONAL SERVICES BUSINESS QUARTERLY SM INITIAL RESPONSE
 PROFESSIONAL SERVICES BUSINESS QUARTERLY SM INITIAL RESPONSE HCL Technologies Third Calendar Quarter 2016 Second Fiscal Quarter 2017 Ended Sept. 30, 2016 Publish Date: Oct. 21, 2016 Author: Matthew O Blenes
For immediate release. i-flex posts robust 17% QoQ and 44% YoY growth in revenues for the quarter ended December 2004
 For immediate release i-flex posts robust 17% QoQ and 44% YoY growth in revenues for the quarter ended December 2004 Operating Income grows 18% QoQ Net Profits for the quarter at Rs 45 crore grows 9% QoQ
THE GLOBAL HOUSE OF PRESTIGE BEAUTY FABRIZIO FREDA PRESIDENT AND CEO THE ESTÉE LAUDER COMPANIES ANNUAL STOCKHOLDERS MEETING
 THE GLOBAL HOUSE OF PRESTIGE BEAUTY FABRIZIO FREDA PRESIDENT AND CEO THE ESTÉE LAUDER COMPANIES ANNUAL STOCKHOLDERS MEETING NOVEMBER 11, 2016 FORWARD-LOOKING INFORMATION THE FORWARD-LOOKING STATEMENTS
Wipro Limited. April - June Presentation to Investors 2017 WIPRO LTD
 Wipro Limited April - June 2017 Presentation to Investors 1 Safe Harbor This presentation may contain certain forward looking statements, which involve a number of risks, uncertainties and other factors
Infosys Limited welcomes you to the
 Infosys Limited welcomes you to the Financial Services and Insurance (FSI) Manish Tandon Head-Business IT Services, FSI Safe harbor Certain statements in this presentation concerning our future growth
Q1 FY18 RESULTS. AXISCADES Engineering Technologies Limited CIN NO : L72200KA1990PLC084435
 Q1 FY18 RESULTS AXISCADES Engineering Technologies Limited CIN NO : L72200KA1990PLC084435 Disclaimer Certain statements in this communication may be considered as forward looking statements within the
In FY17 we met our revenue and profitability targets
 Profit We don t only measure our success in terms of our financial profit, but also how we re innovating to deliver the right outcomes for our clients. Profit We re focused on building a profitable, sustainable
HCL TECHNOLOGIES EARNINGS PRESENTATION THIRD QUARTER FY 17
 HCL TECHNOLOGIES EARNINGS PRESENTATION THIRD QUARTER FY 17-1 - Performance Snapshot C VIJAYAKUMAR - 2 - In USD Mn In USD Mn In USD Mn Number of Employees PERFORMANCE TRENDS ON LTM BASIS REVENUE HEADCOUNT
For personal use only
 Integrated Research Limited 19 August 2014 ABN: 76 003 558 449 9 of the top 10 US banks 5 of the world s 10 largest companies 4 of the 8 biggest stock exchanges www.ir.com 8 of the 10 biggest telcos 4
2009 ANNUAL MEETING OF STOCKHOLDERS. July 17, 2009
 2009 ANNUAL MEETING OF STOCKHOLDERS July 17, 2009 2009 ANNUAL MEETING OF STOCKHOLDERS Robert Williams Director, Investor Relations July 17, 2009 SAFE HARBOR Statements in this presentation that relate
Earnings Release for the Quarter ended September 30, 2017
 TAKE Solutions Ltd. Earnings Release for the Quarter ended September 30, 2017 Chennai, India Wednesday, November 08, 2017: TAKE Solutions Ltd. [BSE: 532890 NSE: TAKE], a globally recognized knowledge and
Q1 FY19 Financial Update
 Q FY9 Financial Update Salesforce NYSE: CRM @Salesforce_ir Safe Harbor "Safe harbor" statement under the Private Securities Litigation Reform Act of 995: This presentation contains forward-looking statements
HRD. Nandita Gurjar. Senior Vice President & Head HR Infosys Group
 HRD Nandita Gurjar Senior Vice President & Head HR Infosys Group Safe Harbor Certain statements made in this Analyst Meet concerning our future growth prospects are forward-looking statements, which involve
For personal use only
 Integrated Research Limited (IRI) FY2017 Half Year Financial Results February 2017 ABN: 76 003 588 449 10 of the Top 10 US banks 120+ of the Fortune 500 6 of the Top 10 Automotive Companies 6 of the 10
Integrated Research Limited (IRI)
") Integrated Research Limited (IRI) FY2017 Half Year Financial Results February 2017 ABN: 76 003 588 449 10 of the Top 10 US banks 120+ of the Fortune 500 6 of the Top 10 Automotive Companies 6 of the 10
Integrated Research Limited (IRI) FY2017 Half Year Financial Results February 2017 ABN: 76 003 588 449 10 of the Top 10 US banks 120+ of the Fortune 500 6 of the Top 10 Automotive Companies 6 of the 10
Avery Dennison Investor Presentation August 2014
 Avery Dennison Investor Presentation August 2014 Unless otherwise indicated, the discussion of the company s results is focused on its continuing operations, and comparisons are to the same period in the
Retail, CPG and Logistics Practice
 Retail, CPG and Logistics Practice Mr. Dinesh Rao Vice President - Retail, CPG and Logistics Practice Safe Harbor Certain statements made here concerning Infosys future growth prospects are forward-looking
Follow us at: /hcltechnologies /hcltech /hcltechtube
 Follow us at: /hcltechnologies /hcltech /hcltechtube Q2 2014 Growth QoQ YoY Revenue 8,184 2.8% 30.4% EBIT 1,941 2.4% 58.7% Net Income 1,496 5.7% 58.4% Amount in US $ million Q2 2014 Growth QoQ YoY Revenue
HCL TECHNOLOGIES REPORTS Q 1 RESULTS. NET INCOME UP 151% - crosses $ 21 million. REVENUES cross $ 69 million
 HCL TECHNOLOGIES REPORTS Q 1 RESULTS NET INCOME UP 151% - crosses $ 21 million REVENUES cross $ 69 million For immediate release October 20, 2000 Executive Summary Financial Highlights (Unaudited US GAAP
Fourt r h t Q u Q art ar er Fiscal scal Y ear ear 2011 Fin i ancial ci al Result l s
 Fourth Quarter Fiscal Year 2011 Financial Results June 9, 2011 1 Forward Looking Statements Certain statements included in this management presentation constitute forward-looking statements, including
Logitech. July 24, 2013
 Logitech Q1 Fiscal Year 2014 July 24, 2013 Forward-Looking Statements This presentation contains forward-looking statements within the meaning of the federal securities laws, including, without limitation,
For personal use only
 Integrated Research Limited (IRI) FY2016 Annual Financial Results August, 2016 ABN: 76 003 588 449 10 of the Top 10 US banks 120+ of the Fortune 500 6 of the Top 10 Automotive Companies 6 of the 10 biggest
Investor Presentation
 Investor Presentation March 20, 2015 Disclaimer Certain statements in this presentation concerning our future growth prospects are forward-looking statements, which involve a number of risks, and uncertainties
CISCO SYSTEMS, INC. Q4 FY 2005 CONFERENCE CALL
 CISCO SYSTEMS, INC. Q4 FY 2005 CONFERENCE CALL August 9, 2005 2005, Cisco Systems, Inc. All rights reserved. 1 GAAP Reconciliation and Forward-Looking Statements GAAP RECONCILIATION During this presentation
Compensation Planning On-Premises or SaaS.. Making the decision
 WHITEPAPER Compensation Planning On-Premises or SaaS.. Making the decision Published on: Feb 2015 Author: HCM Team www.hexaware.com Table of Contents Introduction 3 On-Premises vs. SaaS: Making the choice
FOR IMMEDIATE RELEASE
 Results for the quarter ended September 30, 2015 under IFRS Net Income grew 7% YoY IT Services Revenue grew 3.1% in constant currency FOR IMMEDIATE RELEASE Bangalore, India and East Brunswick, New Jersey,