Informatics in the Anatomical Pathology Laboratory: Making It Work for You
|
|
|
- Eleanor Webb
- 5 years ago
- Views:
Transcription

1 Informatics in the Anatomical Pathology Laboratory: Making It Work for You 1. Welcome 1.1 Welcome

2 1.2 Title + Presenters
3 1.3 Course Outline
4 1.4 Informatics
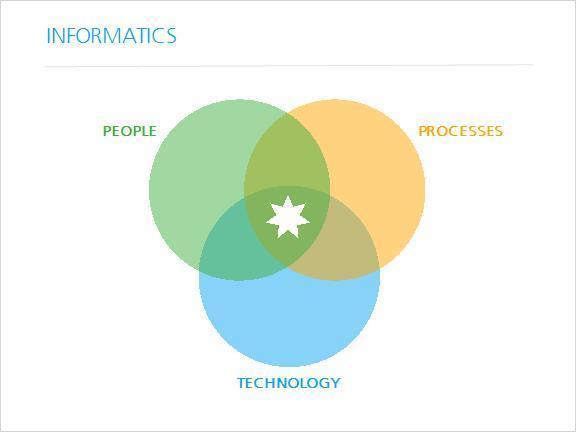
5 1.5 Informatics

6 1.6 Emerging Trends
7 1.7 UPMC Division of Informatics

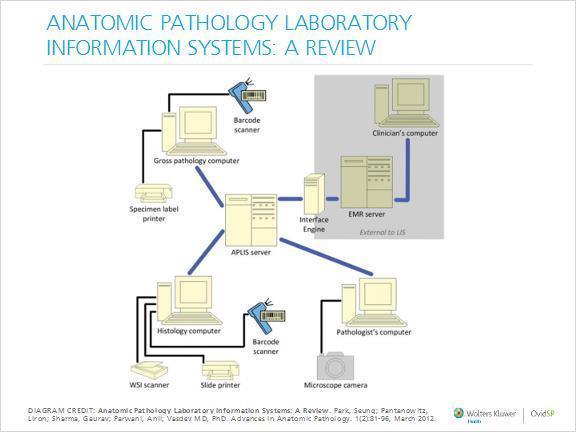
8 2. Overview of LIS 2.1 Overview of LIS

9 2.2 LIS
10 2.3 LIS Building Blocks

11 2.4 Client-Server Architecture

12 2.5 LIS Database
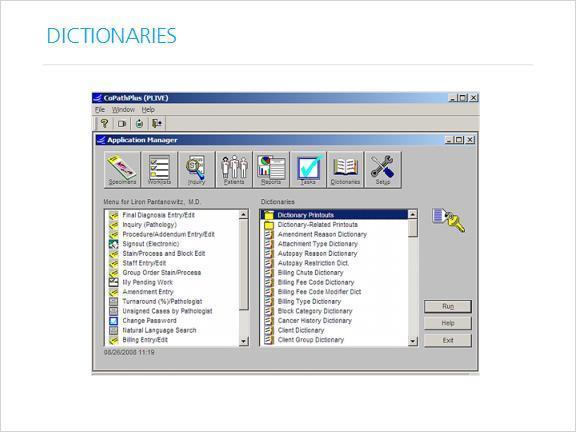
13 2.6 Dictionaries
14 2.7 Dictionaries
15 2.8 LIS

16 2.9 LIS Networks
17 2.10 EMR-LIS Data Flow
18 2.11 Outreach Connectivity
19 2.12 Health Level Seven (HL7)
20 2.13 Health Level Seven Example

21 2.14 Health Level Seven Example
22 2.15 LIS Functions
")
23 2.16 LIS (Data) Workflow
")
24 2.17 LIS (data) Workflow
25 2.18 Middleware
26 2.19 LIS-Middleware Relationship

27 2.20 LIS Trends
28 2.21 Questions 2.22 Knowledge Check (Drag and Drop, 0 points, unlimited attempts permitted)

29 Drag Item LIS app software Op software Drop Target lt blue triangel green triangle Hardware yellow triangle 3 DBMS dk blue triangle Security Measures cloud
30 Drag and drop properties Return item to start point if dropped outside any drop target Snap dropped items to drop target (Stack random) Allow only one item in each drop target Feedback: Great job! Now, Dr. Pantanowitz will talk about Bar Coding.
31 3. Tracking & Barcodes 3.1 Barcoding & Tracking

32 3.2 Lessons Learned from CP

33 3.3 Why Implement Tracking?
34 3.4 Lab Errors
35 3.5 Example: Benefit in AP

36 3.6 AP Test Cycle
37 3.7 Traditional vs. Modern Process

38 3.8 Barcodes

39 3.9 Barcode Driven System
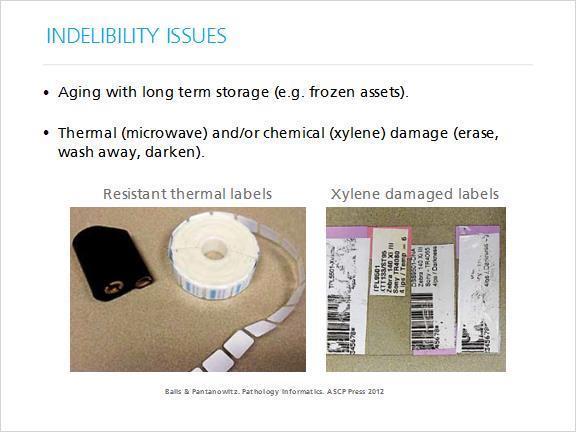
40 3.10 Indelibility Issues
41 3.11 Indelibility Issues
42 3.12 Flexibility (label customization)
43 3.13 Tracking Options

44 3.14 Tracking Middleware

45 3.15 Example Labels

46 3.16 Flow of Barcode Related Data
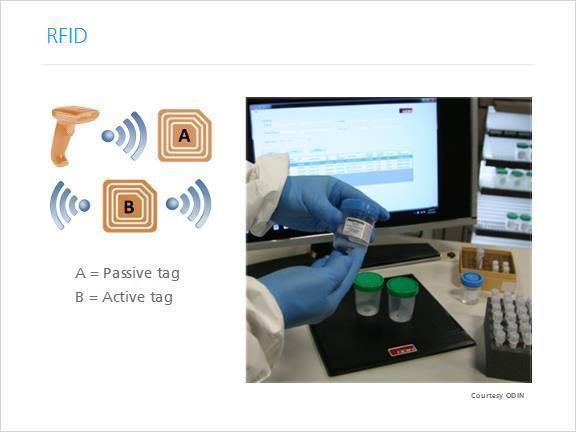
47 3.17 RFID

48 3.18 RFID
49 3.19 AP Workflow
50 3.20 Specimen Collection

51 3.21 When can tracking start?

52 3.22 Accessioning

53 3.23 Labeling Specimens
54 3.24 Grossing

55 3.25 Grossing Workstations

56 3.26 Cassette Printers

57 3.27 Verification & Alert Solutions
58 3.28 Histology

59 3.29 Histology Life Cycle
60 3.30 Histology Life Cycle

61 3.31 Microtomy Workstation

62 3.32 Virtual Slide Folder
63 3.33 Archiving
64 3.34 Storage & Retrieval
65 3.35 Status Monitors

66 3.36 Histology Lab Status Monitors

67 3.37 Tracking Take Home Points
68 3.38 Questions
69 3.39 Implementing Barcoding

70 3.40 Specimen Lifecycle
71 3.41 Mystery Solved

72 3.42 Bar Coding Project

73 3.43 Previous Process
74 3.44 Design

75 3.45 Bar Coding Steps

76 3.46 Process with Barcode Implementation

77 3.47 Bar Coding Project
78 3.48 Post-Barcode Implementation

79 3.49 Barcoding Process

80 3.50 Barcoding Process

81 3.51 Baseline Data: Mislabeled Slides

82 3.52 Results: Reduced Mislabeled Slides

83 3.53 Results
84 3.54 Bar Coding: Experiences and Lessons Learned
85 3.55 Bar Coding: Problems
86 3.56 Conclusions 3.57 Knowledge Check (Drag and Drop, 0 points, unlimited attempts permitted)

87 Drag Item Drop Target Manual workflow Rectangle 8 Continuous tracking Rectangle 9 Automatic data capture Rectangle 9 Portable dashboards Rectangle 9 Logs for tracking Rectangle 8 Automated workflow Rectangle 9
 Feedback: Excellent! 3.")
88 Drag and drop properties Return item to start point if dropped outside any drop target Snap dropped items to drop target (Free) Feedback: Excellent! 3.58 Knowledge Check (Multiple Response, 10 points, 3 attempts permitted)
89 Correct X Choice Barcoding can reduce errors AND improve efficiency in the AP lab. Barcoding labels last forever. Equipment and software are affordable, but not always reliable. X Barcoding can enable specimen tracking While in-depth staff training is both time-consuming and expensive, it is necessary because barcoding eliminates human error. Feedback when correct: Good job! Now, Dr. Parwani will discuss Synoptic Reporting. Feedback when incorrect: Good try. The true statements are: Barcoding can reduce errors AND improve efficiency in the AP lab. Barcoding can enable specimen tracking.

90 4. Synoptic Reporting 4.1 Synoptic Reporting

91 4.2 Synoptic Reports in Pathology
92 4.3 Background
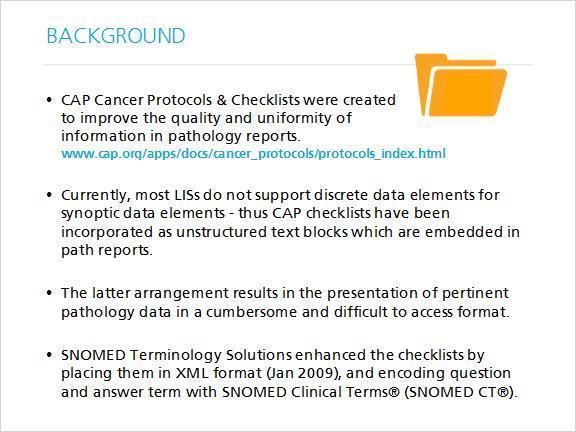
93 4.4 Background

94 4.5 Synoptic Report
95 4.6 Synoptic Reporting Tool
96 4.7 Synoptic Reporting: Entry Design
97 4.8 Synoptic Reporting: Entry Design

98 4.9 Synoptic Reporting: Dictionary Structure

99 4.10 Synoptic Worksheet

100 4.11 Synoptic Worksheet

101 4.12 Synoptic Worksheet

102 4.13 Synoptic Diagnosis Worksheet

103 4.14 Synoptic Diagnosis Worksheet

104 4.15 Diagnosis Report

105 4.16 Diagnosis Report
106 4.17 Synoptic Reporting: Workflow
107 4.18 Synoptic Reporting: Reporting

108 4.19 Synoptic Report
109 4.20 Synoptic Reporting: Leveraging Data

110 4.21 Search

111 4.22 Synoptic Reporting: Data Mining

112 4.23 Synoptic Reporting: Data Mining
113 4.24 Synoptic Reports of Molecular Testing
114 4.25 Synoptic Report with Prognostic and Theranostic Data

115 4.26 Mining Synoptic Data for Biospecimen Management

116 4.27 Using Synoptic Report for Evaluation for Performance
117 4.28 Benefits Realized at our Hospitals
118 4.29 Questions

119 4.30 Knowledge Check

120 5. Digital Pathology 5.1 Digital Imaging & the LIS

121 5.2 Digital Pathology

122 5.3 A Better Lens on Disease

123 5.4 Digital vs. Glass
124 5.5 Images in LIS

125 5.6 Current Applications of Digital Pathology In Our Practice
126 5.7 PACS Workflow Diagram
127 5.8 Why a pathology image should not be considered as a radiology image

128 5.9 Magnitude of Whole Slide Image Dataset Size

129 5.10 File Sizes
130 5.11 Pathology Image Metadata

131 5.12 Images in LIS
132 5.13 LIS Integration CONSIDERATIONS
133 5.14 Imaging Process
134 5.15 Imaging Process
135 5.16 Imaging Process

136 5.17 Imaging Process

137 5.18 Types of Digital Images

138 5.19 Types of Imaging Devices

139 5.20 Types of Imaging Devices

140 5.21 Types of Imaging Devices
141 5.22 Image Storage

142 5.23 You can't have everything.
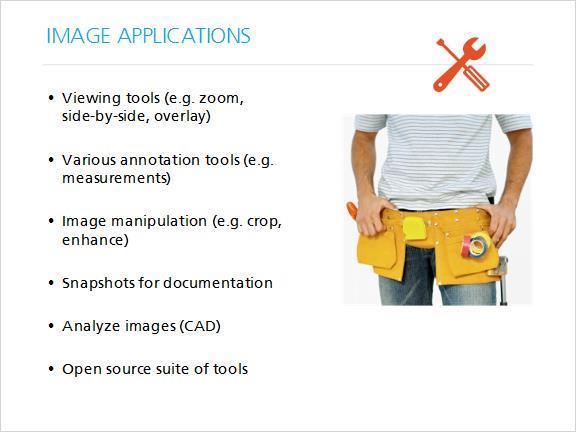
143 5.24 Image Applications
144 5.25 Image Applications
145 5.26 Image Sharing

146 5.27 Hematology Analyzer & Remote Review System

147 5.28 Image Example
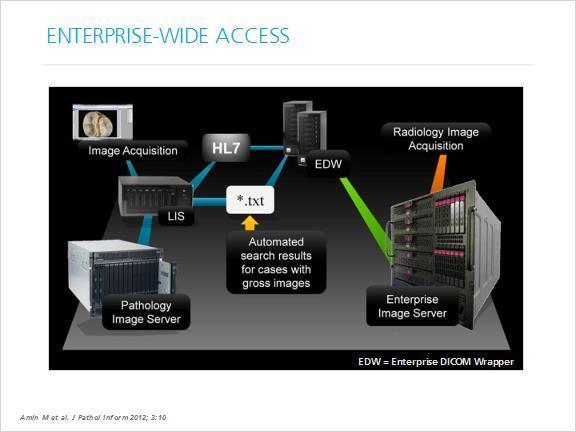
148 5.29 Enterprise-Wide Access
149 5.30 Enterprise-Wide Access

150 5.31 Enerprise-Wide Access
151 5.32 Workflow Factors
152 5.33 Image Management Options

153 5.34 Integral Image Management
154 5.35 Modular Image Management
155 5.36 Workstations
156 5.37 AP-LIS Integration

157 5.38 Combining Morphology with Patient Information

158 5.39 Combining Histology with Digital Pathology
159 5.40 The Histology Workstation

160 5.41 Combining Morphology with Patient Information

161 5.42 As digital pathology systems mature

162 5.43 Digital Imaging Roadmap

163 5.44 Improved Patient Care!

164 5.45 Improved Workflow = Reduced Errors + More Efficient

165 5.46 Digital Pathology: Value Proposition 5.47 Knowledge Check (Drag and Drop, 0 points, 1 attempt permitted)

166 Drag Item Drop Target Image metadata automatically stored in the LIS database INTEGRAL Gallery within LIS Greater user flexibility to share & manipulate images MODULAR Separate from the LIS Users need access to the LIS
167 INTEGRAL Gallery within LIS Not all devices are interfaced INTEGRAL Gallery within LIS Restricted editing & sharing tools INTEGRAL Gallery within LIS Images need to be fed into the LIS MODULAR Separate from the LIS Any imaging modality is supported MODULAR Separate from the LIS Requires Middleware MODULAR
168 Separate from the LIS Image format may be proprietary INTEGRAL Gallery within LIS Drag and drop properties Return item to start point if dropped outside any drop target Snap dropped items to drop target (Free) Feedback: Nice job. You're almost done with this course. Now, Dr. Parwani will conclude with a few brief points.

169 6. Conclusions 6.1 Conclusions
170 6.2 Conclusions

171 6.3 Questions
172 6.4 Thank you

173 6.5 Journal of Pathology Informatics 6.6 Knowledge Check (Text Entry, 10 points, 3 attempts permitted)

174 Feedback when correct: Excellent. You're almost done! Feedback when incorrect: The correct answer is:

175 Pathology informatics enables people and processes! 6.7 Congratulations!